Download to read offline


![d. Microsoft Office Integration: In many deployments, the BI platform
is used at the middle tier (application tier) to manage, secure and also
execute the BI tasks. In Microsoft Office, Excel acts as the BI client.
Some of the BI platforms include other Office applications, such as the
Word and the PowerPoint. The advanced functionality includes the
ability to prepare new reports in Microsoft Office which can be saved
back to the middle tier BI server, and the ability to centrally control and
secure the BI documents in Office.
[Caching - storing data for future use
multi-pass SQL enables the users to create more complex reports, and
have more flexibility in answering business questions on the reports.]](https://image.slidesharecdn.com/bimodule5-210401113731/85/Business-Intelligence-Module-5-8-320.jpg)

![[Semantic layer maps complex data into familiar business terms so that users
across the enterprise can access the same source of truth, with full confidence
in its integrity]
a. Infrastructure: To assess this category, each BI platform has to be integrated,
including the common security, metadata, administration, portal integration,
object model, query engine and also shared look- and-feel. The real litmus test
for the tightly integrated infrastructure is the capability to deploy all the BI
functionality with a single installation.
b. Metadata: Strong metadata is the vital capability of a BI platform. Not only
should all the tools leverage the same metadata, but the offering should also
give a strong way to capture, store, re use and publish the metadata objects. To
assess a BI platform’s capability in this area, analysts look for a single repository
for different types of BI metadata, which includes the dimensions, hierarchies,
measures, performance metrics and report design objects.](https://image.slidesharecdn.com/bimodule5-210401113731/85/Business-Intelligence-Module-5-10-320.jpg)


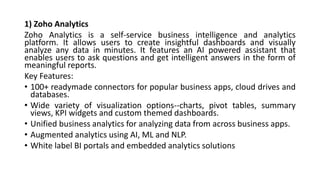


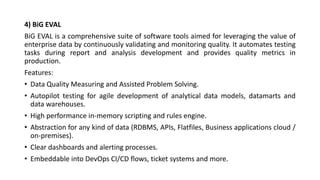


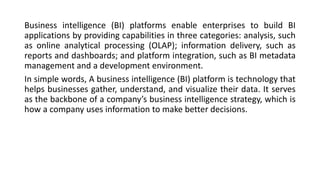
The document discusses the capabilities of business intelligence (BI) platforms. It describes three main categories of capabilities: integration, information delivery, and analysis. Each category contains several specific capabilities like reports, dashboards, query tools, predictive modeling, etc. The document provides details on each capability and evaluates how well various BI platforms measure up based on these capabilities. It aims to help organizations understand what a comprehensive BI platform should provide.


![ict_presentation_final_final_final[1].pptx](https://cdn.slidesharecdn.com/ss_thumbnails/ictpresentationfinalfinalfinal1-251230145259-2b4839bd-thumbnail.jpg?width=640&height=640&fit=bounds)


