Download as PPSX, PPTX


![The Great Depression [continued]](https://image.slidesharecdn.com/businesscycles-130130210352-phpapp01/85/Business-cycles-16-320.jpg)
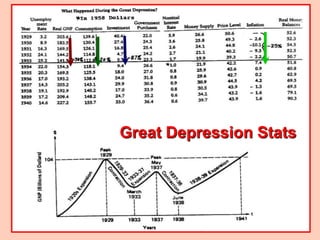


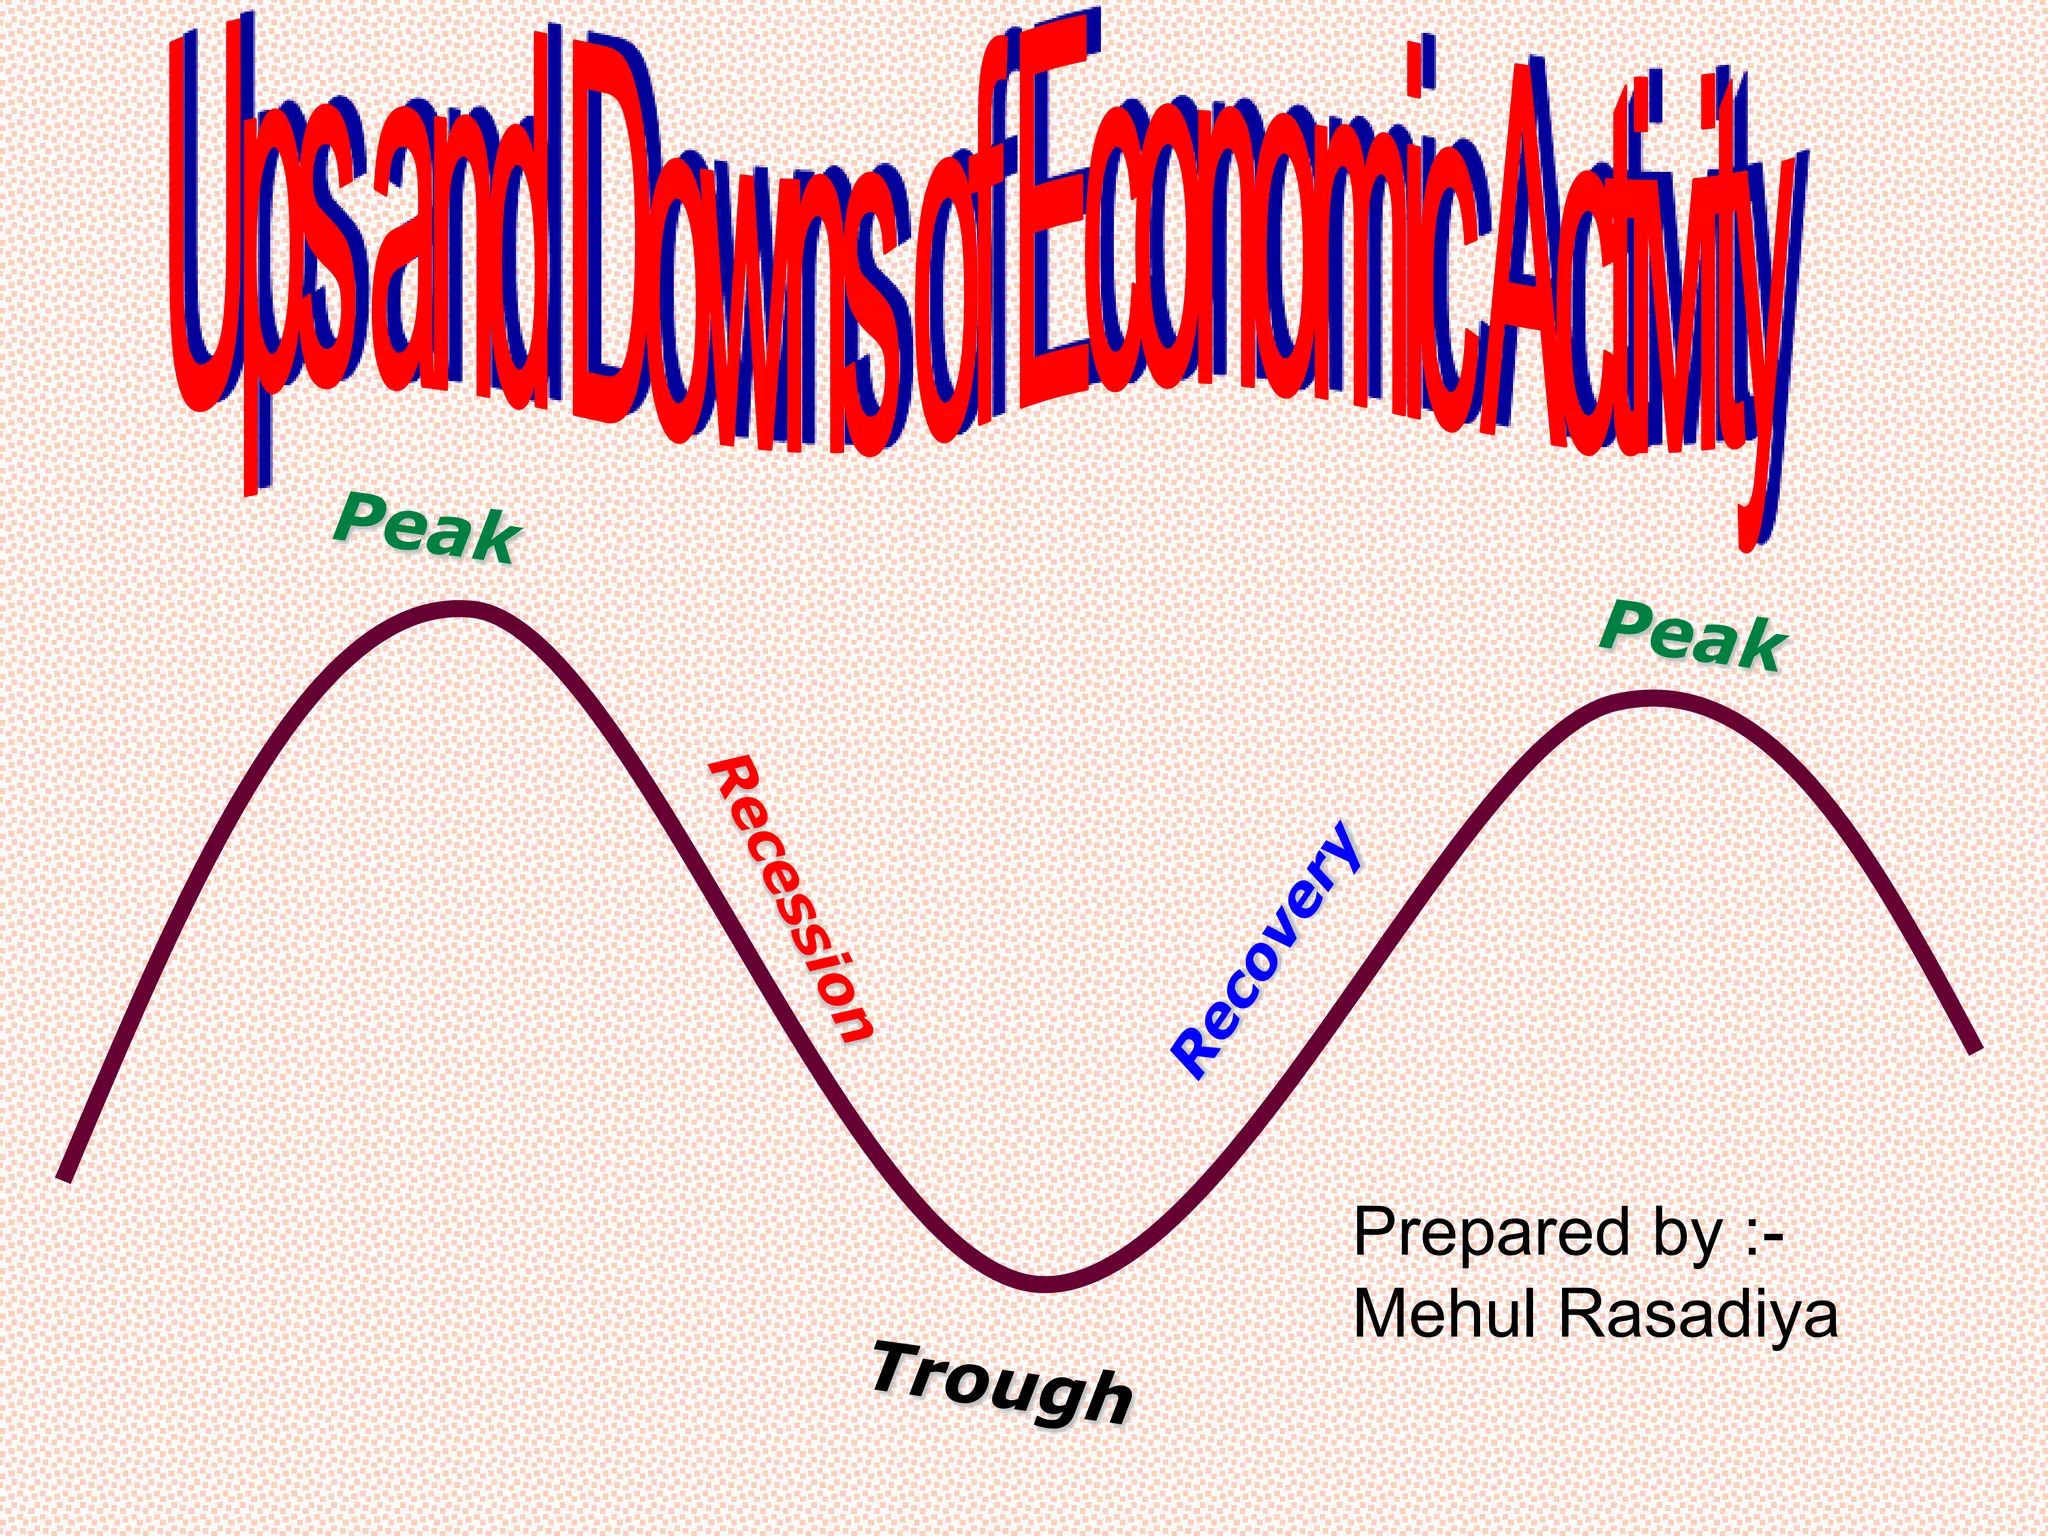
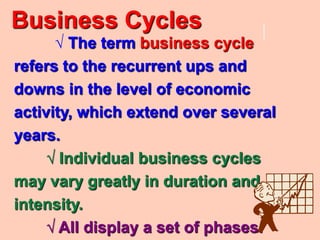
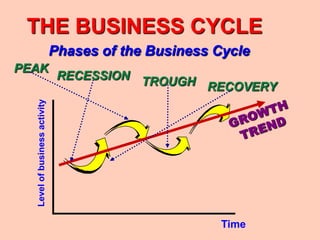
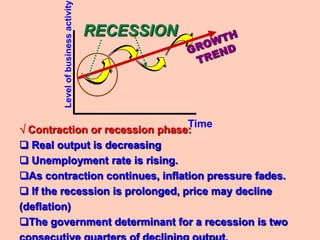
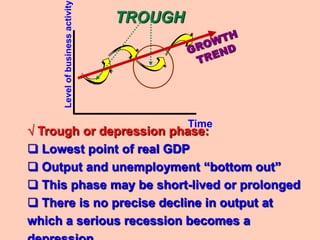
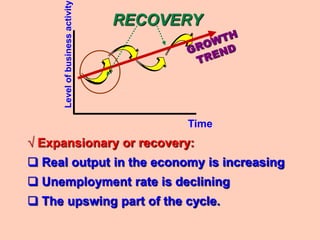
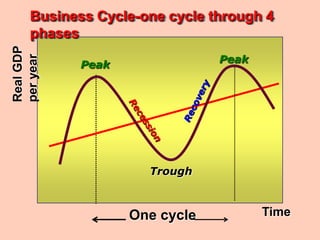
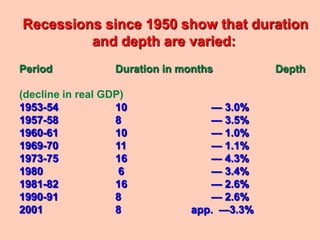
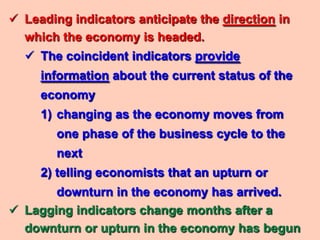
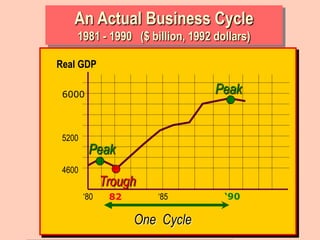
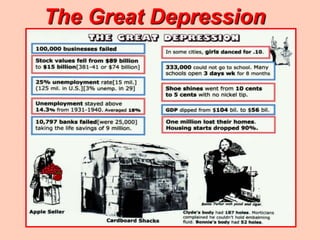
The document summarizes the business cycle, which refers to recurring periods of economic expansion and contraction. It describes the four phases of the business cycle - peak, recession, trough, and recovery - and how indicators are used to monitor shifts between phases. Examples of past recessions in the US since 1950 are provided to show how they can vary in duration and severity. The Great Depression of the 1930s is discussed as the worst economic downturn in modern history.


