Downloaded 287 times
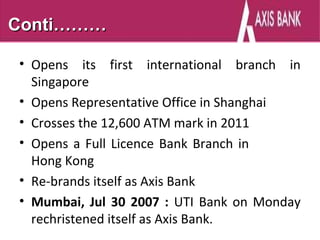
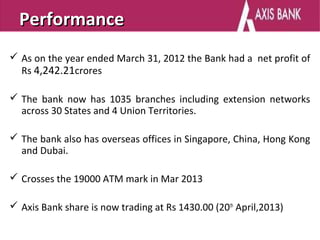


Axis Bank was incorporated as UTI Bank in 1994 and has since grown to become one of the largest private sector banks in India. It has over 1035 branches across 30 states and union territories in India as well as international offices in Singapore, China, Hong Kong, and Dubai. The bank analyzes its performance using various financial ratios that measure profitability, leverage, liquidity, and payouts. These ratios indicate that between 2008-2012 the bank improved its earnings, returns, and ability to cover costs and debts while maintaining adequate current assets to meet short-term obligations.


