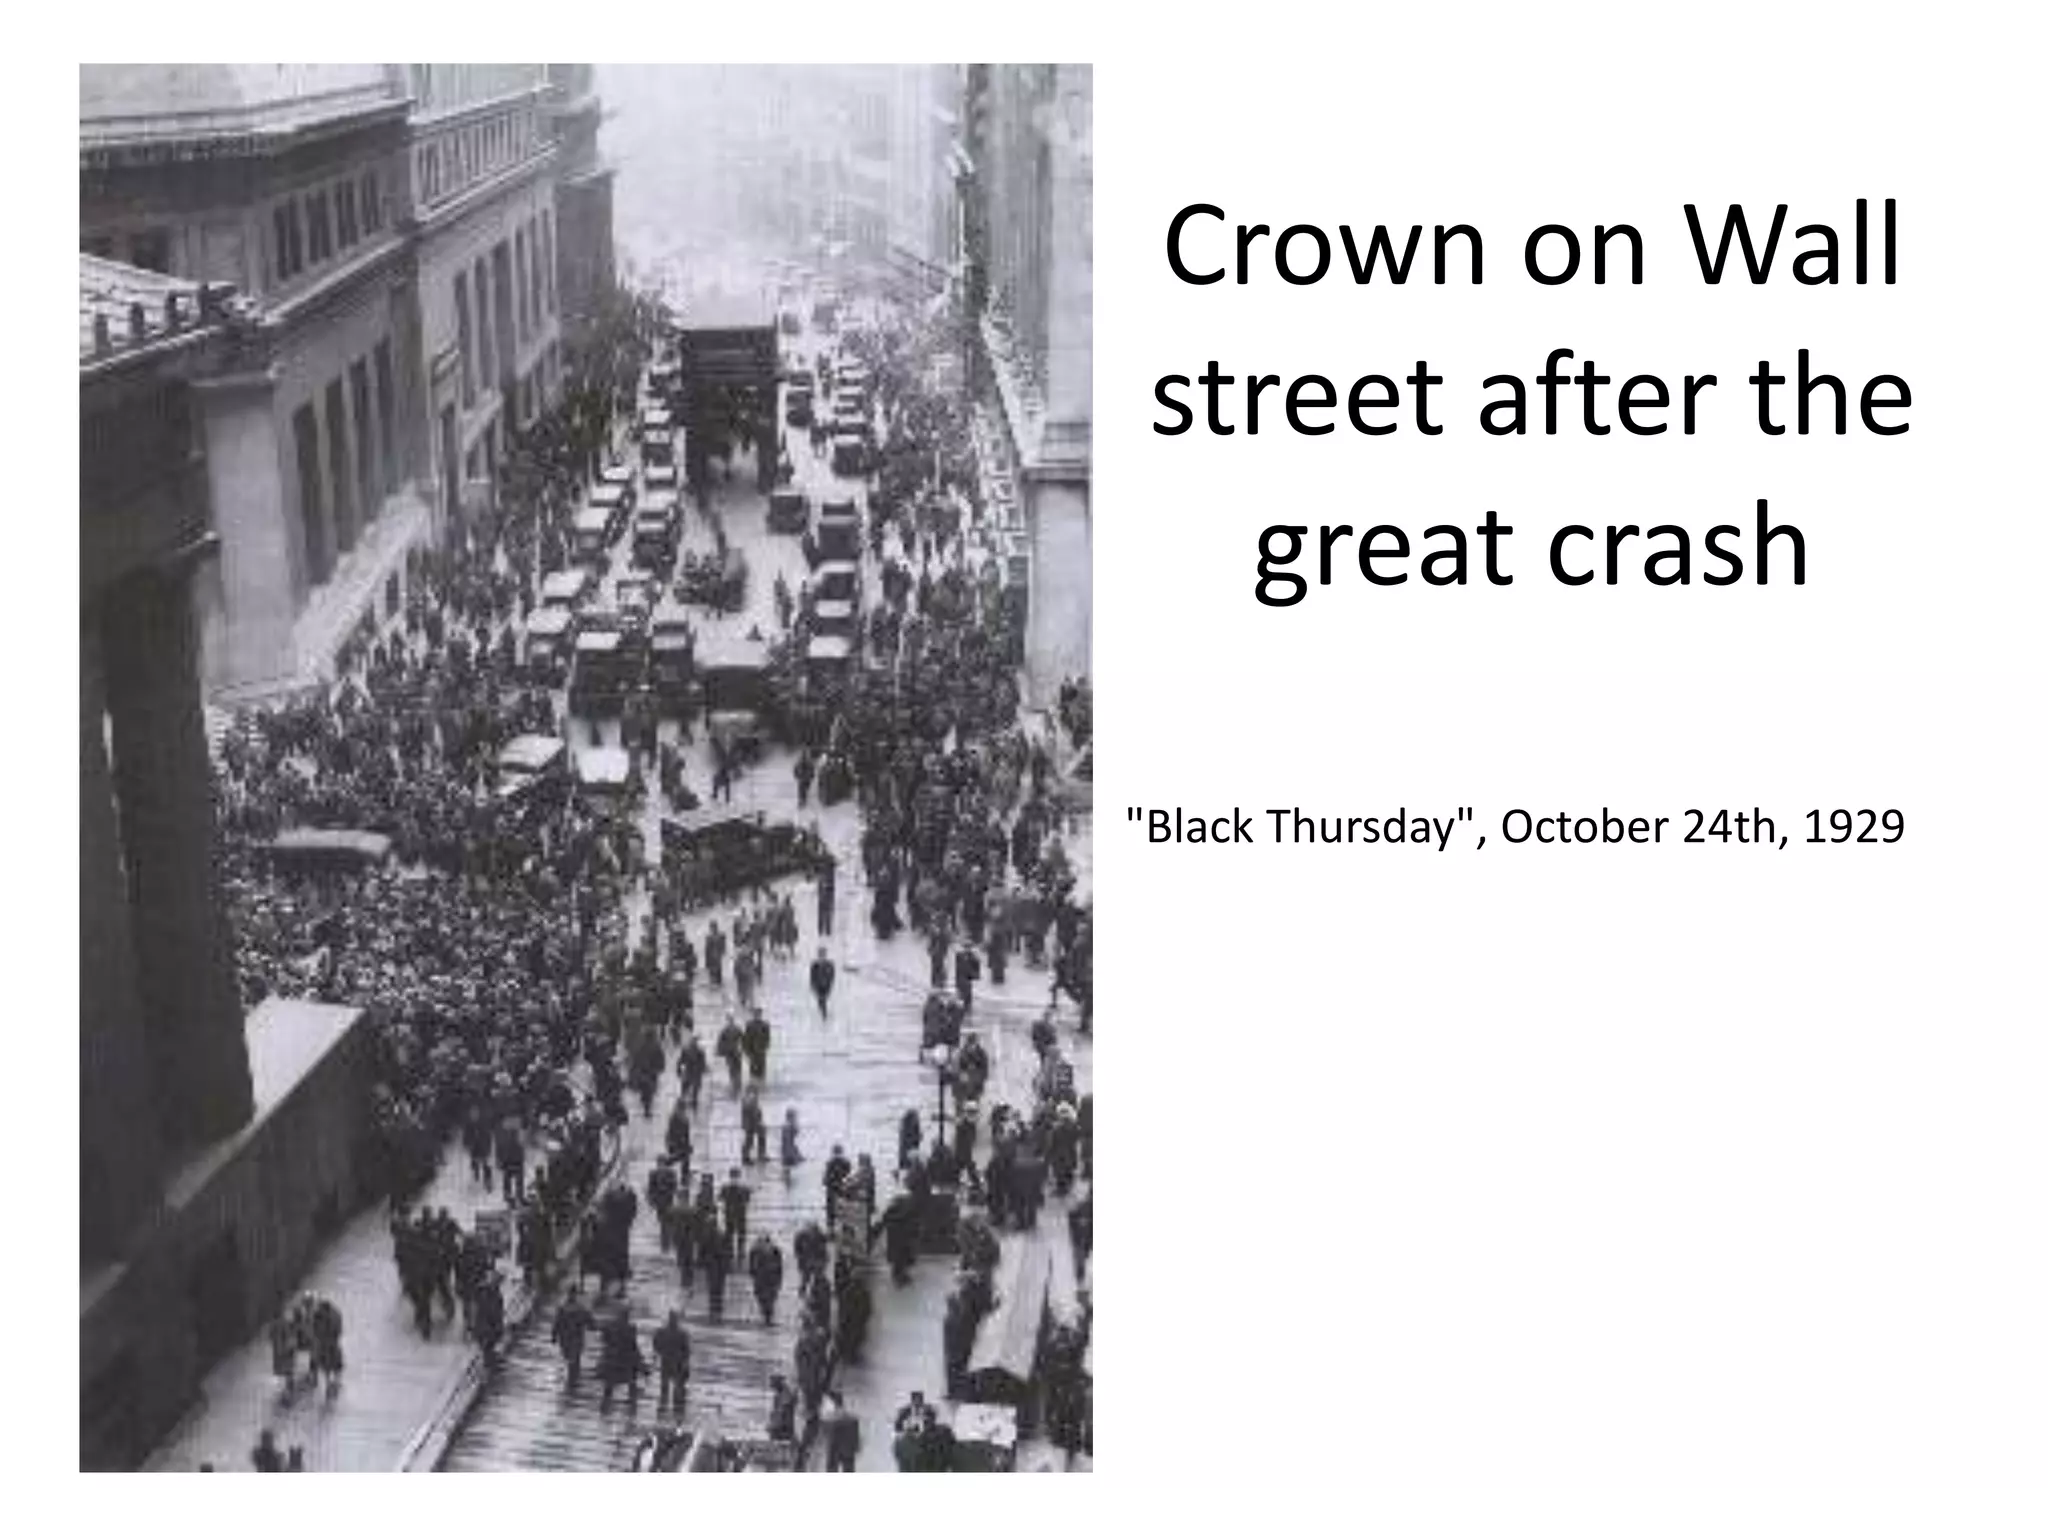
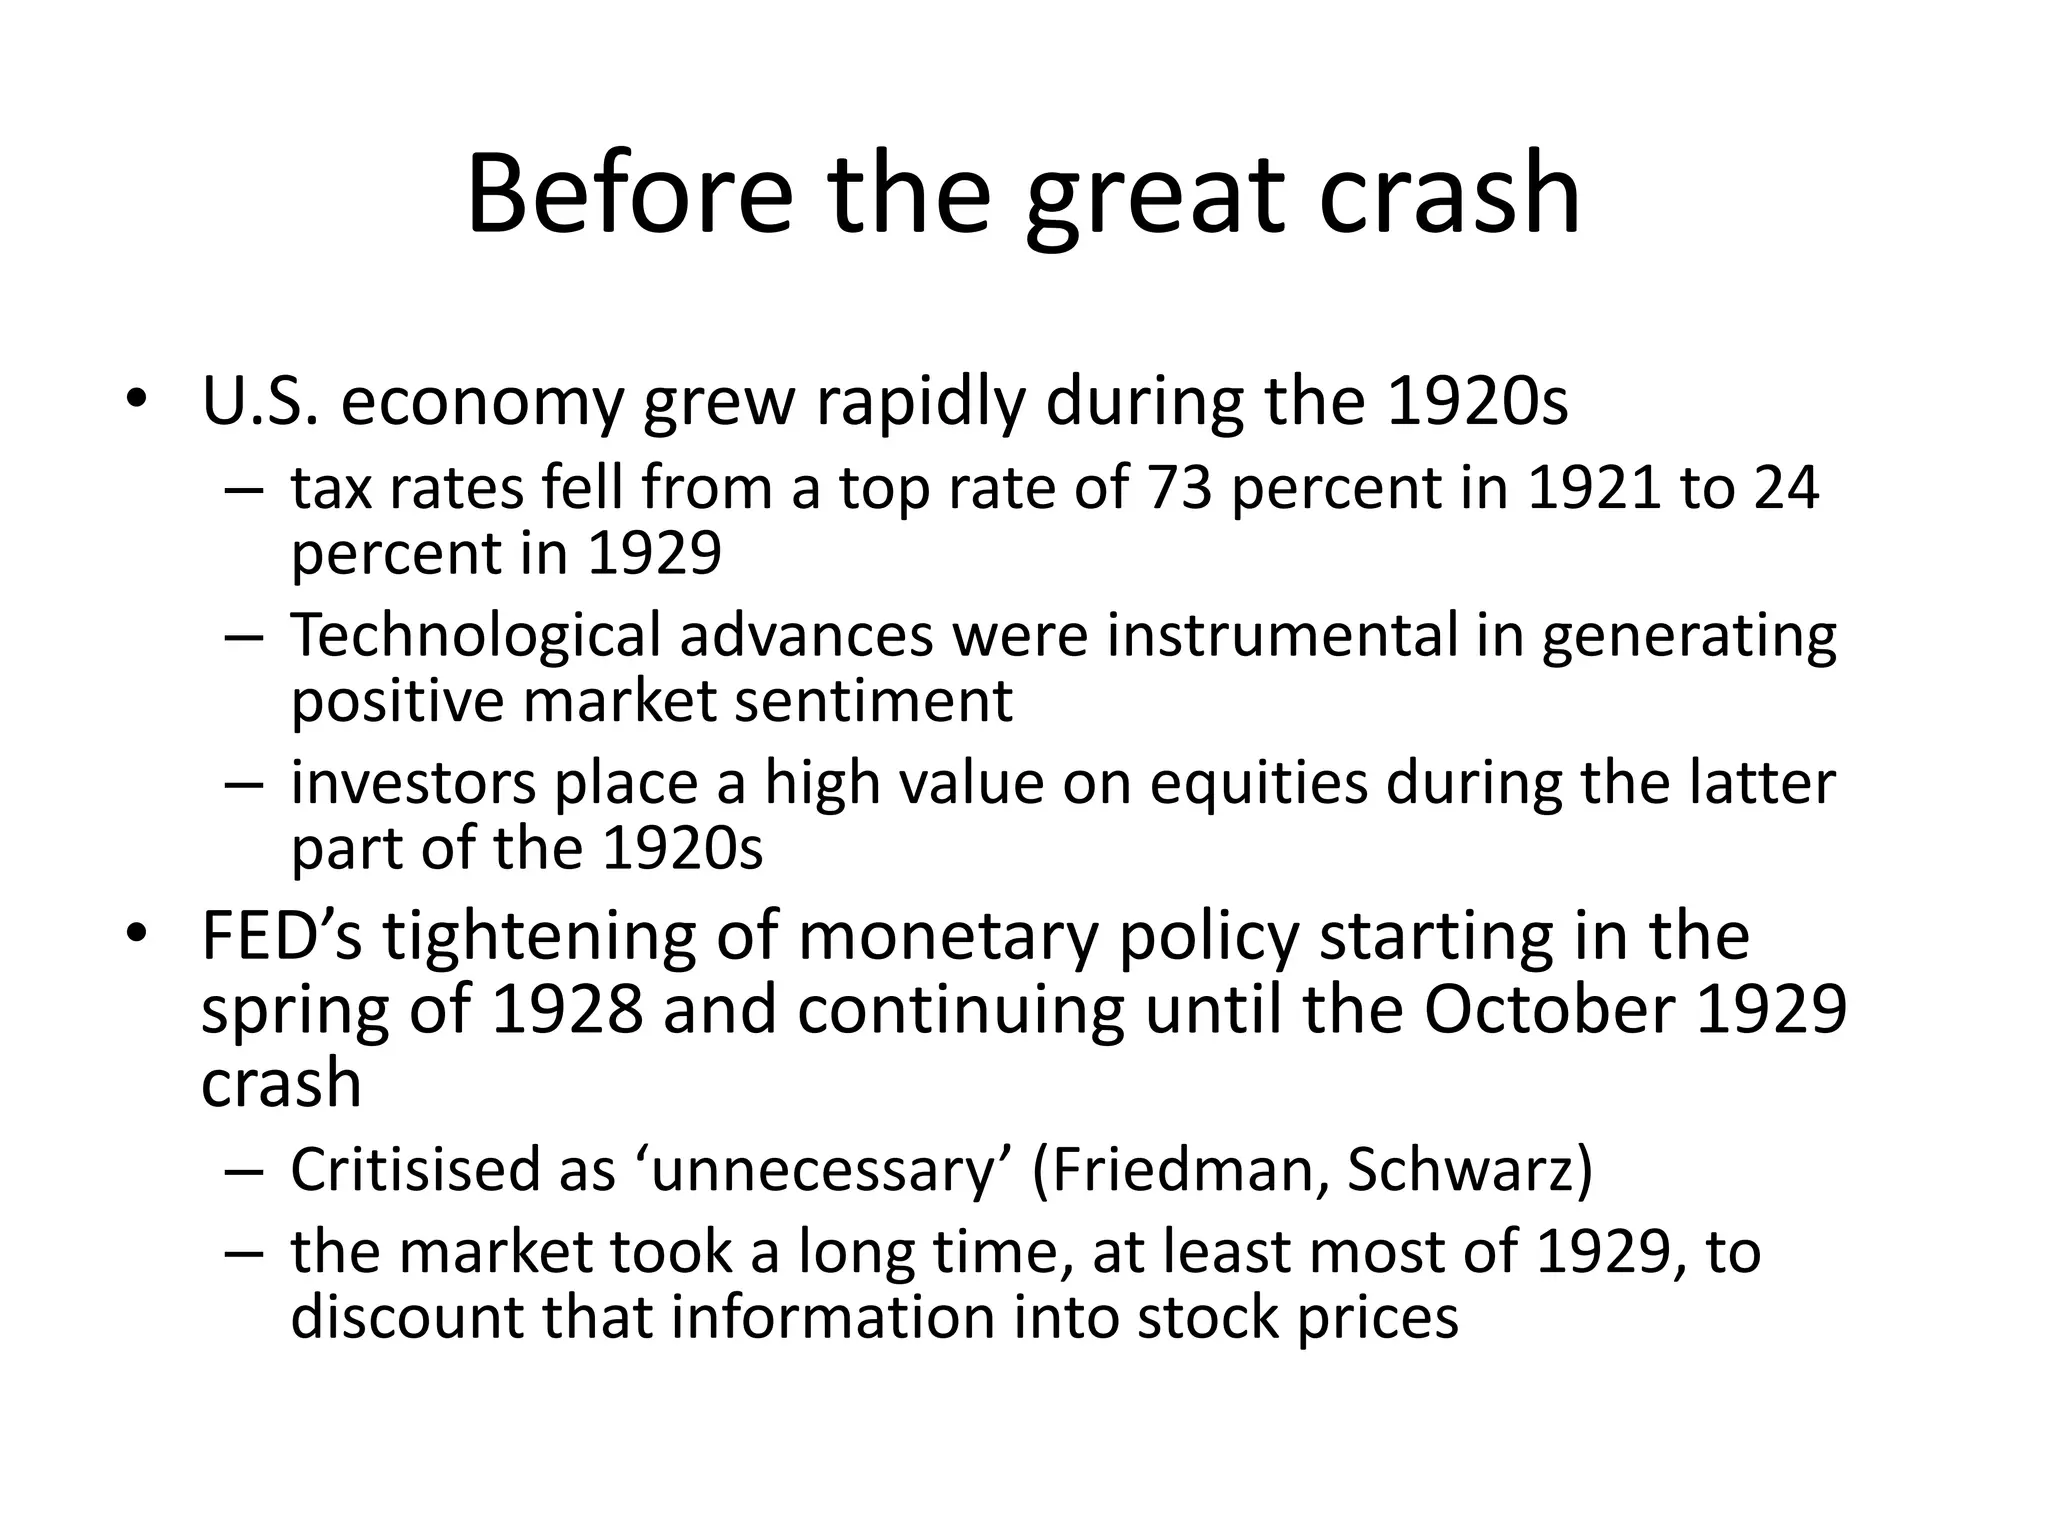
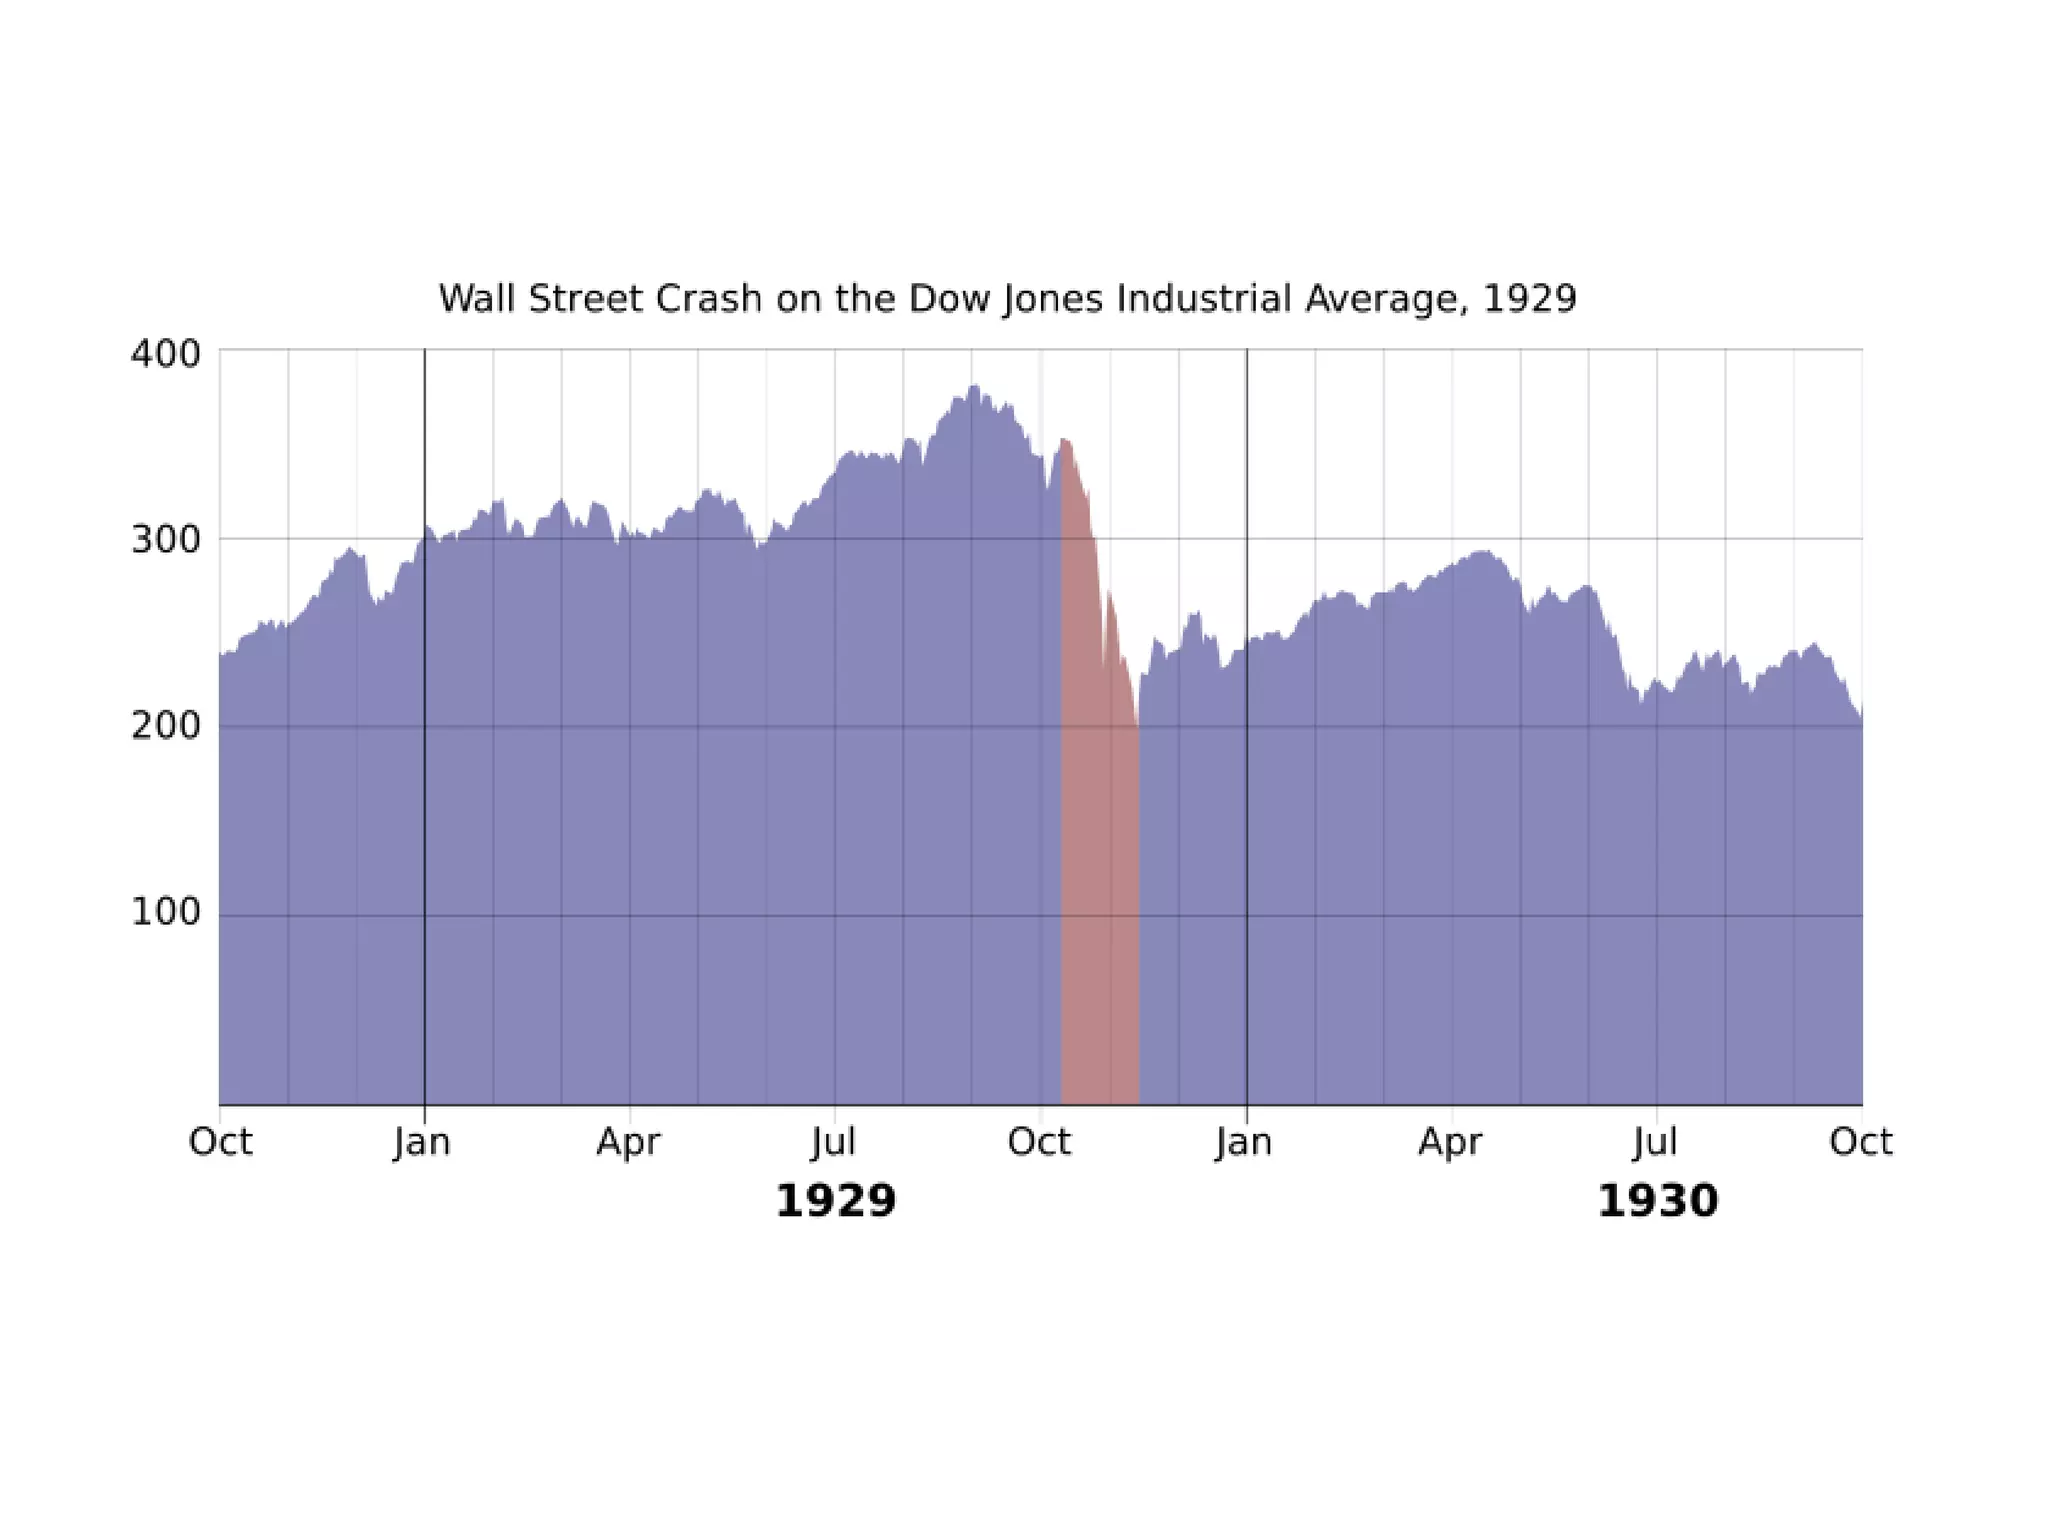
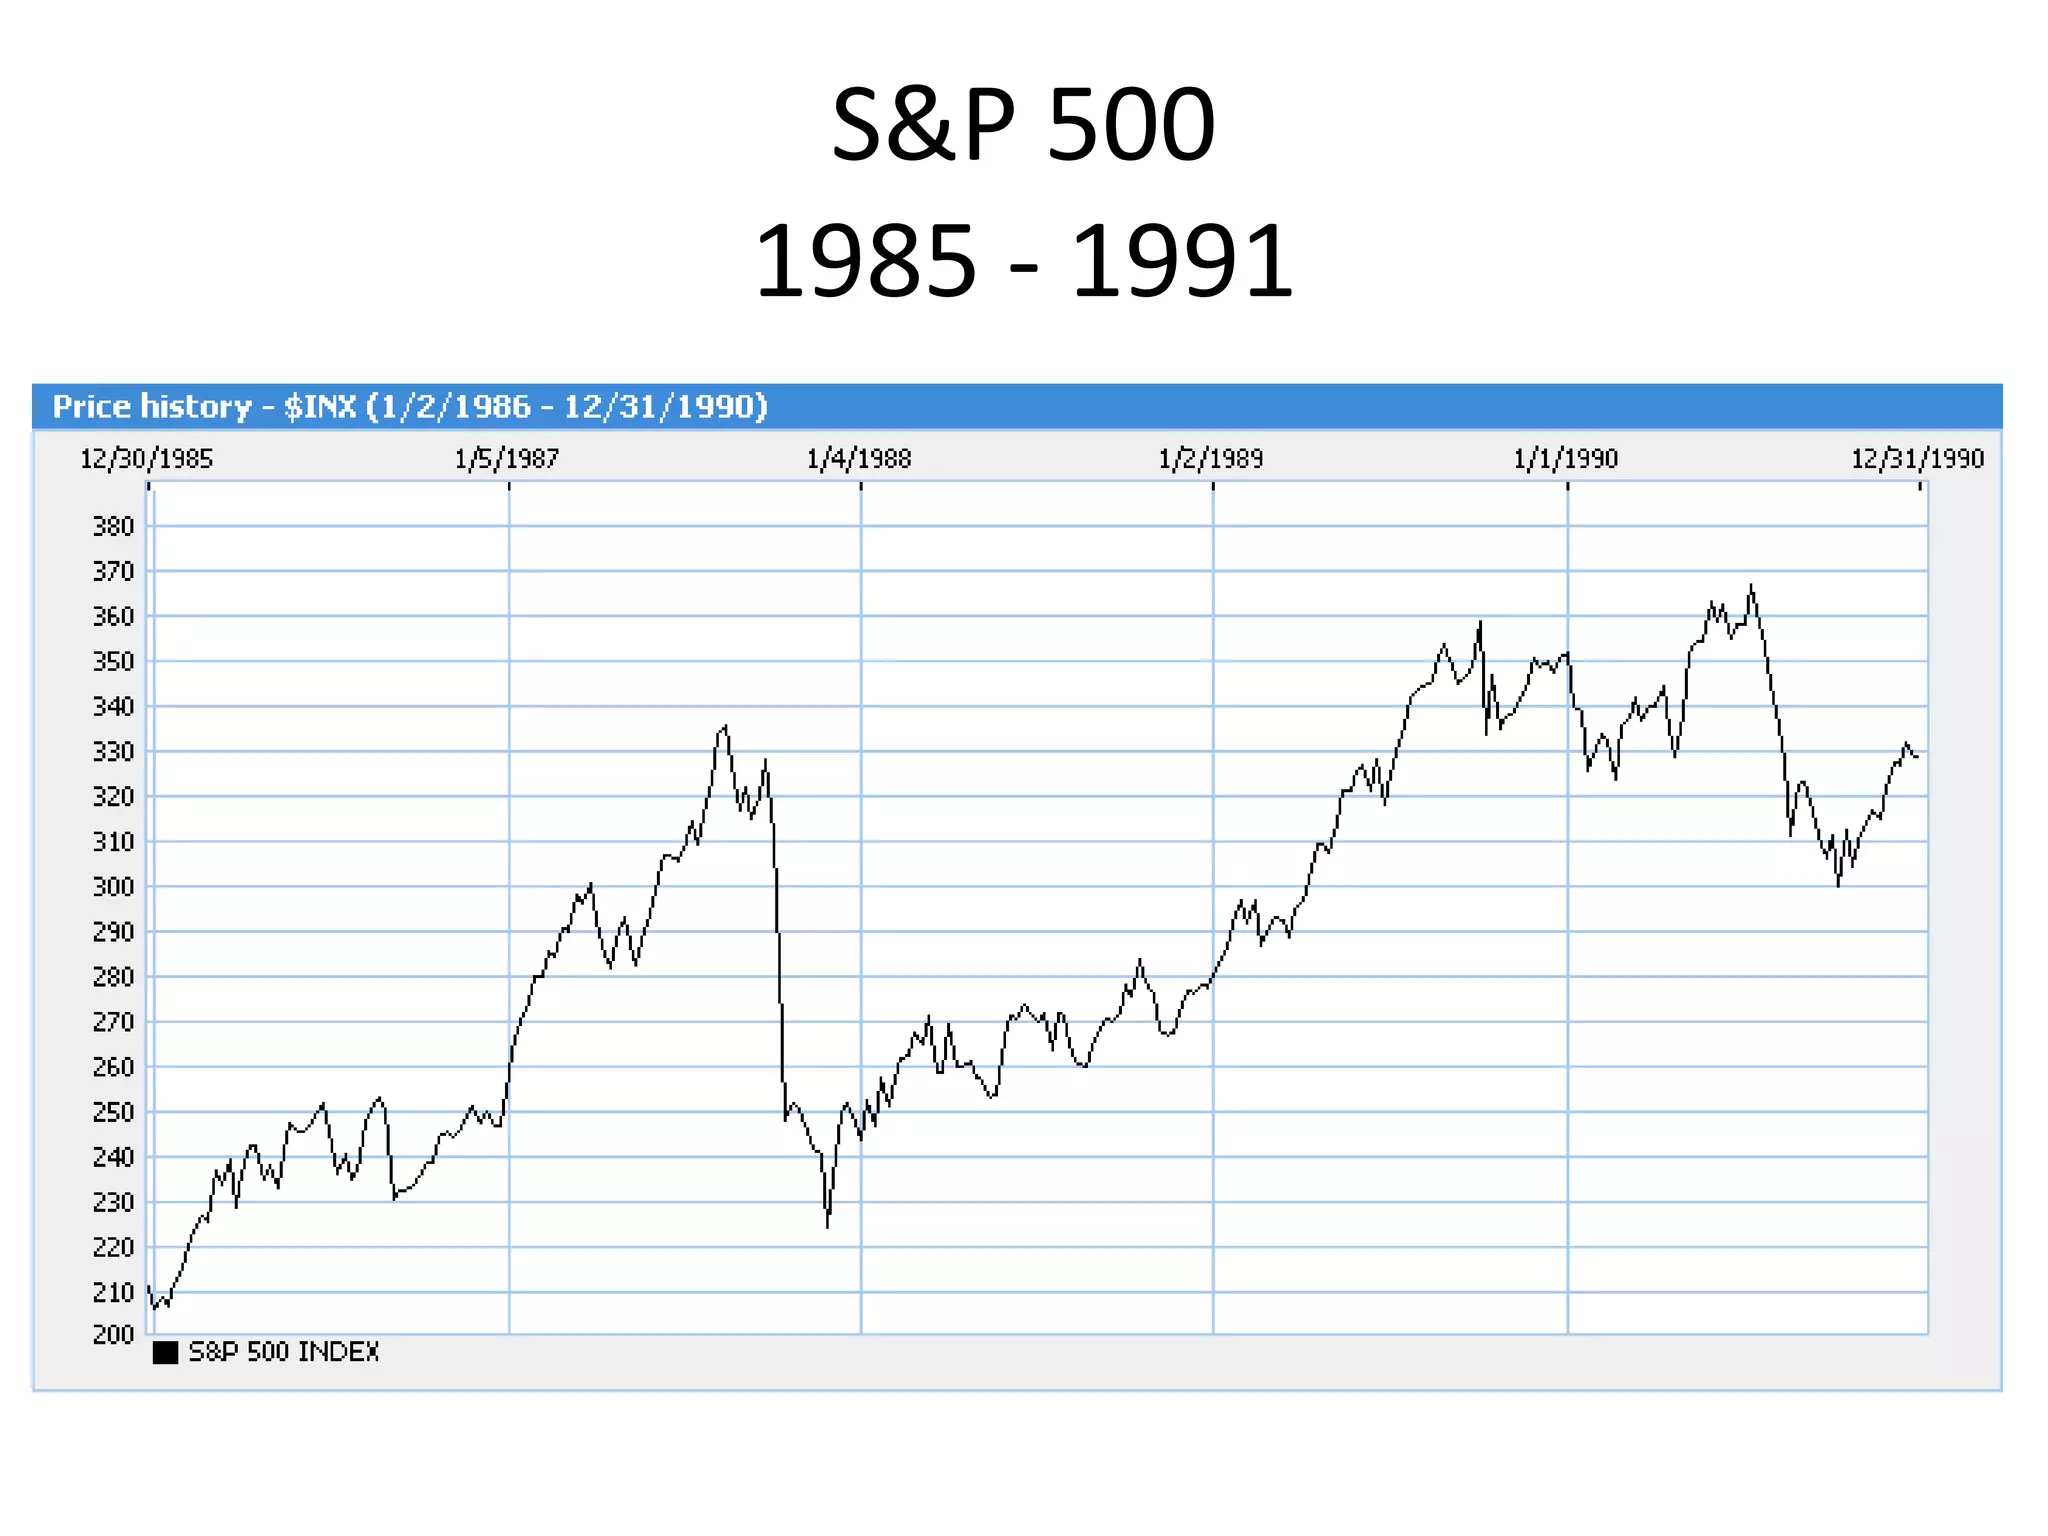
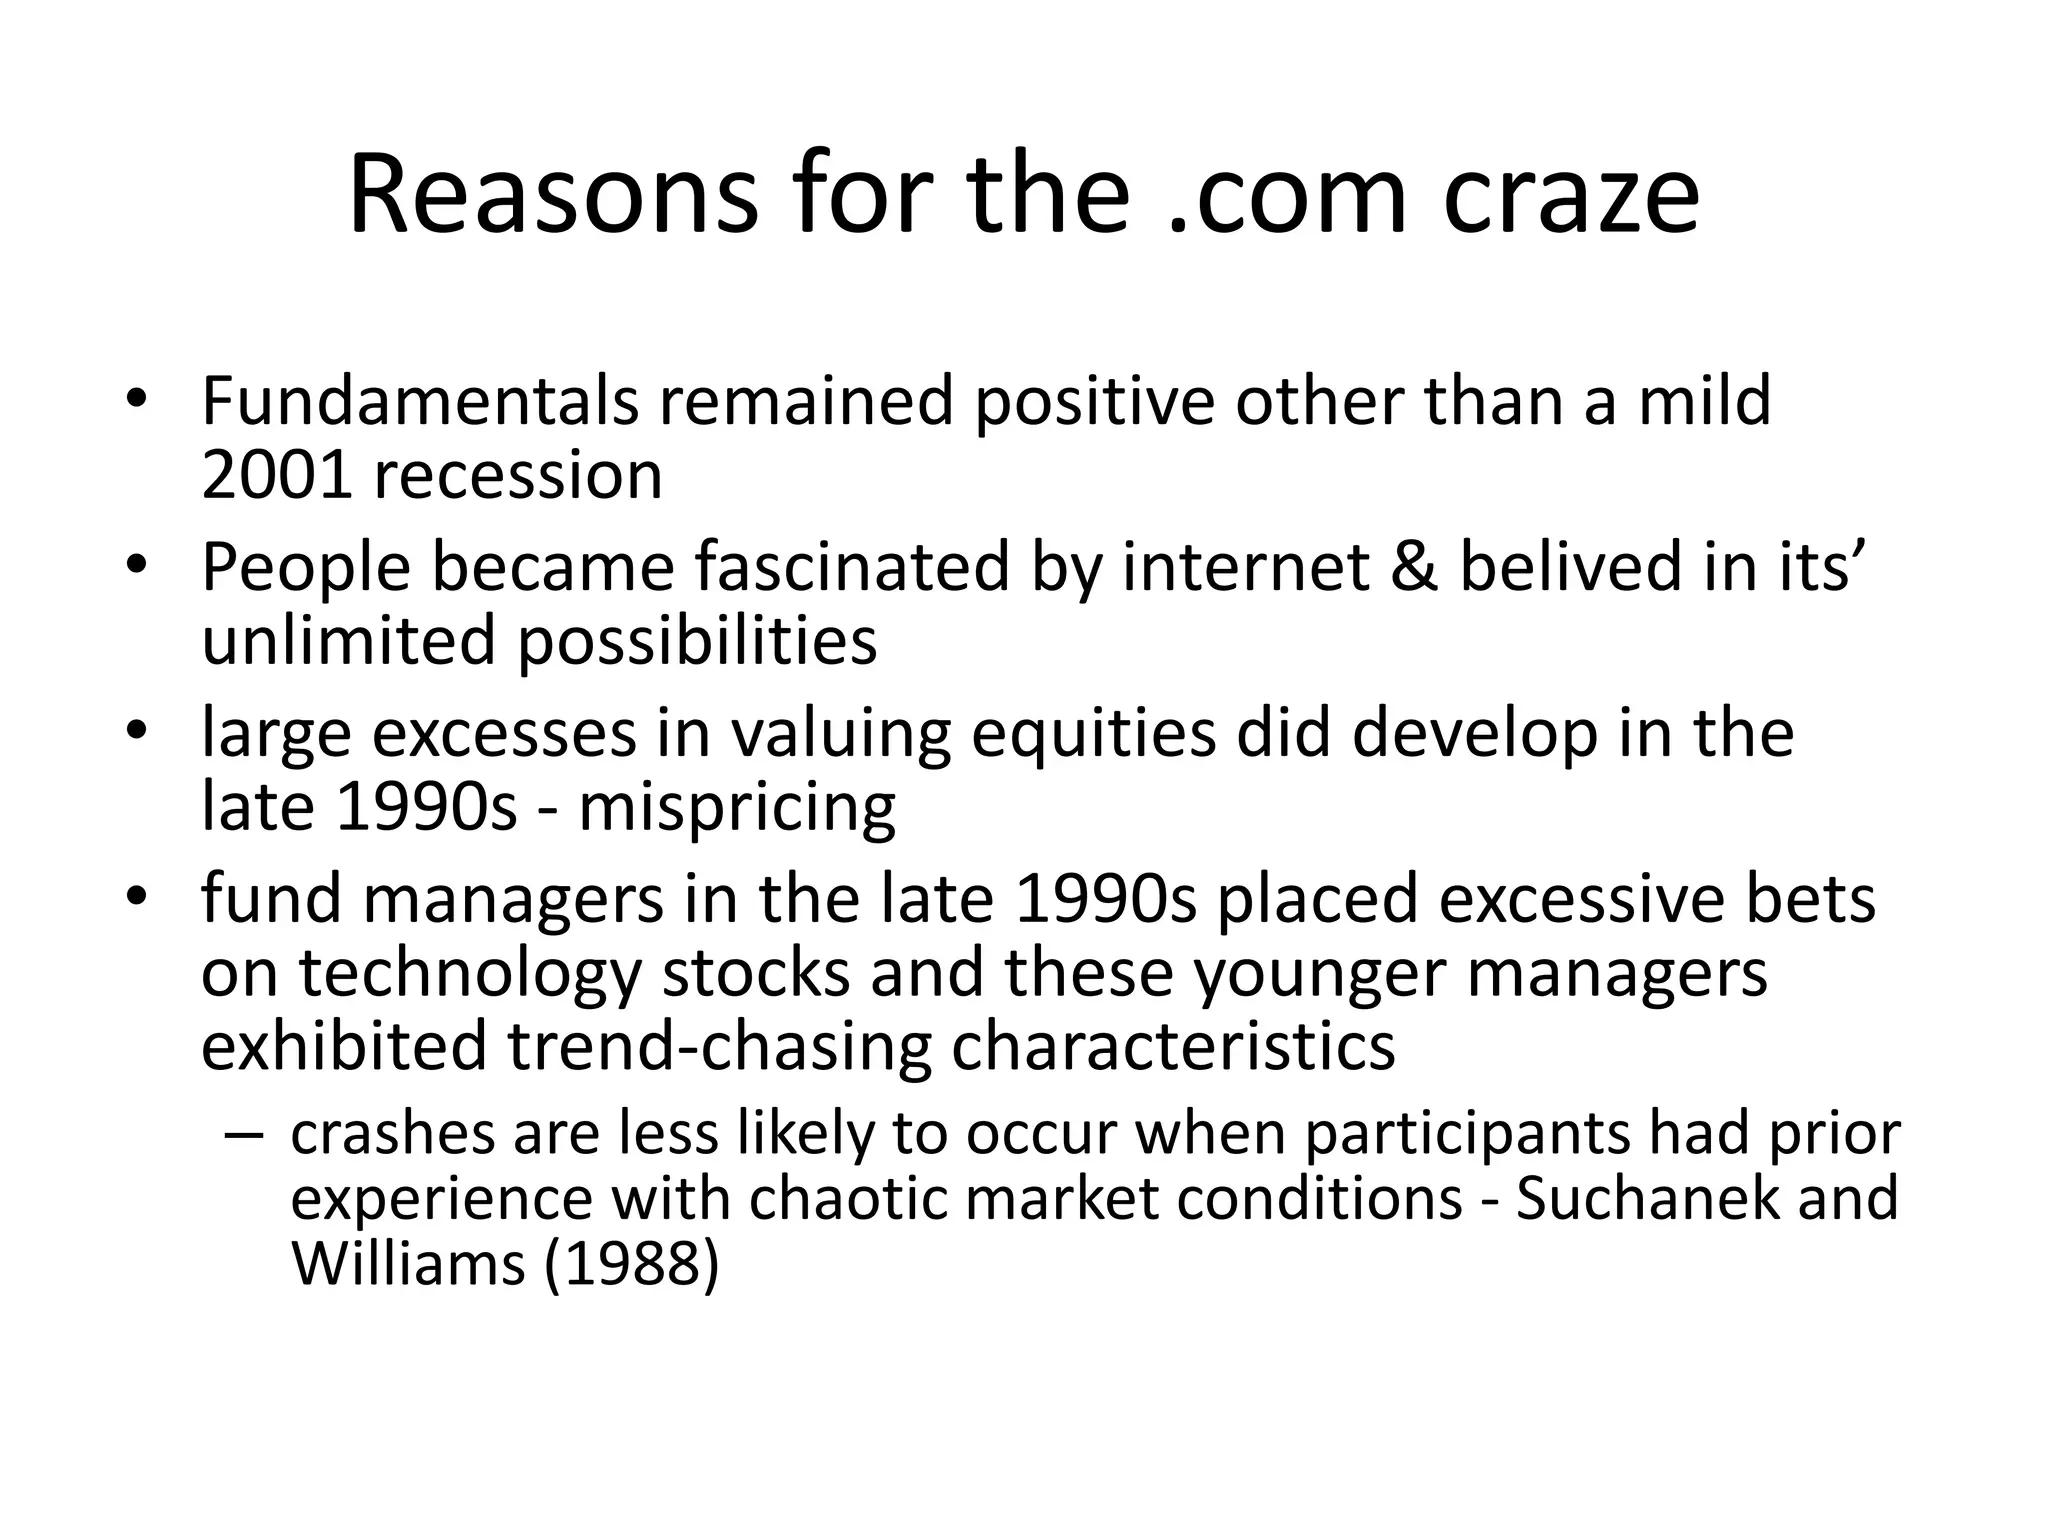
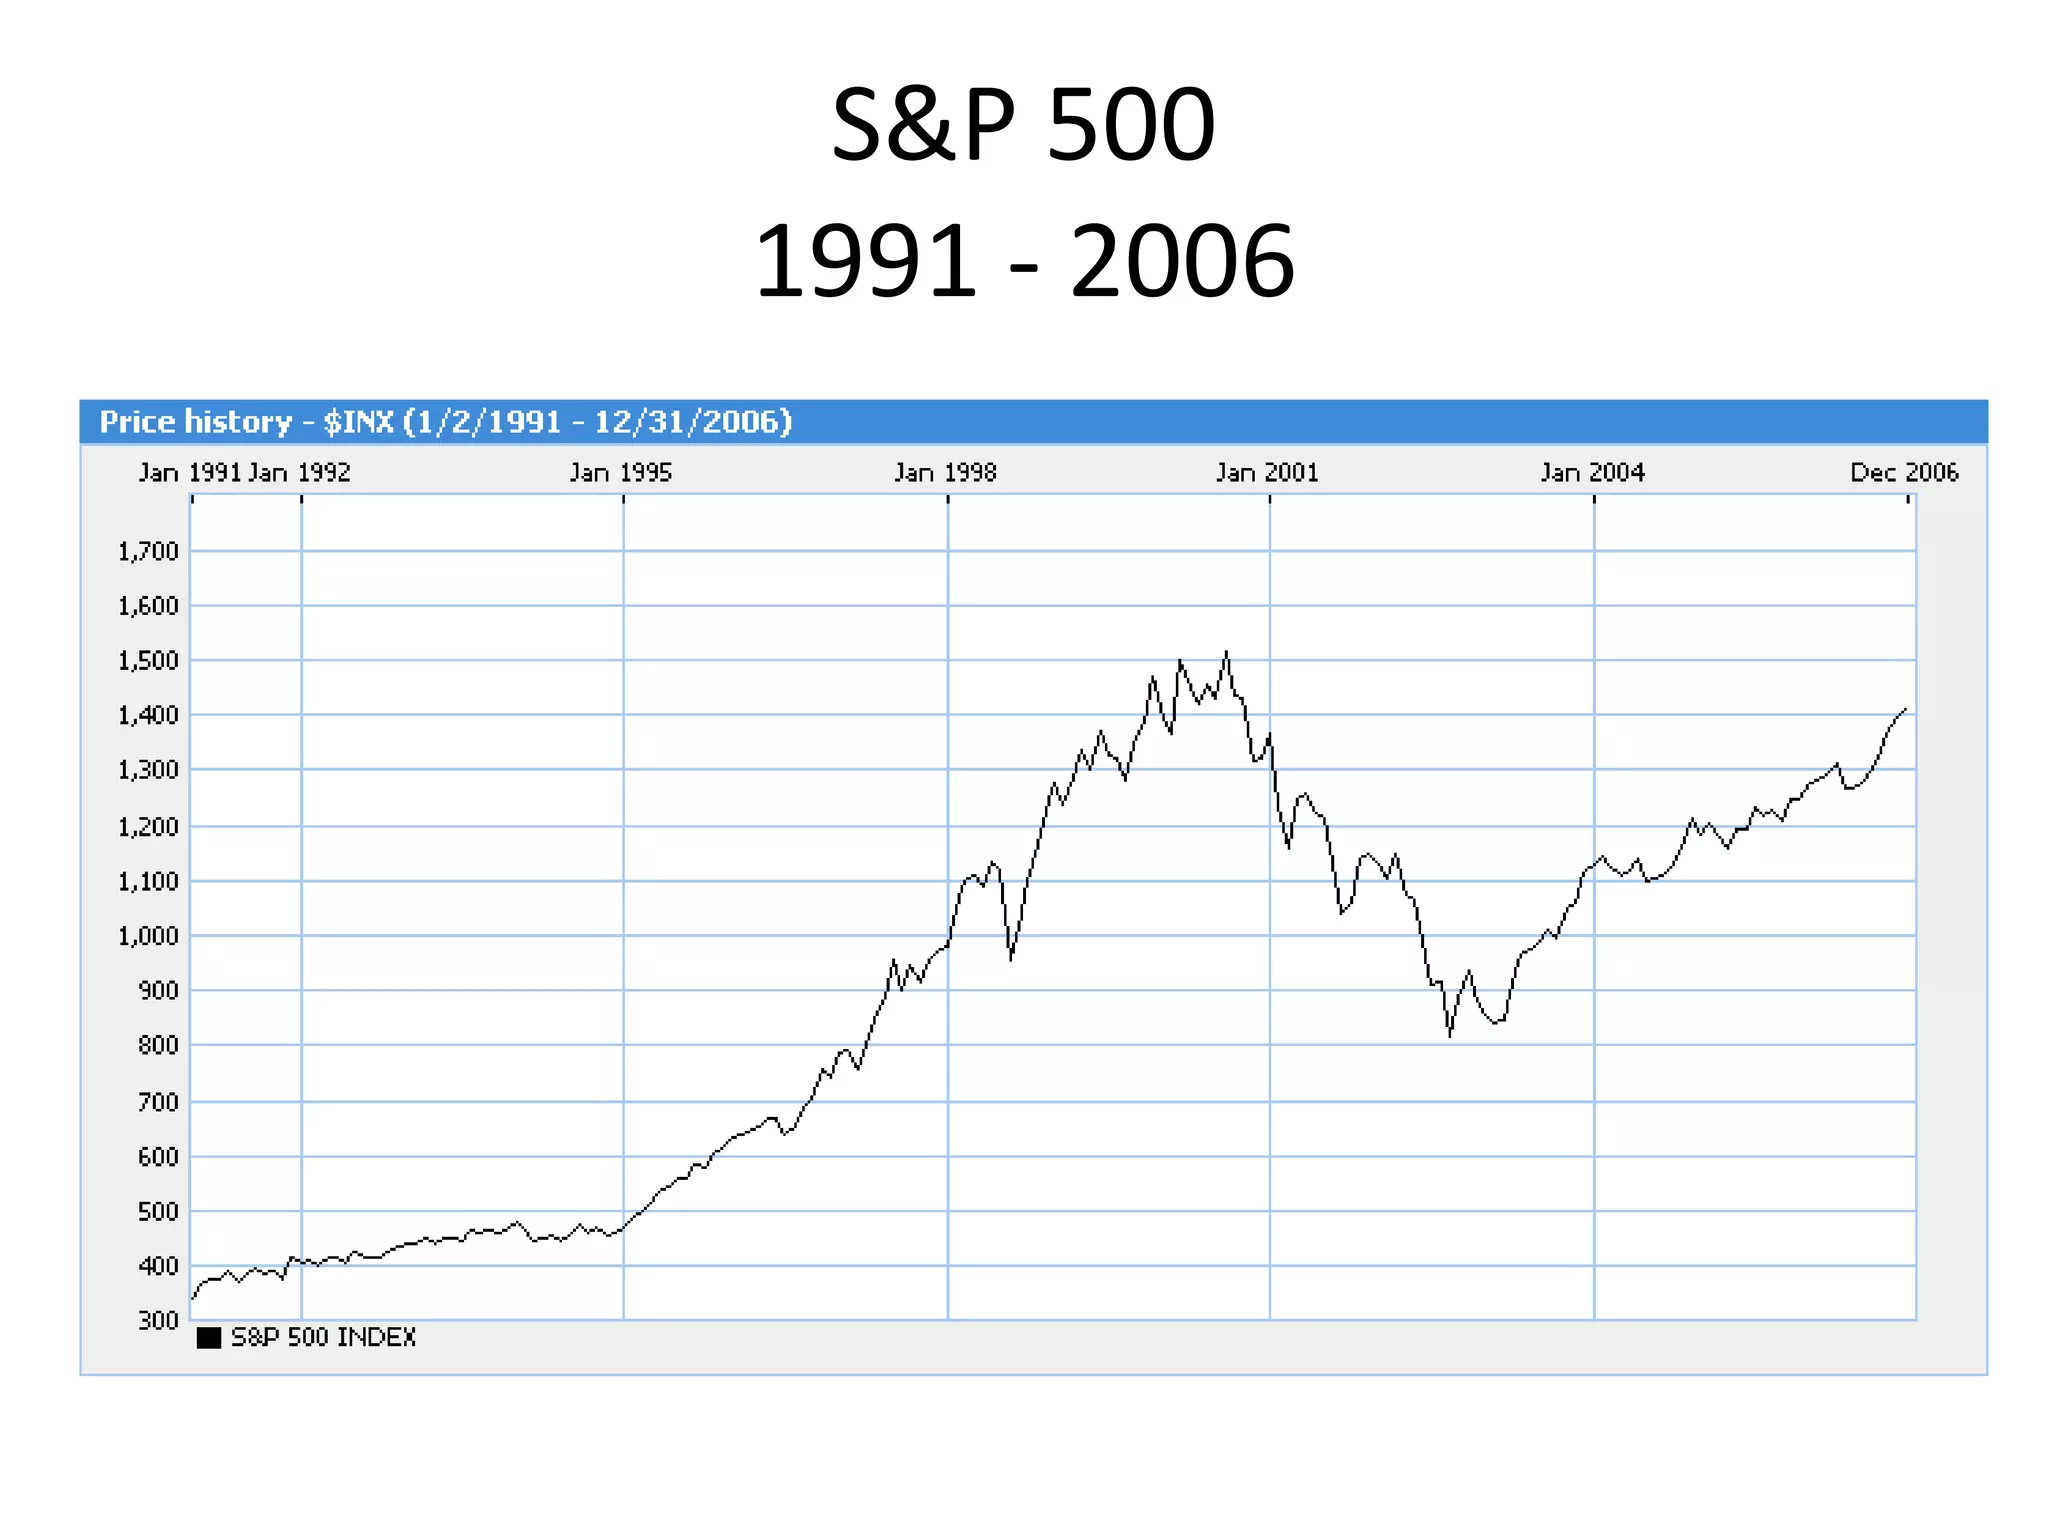
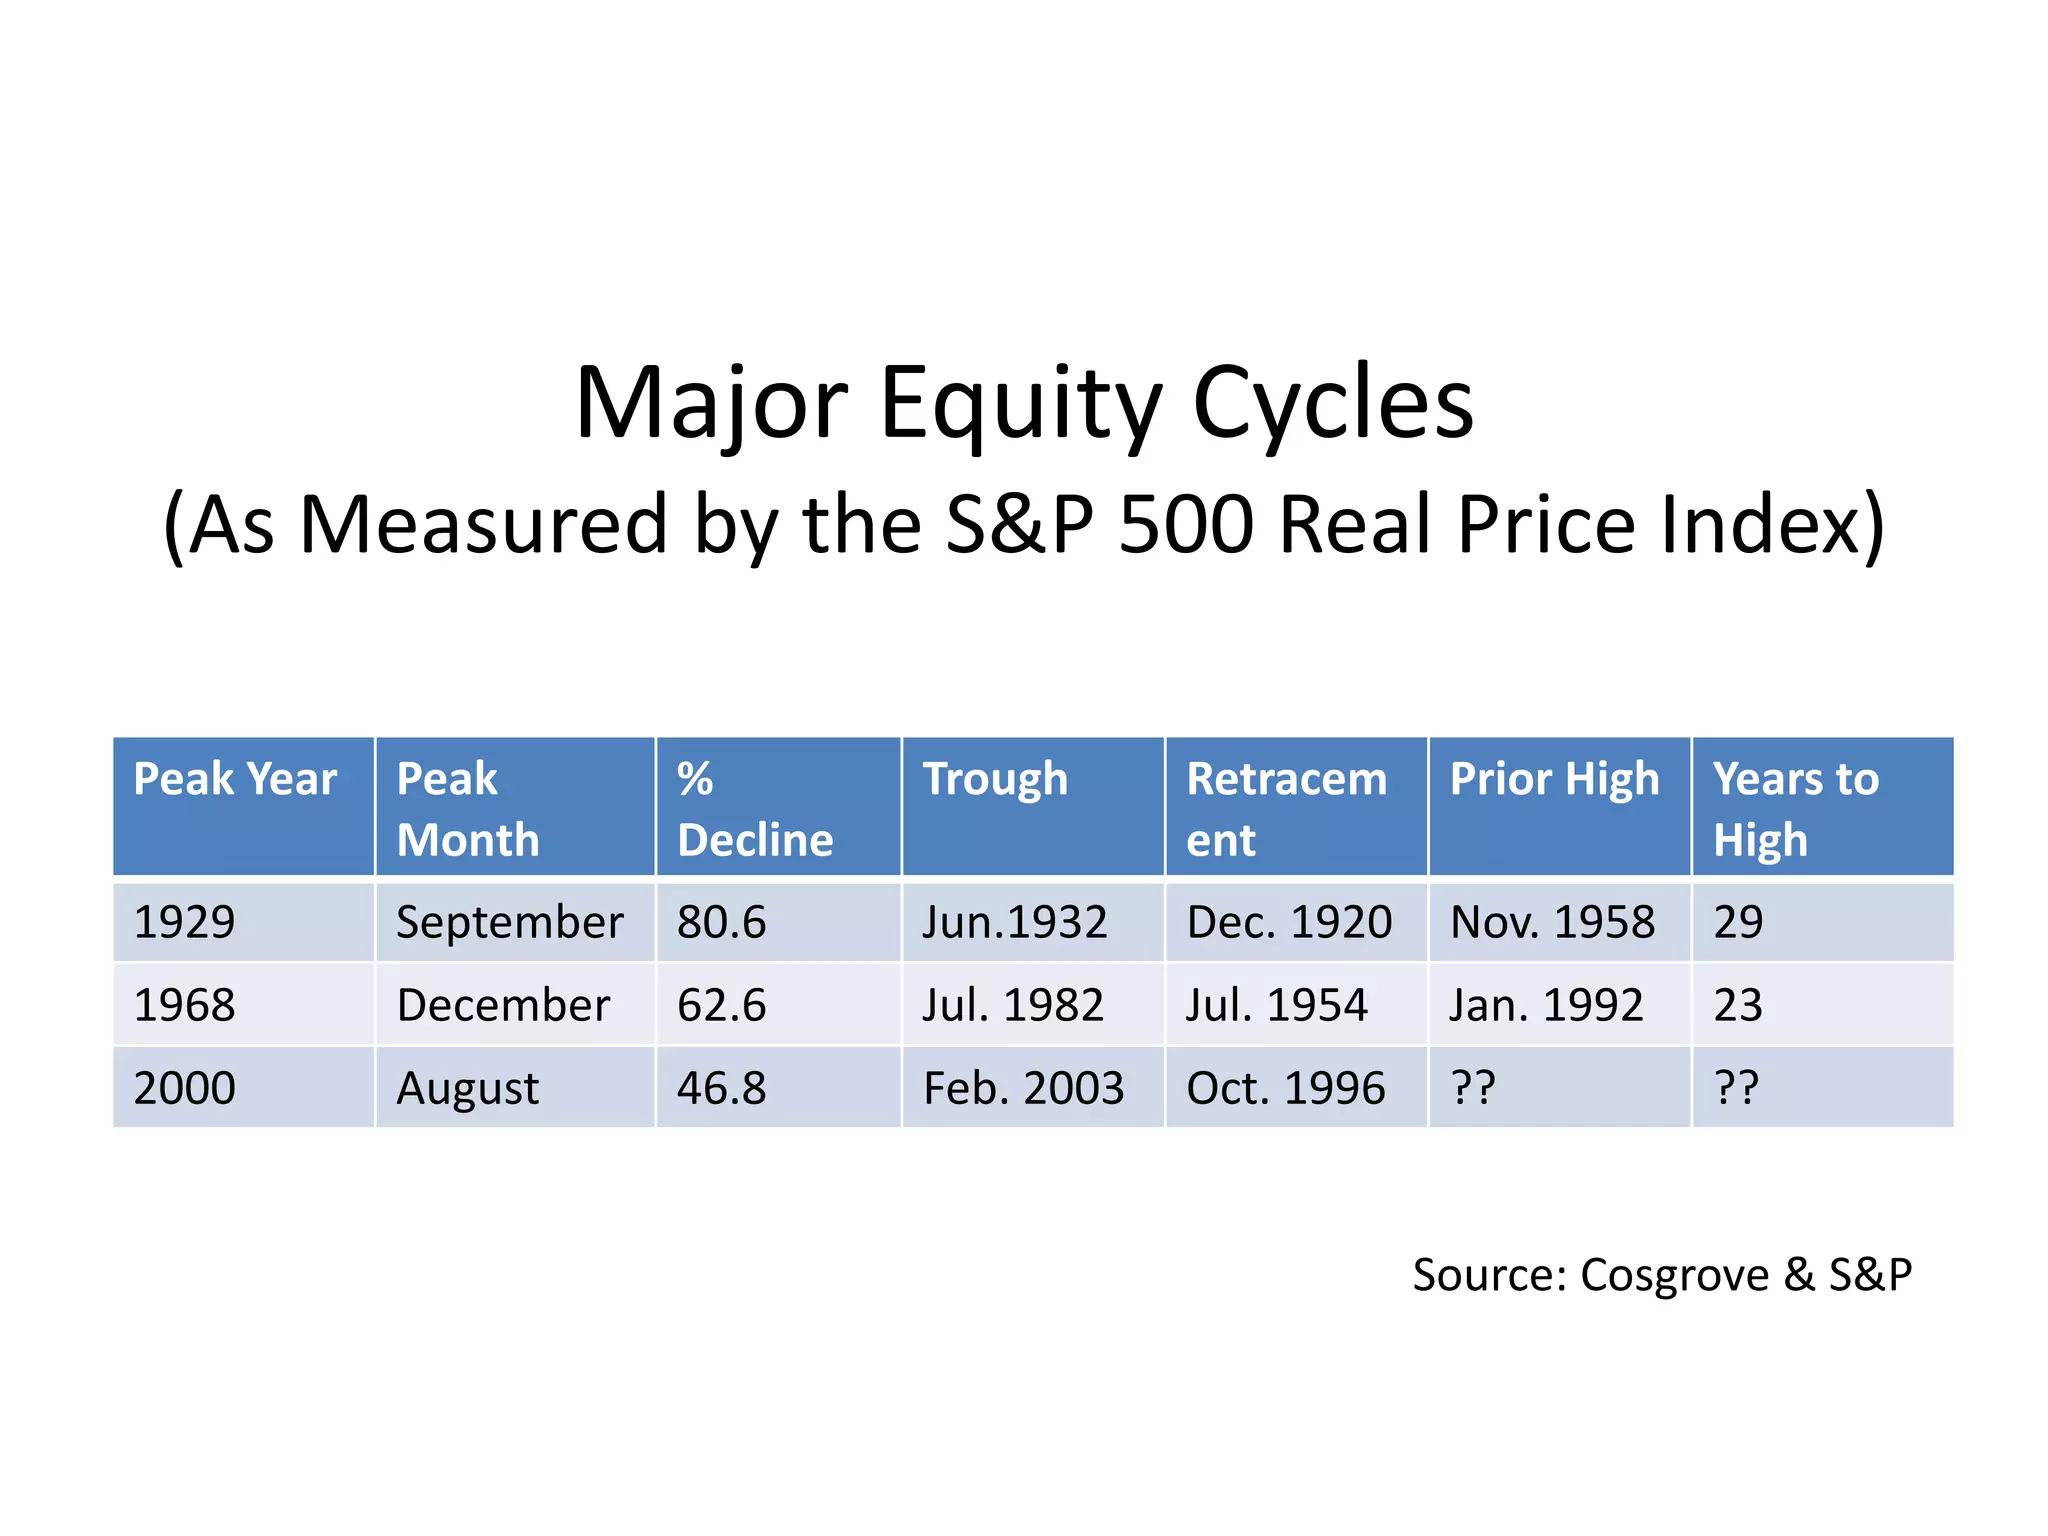
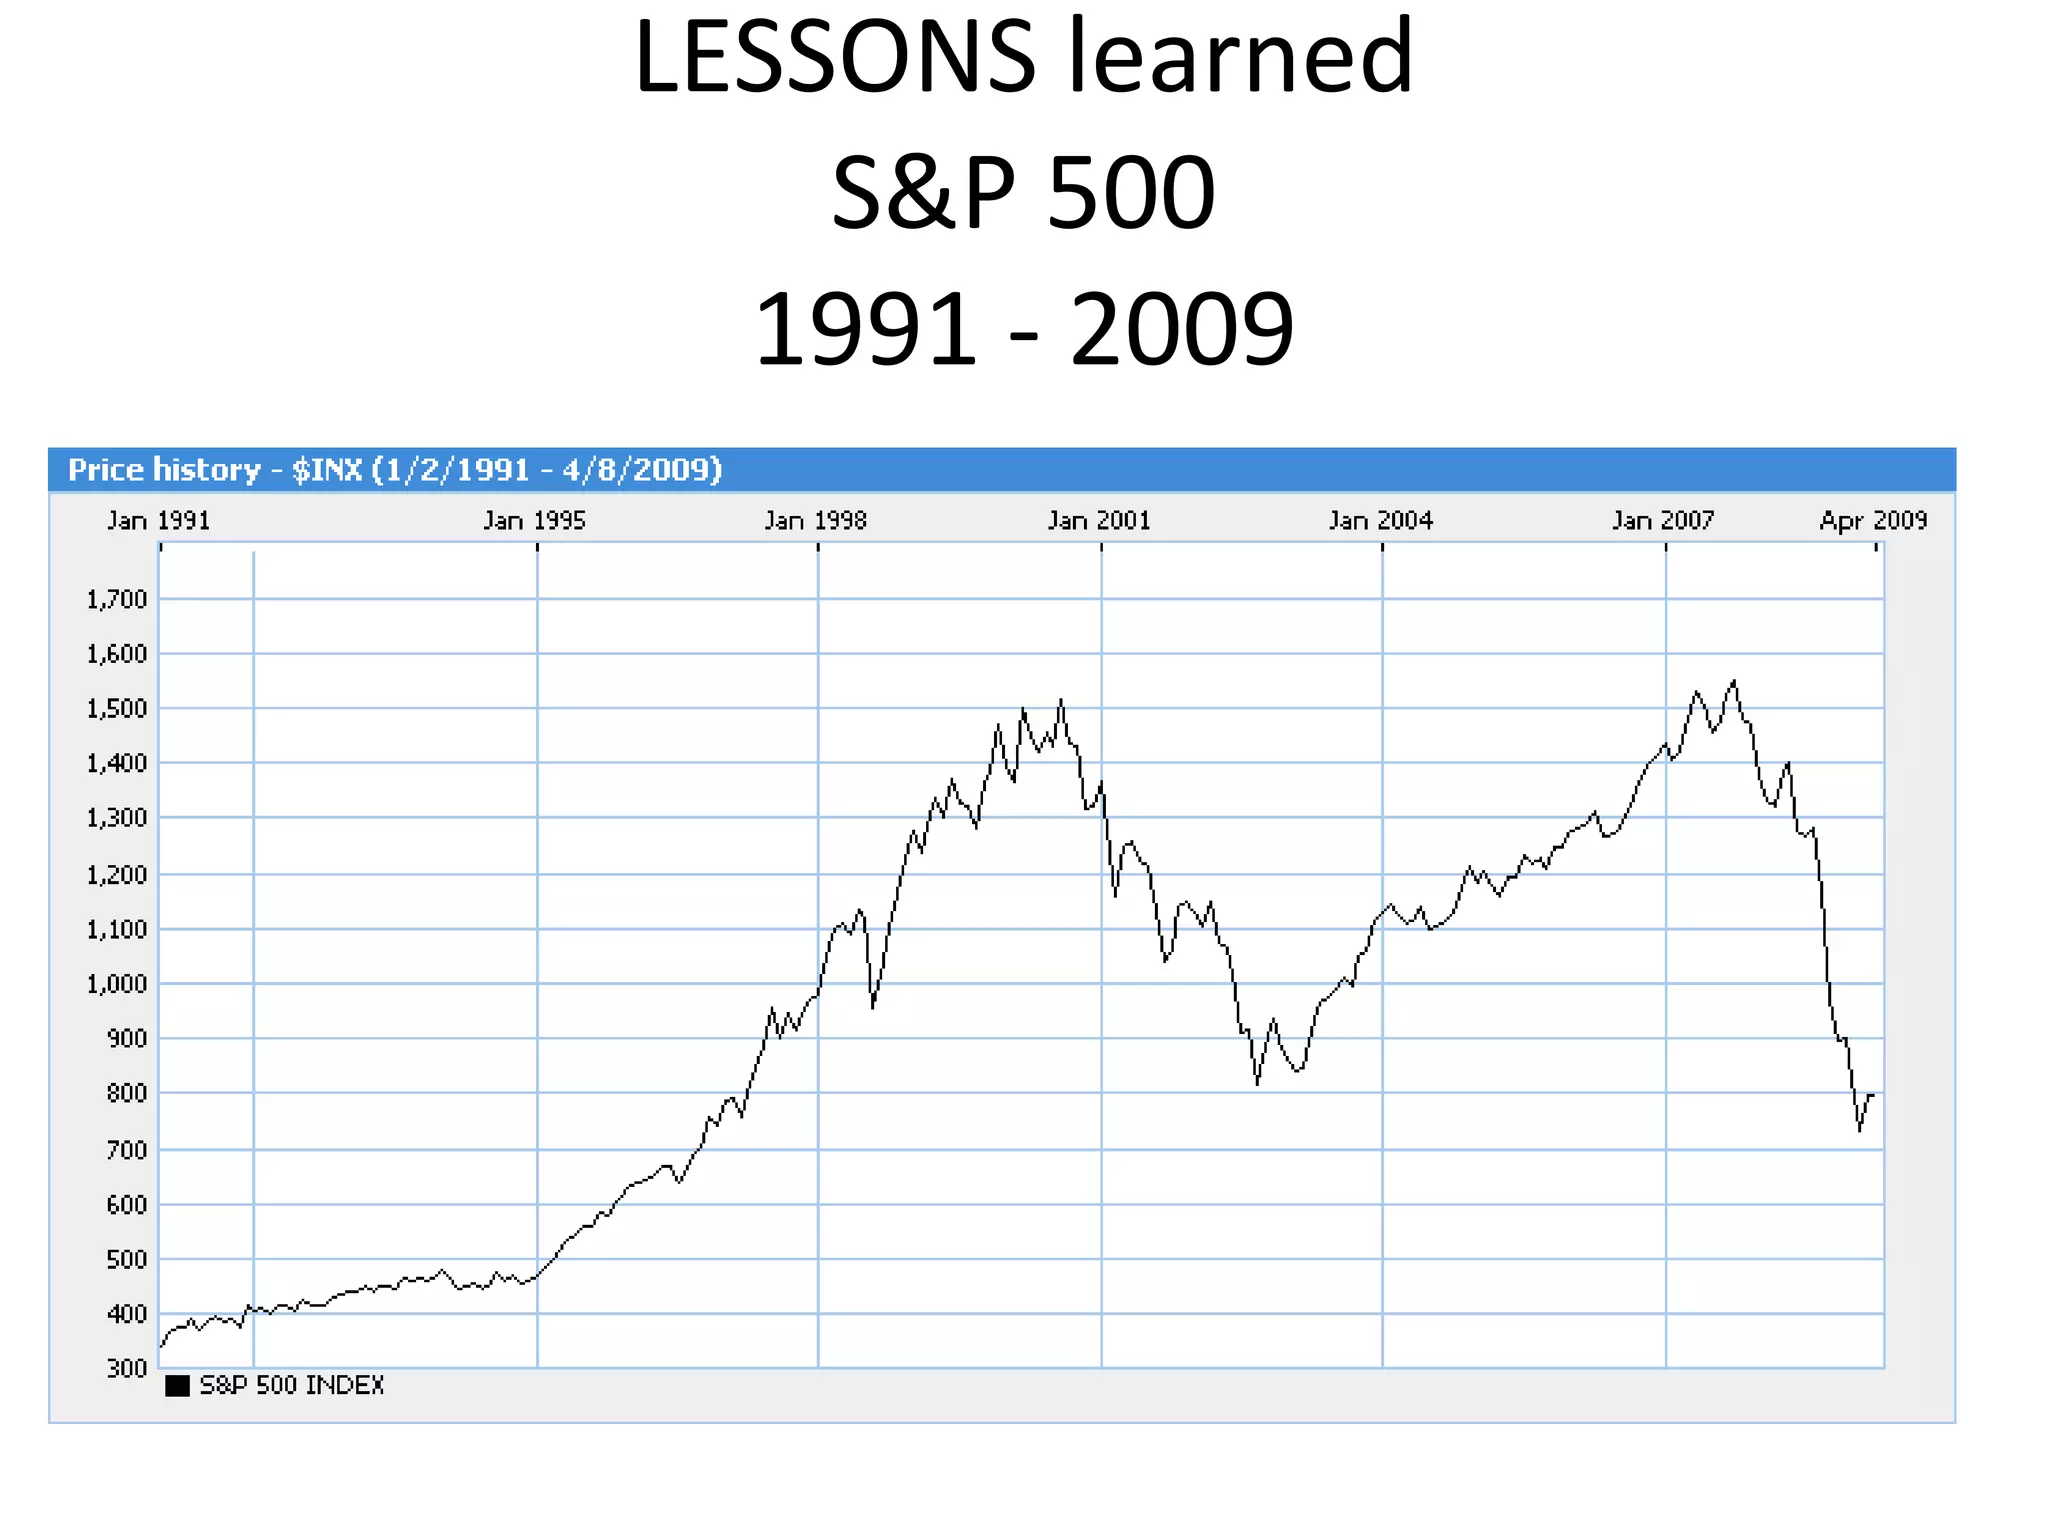
The document discusses market bubbles and provides several case studies as examples. It defines a market bubble as occurring when prices reach unjustified levels and end up crashing. Several causes of bubbles are mentioned, including excessive leverage, the "greater fool theory," and lack of experience among fund managers. When bubbles burst, they can lead to economic slowdowns as disallocation of resources and spending cuts occur. The case studies examine the market crashes of 1929, the 1960s bubble, the 1987 meltdown, and the late 1990s dot-com bubble. Lessons learned are that the size of declines from bubble peaks has diminished over time, and it can take decades to regain prior market highs after a crash.
Watch out full video on Youtube. Click on the link below-
https://youtu.be/48r3LhGRX_A
Credit monitoring is the continuous process of reviewing and following loan accounts, asset quality and credit reports to judge the accuracy and standard of loan asset.
Whenever loan is granted to customer, banker is required to ensure that it remains a standard asset and does not turn out to be non-performing asset.
Pre-disbursement Care
Sanction letter shall be issued detailing various terms and conditions on which the loan has been approved.
Acknowledgement letter should be obtained from borrower stating that he/she has well understood and noted the terms of sanction.
Security documents along with acknowledgement letter should be kept aside properly.
Credit report should be reviewed periodically to ensure that there are no adversity causing risk to loan recovery.
Documentation should be done in proper format with all signatures as a part of due diligence.
End use verification to ensure legality of purpose.
Post-disbursement Care
Post-disbursement monitoring involves both onsite monitoring (visiting the unit) and offsite monitoring (scrutiny of records)
OFFSITE MONITORING INVOLVES :-
Study of Quarterly Information System, Monthly Select Operational Data, Cash Budget and Financial Statements
Stock Statement Verification
Scrutiny of the register and bills
Annual report containing director’s report, management discussion analysis, auditor’s report and financial statements
Comparison of actual financials with projected one on the basis of which loan was sanctioned
ONSITE MONITORING INVOLVES :-
Physical verification of stock
Check whether all machinery are working in good condition
Checking of Register Books ( Sales register, Purchase register, Production register, Stock register)
Invoices and utility bills
No. of skilled and unskilled workers in the unit
Thank you for Watching
Subscribe to DevTech Finance
Economic activity relies on group agreement relative to the value of assets and their prices. When prices rise, people tend to get excited and buy more, bidding prices higher. This is called speculation or irrational exuberance. Values can only defy gravity for so long and when folks begin to realize assets may be over-priced, panic selling brings it all crashing down. Pop.
The crash which usually follows an economic bubble can destroy a large amount of wealth and cause continuing economic malaise.
Here are some of the more infamous bubble bursting events and “adjustments” that have occurred since the industrial revolution and our thinking about economics began.
Introduction to Banking, Evolution of Banking, History of Banking system, Route map from traditional banking to Modern banking, Modern Banking system and its evolution, Growth of Indian Banking System
The Reserve Bank of India performs its supervision functions under the guidance of the Board for Financial Supervision (BFS). Board of Financial Supervision(BFS), is the supporting department of RBI. It's support to RBI for regulating the monetary policy as well as controlling the Banking, Non-banking institutions.Primary objective of BFS is to undertake consolidated supervision of the financial sector comprising commercial banks, financial institutions and non-banking finance companies.
Forward market, arbitrage, hedging and speculationMohit Singhal
Covers various aspects related to forward market, forward rate, long and short forward position, arbitrage, hedging and speculation along with various illustrative examples.
Whether you are considering a traditional church wedding, fairytale castle or overseas wedding in an elegant villa, ArtisanPro are passionate about orchestrating your perfect wedding from start to finish exceeding your expectations.
The Great Depression - Presentation (Macroeconomics Perspective)Arjun Parekh
This brief presentation on 'The Great Depression' has been made from the point of view of understanding Macroeconomic factors that played an important role.
Reunión Científica: Financial crises in a historical and comparative perspective. Spain and the international economy
Conferencia: La Gran Recesión en perspectiva histórica
Peter Temin
Massachusetts Institute of Technology (MIT). EE.UU.
Madrid, 23 de febrero de 2012
Many investors are scared, afraid, or anxious over the stock market. This presentation will provide calm, confidence, and resolve back into your investment philosophy. Markets come back, make sure you have the knowledge to take advantage of the greatest wealth boosting period in our time.
2. Market Bubble
• An economic bubble (sometimes referred to
as a speculative bubble, a market bubble, a
price bubble, a financial bubble, or a
speculative mania) is “trade in high volumes
at prices that are considerably at variance
with intrinsic values”.
• A bubble is basically said when prices reach
unjustified levels and end up crashing
3. Bubble causes
• The causes of the bubbles are widely disputed
• Markets do not act perfectly according to the
efficient market theory
• Excessive leverage
• Greater Fool Theory (there is alway a bigger
fool)
• Lack of experience & excessive enthusiasm of
young fund managers
4. Bubble results
• Lead to disallocation of resources
• Crash following the bubble causes losses and
possibly long-term economic slowdown
• Lead to excessive spending cuts to make-up
for the losses and thus hinder economic
growth
• Markets become risk-aversive and players shift
back towards fundamentals
5. Bubble ‘life-cycle’
• response to a spate of good news
• positive market sentiment results in rapid
appreciation of asset prices
• a correction period follows, in which equity
prices regress to their fundamental values
• Market sentiment may become very negative
which could lead to unjustified asset
depreciation
8. Before the great crash
• U.S. economy grew rapidly during the 1920s
– tax rates fell from a top rate of 73 percent in 1921 to 24
percent in 1929
– Technological advances were instrumental in generating
positive market sentiment
– investors place a high value on equities during the latter
part of the 1920s
• FED’s tightening of monetary policy starting in the
spring of 1928 and continuing until the October 1929
crash
– Critisised as ‘unnecessary’ (Friedman, Schwarz)
– the market took a long time, at least most of 1929, to
discount that information into stock prices
9. Direct crash triggers
• Tariff increases
– tariffs were expected to have a very detrimental effect on
the economy and corporate profits
– During the week of October 21, 1929 the tariff bill written
by Senator Smoot was being discussed on the Senate floor,
Cosgrove (1996)
– On October 24, Black Thursday, the equity market
declined sharply, likely reflecting the tariff issue
• October 29 was a day of devastation as the increasing
likelihood of tariffs finally caused investors to sharply
reduce the market value of equities
• Other countries responded by implementing tariffs
which plunged the global economy into depression.
10.
11. The ‘aftershock’
• in September and October 1931 the FED made
another policy mistake (according to Friedman
and Schwartz) by increasing interest rates to
support the dollar.
• That central bank decision again helped send
equity prices lower.
12. The great crash & the efficient market
theory
This adverse information, which had started
accumulating in 1928, was not fully
discounted into stock prices until the
middle of 1932, fully two years after the last
of the policy moves was taken. This length
of time seems to be excessive and
somewhat negates the usefulness of the
efficient market hypothesis.
In real terms the S&P 500 price index didn’t regain its prior high
until November 1958 – 29 years later. It declined 80% from Sep
1929 to Jun 1932 – returning to its’ 1920 levels.
14. Reasons for the 60’s equity rises
• President Kennedy began promoting tax rate
reductions in mid-1962
• The Committee for Economic Development
generated additional support for Kennedy’s
rate reductions with publication of their
report entitled “Reducing Tax Rates for
Production and Growth” (1962).
• Kennedy-Johnson staged tax rate reductions
starting in 1964
15. Reasons for early 70’s equity declines
• December 1969 - recession started
• August 1971 New Economic Policy
– wage-price controls
– jettisoning of the quasi-gold standard
• October 1973 - Arab OPEC oil embargo which
lasted until March 1974
• The Federal Reserve acted to compound the real
side effect by monetizing the oil price increases,
leading to sharply higher rates of expected
inflation
19. Reasons for meltdown
• a correction within the December 1968 to
January 1992 equity cycle
• major tightening of monetary policy
– higher bond yields
– slowdown in growth of the monetary base
• possible merger tax
• concern about a further weakening of the
dollar could
20. How it looked
• revaluation was underway on October 19th
• adverse market sentiment kicked in to accelerate a
correction
• under normal conditions the correction may have
lasted several months or a year
• the efficient market hypothesis did hold as
fundamentals suggested equity valuations could be
lower=> however, overreaction
• It appears the market got ahead of its fundamentals
and fear took over once the correction got underway
• Approximately 1.5 years of equity gains were wiped
out in one day
23. “Even if all market participants
rationally price common stocks as the
present value of all future cash flows
expected, it is still possible for
excesses to develop.”
Malkiel (2003)
24. Reasons for the .com craze
• Fundamentals remained positive other than a mild
2001 recession
• People became fascinated by internet & belived in its’
unlimited possibilities
• large excesses in valuing equities did develop in the
late 1990s - mispricing
• fund managers in the late 1990s placed excessive bets
on technology stocks and these younger managers
exhibited trend-chasing characteristics
– crashes are less likely to occur when participants had prior
experience with chaotic market conditions - Suchanek and
Williams (1988)
25. .com craze outcome
There have been major geopolitical issues such as
terrorism, wars, and a higher price of energy, but
global economic fundamentals such as low
inflation rates, low bond yields, and the trend
toward open markets has continued. When
economic fundamentals remain positive it
appears that, as expected, the equity market has
a smaller sell-off from the bubble peak than
when fundamentals turn negative.
28. Peak Year Peak
Month
%
Decline
Trough Retracem
ent
Prior High Years to
High
1929 September 80.6 Jun.1932 Dec. 1920 Nov. 1958 29
1968 December 62.6 Jul. 1982 Jul. 1954 Jan. 1992 23
2000 August 46.8 Feb. 2003 Oct. 1996 ?? ??
Major Equity Cycles
(As Measured by the S&P 500 Real Price Index)
Source: Cosgrove & S&P
29. LESSONS LEARNED
• The percentage peak-to-trough decline has been
diminishing since the Great Crash
• It took 29 years to breach the September 1929 peak,
and 23 years to breach the December 1968 peak
• The two earlier cycles encountered sizable corrections
before reaching the prior high
• It may only take one decade or less or to regain the
August 2000 peak (belived by ca. 2005)
• The same length in regaining profits may yet occur with
the current cycle – a sharp correction due to some
unforeseen event which might stretch out the time it
takes to regain the prior high