
Recommended
More Related Content
What's hot
What's hot (20)
Similar to Monthly viewpoint from cio may 2017
Similar to Monthly viewpoint from cio may 2017 (20)
Recently uploaded
Recently uploaded (20)
Monthly viewpoint from cio may 2017
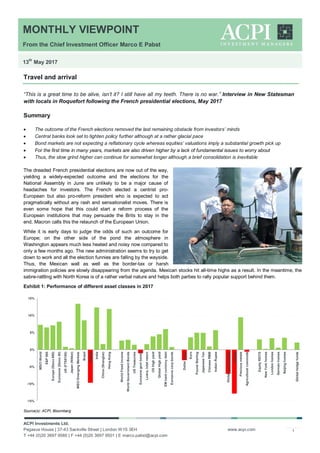
- 1. MONTHLY VIEWPOINT From the Chief Investment Officer Marco E Pabst 13 th May 2017 ACPI Investments Ltd. Pegasus House | 37-43 Sackville Street | London W1S 3EH T +44 (0)20 3697 9580 | F +44 (0)20 3697 9501 | E marco.pabst@acpi.com www.acpi.com 1 Travel and arrival “This is a great time to be alive, isn’t it? I still have all my teeth. There is no war.” Interview in New Statesman with locals in Roquefort following the French presidential elections, May 2017 Summary The outcome of the French elections removed the last remaining obstacle from investors’ minds Central banks look set to tighten policy further although at a rather glacial pace Bond markets are not expecting a reflationary cycle whereas equities’ valuations imply a substantial growth pick up For the first time in many years, markets are also driven higher by a lack of fundamental issues to worry about Thus, the slow grind higher can continue for somewhat longer although a brief consolidation is inevitable The dreaded French presidential elections are now out of the way, yielding a widely-expected outcome and the elections for the National Assembly in June are unlikely to be a major cause of headaches for investors. The French elected a centrist pro- European but also pro-reform president who is expected to act pragmatically without any rash and sensationalist moves. There is even some hope that this could start a reform process of the European institutions that may persuade the Brits to stay in the end. Macron calls this the relaunch of the European Union. While it is early days to judge the odds of such an outcome for Europe; on the other side of the pond the atmosphere in Washington appears much less heated and noisy now compared to only a few months ago. The new administration seems to try to get down to work and all the election funnies are falling by the wayside. Thus, the Mexican wall as well as the border-tax or harsh immigration policies are slowly disappearing from the agenda. Mexican stocks hit all-time highs as a result. In the meantime, the sabre-rattling with North Korea is of a rather verbal nature and helps both parties to rally popular support behind them. Exhibit 1: Performance of different asset classes in 2017 Source(s): ACPI, Bloomberg -15% -10% -5% 0% 5% 10% 15% MSCIWorld S&P500 Europe(Stoxx600) Eurozone(Stoxx50) UK(FTSE100) Japan(Nikkei) MSCIEmergingMarkets Brasil Russia India China(Shanghai) HongKong WorldFixedIncome WorldGovernmentBonds USTreasuries Eurozonegovtbonds Loans,totalreturn USHighyield GlobalHighyield EMhardcurrencydebt Eurozonecorpbonds Dollarindex Euro PoundSterling JapaneseYen ChineseRMB IndianRupee Globalcommodities Energy Preciousmetals Agriculturalcommods EquityREITS NewYorkhomes Londonhomes Germanhomes Beijinghomes Globalhedgefunds
- 2. MONTHLY VIEWPOINT From the Chief Investment Officer Marco E Pabst 13 th May 2017 ACPI Investments Ltd. Pegasus House | 37-43 Sackville Street | London W1S 3EH T +44 (0)20 3697 9580 | F +44 (0)20 3697 9501 | E marco.pabst@acpi.com www.acpi.com 2 Sure, some of the actions such as the dismissal of FBI director Comey reiterate some fundamental concerns about Trump but from a market point of view, the successful implementation of a tax reform package is still the most significant point on the agenda. This as well as the seemingly receding global risk, or should we rather say receding purported risks, are the reason why equity markets showed such strong resilience recently. There is clearly also the point of the US Q1 earnings season that is doing well as most companies have now reported their figures, posting earnings growth of more than 15%, the fastest quarterly pace in five years. Two thirds of issuers have beaten forecasts and top line growth came in at almost 9% yoy. Technology, basic materials and financials are driving earnings growth at 24%, 17% and 16%, respectively. Quarterly S&P500 EPS reached just under USD31 as a result. Management guidance was also broadly better compared to previous quarters and the strongest such forecast in almost three years. Earnings growth in Europe was even stronger at 28% with sales growing at almost 8% for the Eurostoxx 50 in Q1. Oil&gas was the standout sector with 167% year-on-year growth in earnings and 30% is sales, thanks to recovering energy prices. As usual, markets move on expectations and earnings forecasts are almost always pointing upwards. Today is no exception. Exhibit 2: Past and expected earnings and valuation of major markets Source(s): ACPI On the basis of trailing earnings, almost all markets are overvalued by any historic standard and one can only argue about the extent of overvaluation depending on the chosen measure. The major developed markets are trading around 20x trailing earnings and this does not even take into account the ‘cleanliness’ of earnings in the sense that properly-measured US GAAP earnings are lower than most reported profits and, thus, multiples would be higher than those stated above. However, it is also not advisable to fight the tape at this point and we have to respect price action, at least in the short to medium term. One has to be mindful of the fact, however, that in order for markets to reach their full-year expectations, earnings growth has to accelerate more from current levels. For the US it has to reach almost 20% and nearly 30% for Europe and the MSCI World. This would put market multiples between 15x (for Europe) and 18x (for the US) on this year’s basis and is somewhat more adequate. For markets to reach acceptable valuation levels, earnings would have to grow by another 10% next year, as per market expectations. This obviously does not take into account that markets should consider the changing outlook for inflation and rates as well as the fact that the cycle would by then be almost ten years old. Economic cycles do not die of old age but the current one is already long by any historic comparison and we believe that valuations need to reflect that. There is a reason why carmakers typically trade at the lowest valuation multiples when they reach their peak-cycle earnings. Returning to Europe, sentiment has been improving strongly since the end of last year and stock prices are reflecting that. Not surprisingly, as inflows always follow performance (and never the other way around!), flows into European equities reached 2013 2014 2015 2016 2017E 1) 2018E EPS growth MSCI World EPS 85.99 95.67 82.83 84.43 109.42 121 Growth 2.0% 11.3% -13.4% 1.9% 29.6% 10.6% P/E 19.3 17.9 20.1 20.7 17.2 15.5 S&P500 EPS 105.98 112.35 108.45 108.59 129.72 145.28 Growth 6.8% 6.0% -3.5% 0.1% 19.5% 12.0% P/E 17.4 18.3 18.8 20.6 18.4 16.4 Eurostoxx50 EPS 141.28 166.01 163.23 172.96 235.42 258.57 Growth -13.3% 17.5% -1.7% 6.0% 36.1% 9.8% P/E 22.0 19.0 20.0 19.0 15.1 13.8 1) As of the end of April 2017
- 3. MONTHLY VIEWPOINT From the Chief Investment Officer Marco E Pabst 13 th May 2017 ACPI Investments Ltd. Pegasus House | 37-43 Sackville Street | London W1S 3EH T +44 (0)20 3697 9580 | F +44 (0)20 3697 9501 | E marco.pabst@acpi.com www.acpi.com 3 multi-year highs in early May. According to BofAML, around three quarters of these inflows went into ETFs rather than mutual funds. Exhibit 3: Weekly equity fund flows (USDm) Source(s): BofAML Interestingly, the record pace of flows into European assets did not stop at equities. Investment-grade bond funds also saw considerable new investor money. This is quite astonishing considering that the ECB is the next big central bank that will, in all likelihood, start tapering monetary easing very soon. Just a few days ago, German magazine Der Spiegel reported that the ECB will start preparing financial markets from July for an exit from QE. This would include the reduction of monthly asset purchases in steps of EUR10bn or EUR20bn from the beginning of 2018. In addition, from the end of 2018, the ECB would consider to increase interest rates, if warranted. This is still a long way out and we may be either approaching a recession or be already in one by that moment of time. Nevertheless, we see little reason to be bullish about European government bonds or high-grade corporate paper at present and, hence, continue to have almost no exposure. Exhibit 4: 5-year/5-year forward market expectation for inflation in the US and the Eurozone Source(s): ACPI, Bloomberg
- 4. MONTHLY VIEWPOINT From the Chief Investment Officer Marco E Pabst 13 th May 2017 ACPI Investments Ltd. Pegasus House | 37-43 Sackville Street | London W1S 3EH T +44 (0)20 3697 9580 | F +44 (0)20 3697 9501 | E marco.pabst@acpi.com www.acpi.com 4 The positive earnings picture and stable European outlook were somewhat offset by concerns about the reflationary cycle. Commodities were the only asset class, with the exception of the dollar index, that lost money this year. The Rogers commodity index lost more than 7% whereby oil is down more than 8% as of the end of April. Iron ore, which rallied sharply after the US elections, lost almost a third peak-to-trough this year. Stocks of commodity conglomerates have been faring better, primarily because profitability is still improving after the implementation of restructuring measures following the severe slump in 2015. The decline in energy prices is one of the key reasons why the market’s forward inflation expectations have been declining since the end of last year. This measure fell by 30bps to 1.97% over the past three months in the US and is now close to pre-election levels. Declining credit growth as a result of the Chinese government’s pressure on shadow banking and the basis effect of the past stimulus package in addition to a declining credit impulse in the US (low commercial loan growth) and Europe lead us to believe that the cyclical outlook is somewhat subdued. However, from a market standpoint this is almost a goldilocks scenario as growth is unlikely to overshoot but, more importantly, as highlighted here many times before, inflation is firmly under control. For instance, Chinese PPI declined by 0.4% month-on-month in April, the first such decline since the summer of last year. The annual figure at 6.4% is still high but likely to contract further going forward, putting pressure on inflation further down the pipe. As for the US, core PCE inflation slowed to 1.6% yoy in March, a 0.1% month-on-month decline and the first such fall since 2009. This means that the Fed is unlikely to tighten monetary conditions aggressively and we, therefore, do not see more than two further rate increases this year. It should be remembered that tightening can also be achieved by not re-investing coupon and principal proceeds from the Fed’s current balance sheet, so it is feasible that we may see only one more step up in rates but some measures leading to a reduction in the Fed’s balance sheet over time. The major question mark is around wage inflation which was supposed to kick in by now and could become a more meaningful driver of CPI inflation in the future. Despite a somewhat muted macro picture, unemployment in the US continues to fall. The unemployment rate is now firmly below the natural rate of unemployment which, historically, has led to wage inflation. Exhibit 5: US unemployment rate and natural rate of unemployment (red line, lhs) and continuing claims/total population and employment cost index ECI (rhs) Source(s): WSJ, ACPI, Bloomberg To some extent, this process is already underway as can be seen in the employment cost index ECI, Yellen’s favourite indicator of wage pressure, which has been steadily grinding higher over the past years. Despite this increase in nominal wages, real wage growth is still slow, in fact zero at the moment. Clearly, record low unemployment is without a doubt a good thing and cannot only be seen through the lens of inflationary risks. It should be noted again at this stage, that the largest component in the US CPI basket is shelter cost, which is not directly related to wages. In addition to the de-leveraging of household balance sheets that took place in the past, another
- 5. MONTHLY VIEWPOINT From the Chief Investment Officer Marco E Pabst 13 th May 2017 ACPI Investments Ltd. Pegasus House | 37-43 Sackville Street | London W1S 3EH T +44 (0)20 3697 9580 | F +44 (0)20 3697 9501 | E marco.pabst@acpi.com www.acpi.com 5 major benefit is the declining cost of unemployment benefits that have to be paid out. Thus, today, less than eight out of one thousand people in the US receive such benefits, down from almost 30 out of 1,000 in 2009. This is the lowest level in almost 50 years. Exhibit 6: Inflation and GDP growth in the US and the Eurozone, quarterly year-on-year Source(s): ACPI Whilst there seems little to fear from the Fed at this point, the fine balance markets are walking at the moment is defined by weak hard economic data and soft hopes for a tax reform to pass. On the former, US Q1 GDP rose by only 0.7% qoq (versus an expectation of 1%) or 1.9% yoy, compared with 2.1% qoq at the end of 2016. The main culprits were low capex and personal consumption growth as the latter slumped to the slowest expansion since 1999 (+0.3%). Auto sales declined by 4.7% yoy and appear to have entered a weaker period going forward. Following the massive surge in car sales post 2009 and related easy financing, this area is unlikely to serve as a growth booster in the medium term. Growth in Europe was not lagging much behind at 1.7% yoy in Q1, which is in-line with average annual growth for last year. Consumer prices are also beginning to pick up, rising 1.9% in April, compared to 2.2% in the US. Cyclical data are clearly improving in the Eurozone, evidenced by retail sales rising by 3.7% in February. Hence, the wide gap in monetary policies between the US and the Eurozone appears unjustified based on underlying fundamentals. The expected ECB tapering and improving fundamentals in Europe should also be very supportive for the Euro that appears to be trying to break out of its two- year trading range. If this were indeed to happen, the next target would be around 1.12 to the dollar, followed by 1.15 as an intermediate target. Over the next 12-24 months even an approach towards 1.20 is feasible from a technical and fundamental point of view. Obviously, as always with currencies, this is a relative view and implies an environment for the dollar that essentially stays the same. Despite resurgent growth across developed economies, the bond market does not seem to buy into the story. Thus, the US 10-year government bond yield is still at the levels where it was at the end of November of last year. The picture in Europe is quite similar. This reflects the ongoing scepticism of markets about Trump’s ability to execute on his agenda and also deal with the liberal and conservative factions within the Republican Party. The market’s view appears to be that conservatives will prevail with their view of a revenue-neutral tax reform, which will be difficult to achieve as opposed to the liberal’s position that assumes that tax cuts will pay for themselves via higher growth and consumption. -6.0% -5.0% -4.0% -3.0% -2.0% -1.0% 0.0% 1.0% 2.0% 3.0% 4.0% Q209 Q309 Q409 Q110 Q210 Q310 Q410 Q111 Q211 Q311 Q411 Q112 Q212 Q312 Q412 Q113 Q213 Q313 Q413 Q114 Q214 Q314 Q314 Q115 Q215 Q315 Q415 Q116 Q216 Q316 Q416 Q117 Quarterly GDP growth, yoy US GDP Eurozone GDP -2.0% -1.0% 0.0% 1.0% 2.0% 3.0% 4.0% 5.0% Q209 Q309 Q409 Q110 Q210 Q310 Q410 Q111 Q211 Q311 Q411 Q112 Q212 Q312 Q412 Q113 Q213 Q313 Q413 Q114 Q214 Q314 Q314 Q115 Q215 Q315 Q415 Q116 Q216 Q316 Q416 Q117 Quarterly inflation, yoy US CPI Eurozone CPI
- 6. MONTHLY VIEWPOINT From the Chief Investment Officer Marco E Pabst 13 th May 2017 ACPI Investments Ltd. Pegasus House | 37-43 Sackville Street | London W1S 3EH T +44 (0)20 3697 9580 | F +44 (0)20 3697 9501 | E marco.pabst@acpi.com www.acpi.com 6 Should Trump achieve a compromise, the proposed 15% tax rate and ending taxation of profits earned offshore will be substantial enough for markets to hold their current levels as valuations discussed above would cheapen via the permanently lower tax rate and one-off jump in earnings. Whilst this earnings adjustment itself is not fully priced in, it explains why investors tolerate a higher market multiple for the time being, although this does not explain why European stocks are trading at such high levels where no reform is in the pipeline. Exhibit 7: US and German 10-year yields Source(s): ACPI, Bloomberg April was another strong month for world equities that were up for the sixth month in a row, a textbook example of the strong Nov-Apr seasonality historically observed in markets. Overall, the MSCI World index gained 1.3% and is up 7.3% for the year. The Eurozone continues to outperform the US. Thus, the Eurostoxx 50 index is up 8.2% for the year (1.7% in April) whilst the S&P500 gained 0.9% last month for a year-to-date advance of 6.5%. However, both regions were outperformed by emerging markets this year, which recovered from their US-election induced retracement. The MSCI EM equity index gained 2% in April and is up 13.4% for the year, approximately one third of which is attributable to a weaker dollar versus EM currencies. Against this bullish backdrop we have kept our fixed income allocations largely intact supported by our view that a substantial inflationary and, hence, rate surge is quite unlikely. The carry generated from our credit portfolio is substantial and the hedging value is attractive considering elevated levels in global equity markets. Over the next months we would not be surprised to see some slowing in markets, largely for seasonal reasons although the underlying trend is still a slow grind higher in the medium term. Whilst only rather anecdotal in nature, the chart of Sotheby’s is always quite instructive to see where we stand in the formation of market bubbles and the related funny money swirling around global art and other auctions. The stock is approaching its all- time high for the fourth time, trying to break out and, from a technical standpoint; chances are very high that it will succeed this time.
- 7. MONTHLY VIEWPOINT From the Chief Investment Officer Marco E Pabst 13 th May 2017 ACPI Investments Ltd. Pegasus House | 37-43 Sackville Street | London W1S 3EH T +44 (0)20 3697 9580 | F +44 (0)20 3697 9501 | E marco.pabst@acpi.com www.acpi.com 7 Exhibit 8: Sotheby’s since 1988 and Deutsche Bank credit default swaps Source(s): ACPI, Bloomberg This potentially bullish picture also applies to two other typical high-beta markets: Europe and Japan. Both are approaching the ceilings of their 20-year trading ranges and look set to break out on the upside in the medium term. Due to the rapid recent approach, however, we would expect some form of consolidation in the short term that could then set the stage for the breakout higher. Exhibit 9: European Stoxx600 and Japanese Nikkei 225 indices since 1990 Source(s): ACPI, Bloomberg The steady rise of equity markets over the past months has led to volatility falling to record-low levels. It also feels as if complacency is beginning to creep in following the six-month stretch of rising markets. Investors seem to be running out of things to worry about. There appears to be no fundamental issue substantial enough to derail the system at this point. Neither the China, global debt, the European or the banking sector issues appear to be at a point where they could cause serious concerns for markets. It almost appears as if we might be in the midst of a rather normal economic cycle again that may not end with another cataclysmic crash but a fairly normal 18-month or so slowdown. Although this does not make hedging cheap due to the steepness of the volatility curve, it is certainly cheaper to hedge now than in most periods in the past. We will therefore use this opportunity to extent our hedging levels where appropriate.
- 8. MONTHLY VIEWPOINT From the Chief Investment Officer Marco E Pabst 13 th May 2017 ACPI Investments Ltd. Pegasus House | 37-43 Sackville Street | London W1S 3EH T +44 (0)20 3697 9580 | F +44 (0)20 3697 9501 | E marco.pabst@acpi.com www.acpi.com 8 Global economic monitor Source(s): ACPI, Bloomberg Nov Dec Jan Feb Mar Apr Trend Citi Economic Surprise US 17.8 23.3 31.8 34.7 48.0 -4.8 Citi Economic Surprise G10 31.4 33.0 36.9 41.9 41.8 26.1 Citi Economic Surprise Europe 56.9 53.1 55.3 71.1 54.1 70.4 Citi Economic Surprise EM -4.4 18.1 37.1 46.6 34.4 39.5 Citi Economic Surprise UK 46.3 49.6 69.8 92.3 60.8 0.4 ISM manufacturing 53.5 54.5 56.0 57.7 57.2 54.8 ISM new orders 56.1 60.5 59.5 63.15 61.7 60.4 Global manufacturing PMI 53.2 53.6 53.9 53.4 53.7 53.7 China manufacturing PMI 51.7 51.4 51.3 51.6 51.8 51.2 Japan manufacturing PMI 51.3 52.4 52.7 53.3 52.4 52.7 US durable goods orders -4.7 -0.9 2.4 2.4 0.9 US initial jobless claims 262 241 250 227 235 238 US Industrial production -0.2 0.8 -0.3 0.1 0.6 Euro Industrial production 1.5 -1.1 0.3 -0.3 Japan Industrial production 1.0 0.7 -2.1 3.2 -2.1 US retail sales 0.1 0.9 0.5 -0.2 -0.2 Euro retail sales -0.1 -0.3 0.1 0.5 0.3 Japan retail sales 1.7 0.7 1.0 0.2 2.1 China retail sales 10.8 10.9 10.9 US consumer confidence 109.4 113.3 111.6 116.1 124.9 120.3 Euro consumer confidence -6.2 -5.1 -4.8 -6.2 -5.0 -3.6 ifo German business expectations 105.4 105.6 103.3 104.2 105.7 105.2 China export trade -1.5 -6.2 7.6 -1.5 16.4 8.0 South Korea export trade 2.5 6.4 11.2 20.2 13.6 24.2 German export trade 4.3 3.4 5.8 6.2 China monthly money supply 11.4 11.3 11.3 11.1 10.6 US personal income 0.2 0.3 0.4 0.3 0.2
- 9. MONTHLY VIEWPOINT From the Chief Investment Officer Marco E Pabst 13 th May 2017 ACPI Investments Ltd. Pegasus House | 37-43 Sackville Street | London W1S 3EH T +44 (0)20 3697 9580 | F +44 (0)20 3697 9501 | E marco.pabst@acpi.com www.acpi.com 9 The Global PMI heatmap Source(s): ACPI, Bloomberg Country/RegionCategory/SectorApr-2017Mar-2017Feb-2017Jan-2017Dec-2016Nov-2016Oct-2016Sep-2016Aug-2016Jul-2016Jun-2016May-2016Apr-2016Mar-2016Feb-2016Jan-2016Dec-2015Nov-2015Oct-2015Sep-2015Aug-2015Jul-2015Jun-2015May-2015Apr-2015 AustriaManufacturing58.156.857.257.356.355.453.953.552.153.454.552.052.052.851.951.250.651.453.052.550.552.451.250.350.1 BrazilComposite50.448.746.644.745.245.344.946.144.446.442.338.339.040.839.045.143.944.542.742.744.840.841.042.944.2 BrazilManufacturing50.149.646.944.045.246.246.346.045.746.043.241.642.646.044.547.445.643.844.147.045.847.246.545.946.0 BrazilServices50.347.746.445.145.144.443.945.342.745.641.437.337.438.636.944.443.545.543.041.744.839.139.942.544.6 CanadaManufacturing55.955.554.753.551.851.551.150.351.151.951.852.152.251.549.449.347.548.648.048.649.450.851.349.849.0 ChinaComposite51.252.152.652.253.552.952.951.451.851.950.350.550.851.349.450.149.450.549.948.048.850.250.651.251.3 ChinaManufacturing50.351.251.751.051.950.951.250.150.050.648.649.249.449.748.048.448.248.648.347.247.347.849.449.248.9 ChinaServices51.552.252.653.153.453.152.452.052.151.752.751.251.852.251.252.450.251.252.050.551.553.851.853.552.9 CzechRepublicManufacturing57.557.557.655.753.852.253.352.050.149.351.853.353.654.355.556.955.654.254.055.556.657.556.955.554.7 DevelopedMarketsManufacturing54.153.954.154.253.752.952.651.551.251.451.250.350.550.950.852.152.052.352.651.751.952.151.752.151.9 DevelopedMarketsServices54.153.953.654.553.854.053.651.751.551.351.551.852.351.751.253.353.954.854.253.955.254.754.454.855.7 DevelopedMarketsComposite54.354.154.054.654.154.053.751.951.751.551.451.451.951.751.253.253.754.654.053.654.654.453.954.455.0 EgyptWholeEconomy47.445.946.743.342.841.842.046.347.048.947.547.646.944.548.148.048.245.047.250.251.249.250.249.949.8 EmergingMarketsComposite52.052.652.151.951.951.451.851.151.351.549.949.549.950.549.050.149.450.249.849.049.850.249.950.851.2 EmergingMarketsManufacturing50.851.651.350.851.050.751.050.350.150.349.249.549.650.248.949.449.049.249.048.548.649.149.949.849.6 EmergingMarketsServices52.252.452.052.151.550.951.151.051.251.550.549.149.950.048.950.849.550.250.549.950.751.249.751.351.8 EuropeanUnionComposite56.756.155.654.654.954.153.652.953.051.852.953.152.853.353.054.054.554.554.253.554.554.554.954.154.9 EuropeanUnionManufacturing56.755.955.455.355.053.553.452.951.951.452.751.451.551.751.452.453.052.852.652.052.352.652.652.352.2 EuropeanUnionServices56.355.755.053.954.454.153.352.352.851.552.753.452.953.353.254.154.554.654.353.654.754.855.454.455.4 EurozoneComposite56.856.456.054.454.453.953.352.652.953.253.153.153.053.153.053.654.354.253.953.654.353.954.253.653.9 EurozoneManufacturing56.756.255.455.254.953.753.552.651.752.052.851.551.751.651.252.353.252.852.352.052.352.452.552.252.0 EurozoneRetail52.749.549.950.150.448.648.649.651.048.948.550.647.949.250.148.949.048.551.351.951.454.250.451.449.5 EurozoneServices56.456.055.553.753.753.852.852.252.852.952.853.353.153.153.353.654.254.254.153.754.454.054.453.854.1 EurozoneConstruction52.553.552.250.752.351.449.449.148.648.346.548.447.549.051.350.349.448.747.848.847.247.146.047.246.2 FranceComposite56.656.855.954.153.151.451.652.751.950.149.650.950.250.049.350.250.151.052.651.950.251.553.352.050.6 FranceManufacturing55.153.352.253.653.551.751.849.748.348.648.348.448.049.650.250.051.450.650.650.648.349.650.749.448.0 FranceRetail51.849.451.753.150.447.347.549.153.051.651.050.648.245.548.148.946.647.851.949.649.552.948.948.746.2 FranceServices56.757.556.454.152.951.651.453.352.350.549.951.650.649.949.250.349.851.052.751.950.652.054.152.851.4 FranceConstruction52.753.251.550.150.650.347.547.845.344.842.343.841.642.744.643.042.244.843.844.242.340.638.440.037.7 GermanyComposite56.757.156.154.855.255.055.152.853.355.354.454.553.654.054.154.555.555.254.254.155.053.753.752.654.1 GermanyManufacturing58.258.356.856.455.654.355.054.353.653.854.552.151.850.750.552.353.252.952.152.353.351.851.951.152.1 GermanyRetail56.252.551.250.352.049.651.053.054.152.051.654.051.054.152.549.550.549.652.454.054.757.754.055.852.6 GermanyServices55.455.654.453.454.355.154.250.951.754.453.755.254.555.155.355.056.055.654.554.154.953.853.853.054.0 GermanyConstruction54.656.454.152.054.953.952.952.451.651.650.452.753.455.859.657.955.552.551.852.450.350.650.750.851.0 GreeceManufacturing48.246.747.746.649.348.348.649.250.448.750.448.449.749.048.450.050.248.147.343.339.130.246.948.046.5 HongKongWholeEconomy51.149.949.649.950.349.548.249.349.047.245.447.245.345.546.446.146.446.646.645.744.448.249.247.648.6 IndiaComposite51.352.350.749.447.649.155.452.454.652.451.150.952.854.351.253.351.650.252.651.552.652.049.251.252.5 IndiaManufacturing52.552.550.750.449.652.354.452.152.651.851.750.750.552.451.151.149.150.350.751.252.352.751.352.651.3 IndiaServices50.251.550.348.746.846.754.552.054.751.950.351.053.754.351.454.353.650.153.251.351.850.847.749.652.4 IndonesiaManufacturing51.250.549.350.449.049.748.750.950.448.451.950.650.950.648.748.947.846.947.847.448.447.347.847.146.7 IrelandComposite58.756.957.859.358.455.554.054.856.956.559.259.158.160.759.561.159.260.257.759.559.761.860.960.859.7 IrelandManufacturing55.053.653.855.555.753.752.151.351.750.253.051.552.654.952.954.354.253.353.653.853.656.754.657.155.8 IrelandServices61.159.160.661.059.156.054.656.259.759.561.261.759.862.862.164.061.863.660.162.462.163.463.361.460.6 IrelandConstruction#N/A60.857.955.758.959.862.358.758.461.059.755.956.462.368.863.658.655.556.355.856.559.165.763.357.2 ItalyComposite56.854.254.852.852.953.451.151.151.952.252.650.853.152.453.753.856.054.353.953.455.053.554.053.753.9 ItalyManufacturing56.255.755.053.053.252.250.951.049.851.253.552.453.953.552.253.255.654.954.152.753.855.354.154.853.8 ItalyRetail48.345.145.545.647.948.846.545.043.240.340.245.242.646.649.447.950.247.748.851.748.750.746.748.349.0 ItalyServices56.252.954.152.452.353.351.050.752.352.051.949.852.151.253.853.655.353.453.453.354.652.053.452.553.1 ItalyConstruction48.649.049.949.250.248.545.945.147.746.944.947.245.345.846.147.248.647.346.448.548.049.247.049.348.4 JapanComposite52.652.952.252.352.852.051.348.949.850.149.049.248.949.951.052.652.252.352.351.252.951.551.551.650.7 JapanManufacturing52.752.453.352.752.451.351.450.449.549.348.147.748.249.150.152.352.652.652.451.051.751.250.150.949.9 JapanServices52.252.951.351.952.351.850.548.249.650.449.450.449.350.051.252.451.551.652.251.453.751.251.851.551.3 LebanonWholeEconomy47.546.947.747.747.046.943.845.145.045.544.444.844.145.047.449.147.946.947.148.147.849.349.348.049.0 MexicoManufacturing50.751.550.650.850.251.151.851.950.950.651.153.652.453.253.152.252.453.053.052.152.452.952.053.353.8 NetherlandsManufacturing57.857.858.356.557.357.055.753.453.553.252.052.752.653.651.752.453.453.553.753.053.956.056.255.554.0 PolandManufacturing54.153.554.254.854.351.950.252.251.550.351.852.151.053.852.850.952.152.152.250.951.154.554.352.454.0 RussiaComposite55.356.355.458.356.655.853.753.152.953.553.551.251.350.850.648.447.850.549.050.949.350.949.551.650.8 RussiaManufacturing50.852.452.554.753.753.652.451.150.849.551.549.648.048.349.349.848.750.150.249.147.948.348.747.648.9 SaudiArabiaWholeEconomy56.556.457.056.755.555.053.255.356.656.054.454.854.254.554.453.954.456.355.756.558.757.756.157.058.3 SouthAfricaWholeEconomy50.350.750.551.351.650.850.550.749.849.949.650.247.947.049.149.649.149.647.547.949.348.949.250.151.5 SouthKoreaManufacturing49.448.449.249.049.448.048.047.648.650.150.550.150.049.548.749.550.749.149.149.247.947.646.147.848.8 SpainComposite57.356.857.054.755.555.254.454.154.853.755.754.855.255.154.555.355.256.255.054.658.858.355.858.359.1 SpainManufacturing54.553.954.855.655.354.553.352.351.051.052.251.853.553.454.155.453.053.151.351.753.253.654.555.854.2 SpainServices57.857.457.754.255.055.154.654.756.054.156.055.455.155.354.154.655.156.755.955.159.659.756.158.460.3 TaiwanManufacturing54.456.254.555.656.254.752.752.251.851.050.548.549.751.149.450.651.749.547.846.946.147.146.349.349.2 TurkeyManufacturing51.752.349.748.747.748.849.848.347.047.647.449.448.949.250.350.952.250.949.548.849.350.149.050.248.5 UnitedArabEmiratesWholeEconomy56.156.256.055.355.054.253.354.154.755.353.454.052.854.553.152.753.354.554.056.057.155.854.756.456.8 UnitedKingdomComposite56.254.853.855.256.755.354.853.853.547.452.553.152.153.652.855.855.255.855.253.355.256.857.555.958.6 UnitedKingdomManufacturing57.354.254.855.556.053.554.555.353.448.152.450.649.751.351.152.451.352.554.851.451.752.251.452.152.3 UnitedKingdomServices55.855.053.354.556.255.254.552.652.947.452.353.552.353.752.755.655.555.954.953.355.657.458.556.559.5 UnitedKingdomConstruction53.152.252.552.254.252.852.652.349.245.946.051.252.054.254.255.057.855.358.859.957.357.158.155.954.2 UnitedStatesManufacturing52.853.354.255.054.354.153.451.552.052.951.350.750.851.551.352.451.252.854.153.153.053.853.654.054.1 UnitedStatesServices53.152.853.855.653.954.654.852.351.051.451.451.352.851.349.753.254.356.154.855.156.155.754.856.257.4 UnitedStatesComposite53.253.054.155.854.154.954.952.351.551.851.250.952.451.350.053.254.055.955.055.055.755.754.656.057.0 VietnamManufacturing54.154.654.251.952.454.051.752.952.251.952.652.752.350.750.351.551.349.450.149.551.352.652.254.853.5 WorldComposite53.753.753.453.953.653.253.151.751.551.751.150.951.451.350.752.352.353.252.752.453.453.352.853.253.8 WorldManufacturing52.853.053.052.752.752.051.951.050.751.050.450.150.250.750.050.950.751.051.050.450.550.850.951.150.9 WorldServices53.653.653.154.053.553.152.951.651.351.651.351.251.751.350.852.652.653.653.253.154.454.053.353.854.6 The table shows monthly PMI statistics across countries and different sectors per country for the past two years. The latest data is next to the country/sector name at the bottom of the page. 2012 Eurozone crisis Brazil in recession Italy’s permanent recession Improving picture in the UK and US EM recovery
- 10. MONTHLY VIEWPOINT From the Chief Investment Officer Marco E Pabst 13 th May 2017 ACPI Investments Ltd. Pegasus House | 37-43 Sackville Street | London W1S 3EH T +44 (0)20 3697 9580 | F +44 (0)20 3697 9501 | E marco.pabst@acpi.com www.acpi.com 10 The World in Numbers Source(s): ACPI, Bloomberg Date PMI CPI (%) Disc rate % Ind Prodyoy% Exports ($M) Imports ($M) Trade bal ($M) M2 ($bn) M2 mom% Unempl % Date GDP yoy% 31/10/2016 51.8 1.6 0.5 -0.8 128,950 193,874 -64,924 13,068 4.8 30/06/2016 1.3 30/11/2016 57.2 1.70 0.50 -0.41 124,050 193,186 -69,136 13,145 0.6% 4.6 30/09/2016 1.7 31/12/2016 53.9 2.1 0.75 0.83 126,945 185,608 -58,663 13,181 0.3% 4.7 31/12/2016 2 31/01/2017 50.3 2.5 0.75 -0.01 118,802 187,628 -68,826 13,261 0.6% 4.8 31/03/2017 1.9 28/02/2017 57.4 2.7 0.75 0.25 119,827 170,966 -51,139 13,299 0.3% 4.7 31/03/2017 57.7 2.4 1 1.53 136,043 196,588 -60,545 13,381 0.6% 4.5 30/04/2017 58.3 1.00 4.4 Date PMI CPI (%) Disc rate % Ind Prodyoy% Exports ($bn) Imports ($bn) Trade bal ($bn) M2 (RMBbn) M2 mom% Date GDP yoy% 31/10/2016 51.2 2.1 1.50 6.1 176.87 128.67 48.2 151,949 30/06/2016 6.7 30/11/2016 51.7 2.3 1.50 6.2 193.56 150.48 43.1 153,043 0.7% 30/09/2016 6.7 31/12/2016 51.4 2.1 1.50 6.0 209.15 169.47 39.7 155,007 1.3% 31/12/2016 6.8 31/01/2017 51.3 2.5 1.50 7.6 182.33 131.42 50.9 157,595 1.7% 31/03/2017 6.9 28/02/2017 51.6 0.8 1.50 119.83 129.08 -9.3 158,291 0.4% 31/03/2017 51.8 0.9 1.50 180.6 156.68 23.9 159,961 1.1% 30/04/2017 51.2 1.50 180 141.96 Date PMI CPI (%) Disc rate % Ind Prodyoy% Exports (€bn) Imports (€bn) Trade bal (€bn) M2 EZ (€bn) M2 EZ mom% Unempl % Date GDP yoy% 31/10/2016 55 0.8 0.00 1.6 100.61 80.01 20.6 10,566,185 6.0 30/06/2016 1.8 30/11/2016 54.3 0.8 0.00 2.3 103.64 82.8 20.8 10,659,460 0.9% 6.0 30/09/2016 1.7 31/12/2016 55.6 1.7 0.00 -0.1 101.55 82.8 18.8 10,732,189 0.7% 6.0 31/12/2016 1.7 31/01/2017 56.4 1.9 0.00 -0.5 104.02 85.14 18.9 10,732,385 0.0% 5.9 28/02/2017 56.8 2.2 0.00 2.5 104.97 83.77 21.2 10,767,391 0.3% 5.9 31/03/2017 58.3 1.6 0.00 10,855,378 0.8% 5.8 30/04/2017 58.2 2 0.00 5.8 Date PMI CPI (%) Disc rate % Ind Prodyoy% Exports,GBPM Imports,GBPM Trade bal (GBPM) M2 (GBPM) M2 mom% Unempl % Date GDP yoy% 31/10/2016 54.5 0.9 0.25 -0.8 48,053 48,741 -688 1,622,934 4.8 30/06/2016 1.7 30/11/2016 53.5 1.2 0.25 2.3 49,079 51,403 -2,324 1,626,467 0.2% 4.8 30/09/2016 2 31/12/2016 56 1.6 0.25 4.3 49,817 51,650 -1,833 1,639,588 0.8% 4.8 31/12/2016 1.9 31/01/2017 55.5 1.8 0.25 3.3 48,816 51,791 -2,975 1,619,627 -1.2% 4.7 31/03/2017 2.1 28/02/2017 54.8 2.3 0.25 2.8 48,451 52,114 -3,663 1,620,520 0.1% 4.7 31/03/2017 54.2 2.3 0.25 1,646,036 1.6% 30/04/2017 57.3 0.25 Date CPI (%) Disc rate % Ind Prodyoy% Exports,JPYbn Imports,JPYbn Trade bal (JPYbn) M2 (JPY TRN) M2 mom% Unempl % Date GDP yoy% 31/10/2016 0.1 -1.2 5,870 5,389 481 945 3.0 30/06/2016 0.9 30/11/2016 0.5 4.4 5,956 5,810 147 951 0.7% 3.1 30/09/2016 1.1 31/12/2016 0.3 3.1 6,679 6,043 636 959 0.8% 3.1 31/12/2016 1.6 31/01/2017 0.4 3.2 5,422 6,514 -1,092 961 0.3% 3 28/02/2017 0.3 4.7 6,347 5,536 811 958 -0.3% 2.8 31/03/2017 0.2 3.3 7,230 6,616 614 963 0.5% 2.8 00/01/1900 4.5 Date CPI (%) Disc rate % Ind Prodyoy% Exports ($M) Imports ($M) Trade bal ($M) M3 (INR 10M) M2 mom% Date GDP yoy% 31/10/2016 4.2 6.25 -1.9 23,513 33,674 -10,161 12,415,090 30/06/2016 6.9 30/11/2016 3.6 6.25 5.6 20,010 33,018 -13,009 12,175,870 -1.9% 30/09/2016 6.7 30/12/2016 3.4 6.25 -0.1 23,885 34,254 -10,369 12,044,950 -1.1% 31/12/2016 6.6 31/01/2017 3.2 6.25 3.3 22,115 31,956 -9,841 12,156,100 0.9% 28/02/2017 3.7 6.25 -1.2 24,490 33,387 -8,896 12,308,280 1.3% 31/03/2017 3.8 6.25 29,232 39,669 -10,437 12,839,080 4.3% 28/04/2017 6.25 12,682,860 -1.2% INDIA US CHINA GERMANY UK JAPAN
- 11. MONTHLY VIEWPOINT From the Chief Investment Officer Marco E Pabst 13 th May 2017 ACPI Investments Ltd. Pegasus House | 37-43 Sackville Street | London W1S 3EH T +44 (0)20 3697 9580 | F +44 (0)20 3697 9501 | E marco.pabst@acpi.com www.acpi.com 11 Performance of different asset classes Source(s): ACPI, Bloomberg EQUITIES Currency APRIL 2017 2016 2015 2014 2013 2012 2011 MSCI World USD 1,878.3 1.3% 7.3% 5.3% -2.7% 2.9% 24.1% 13.2% -7.6% MSCI World (EUR hedged) EUR 145.9 0.9% 5.6% 5.6% -0.2% 7.4% 25.4% 12.0% -7.8% MSCI World (GBP hedged) GBP 752.0 0.9% 5.8% 6.0% -0.1% 7.9% 26.5% 12.6% -7.9% MSCI World (USD hedged) USD 500.1 1.0% 6.1% 7.2% 0.1% 7.6% 26.1% 13.1% -23.3% MSCI World local Local 532.2 1.1% 6.4% 6.8% -0.7% 7.2% 22.9% 13.2% -8.5% US (S&P500) USD 2,384.2 0.9% 6.5% 9.5% -0.7% 11.4% 29.6% 13.4% 0.0% Europe (Stoxx 600) EUR 387.1 1.6% 7.1% -1.2% 6.8% 4.4% 17.4% 14.4% -11.3% Eurozone (Euro Stoxx 50) EUR 3,559.6 1.7% 8.2% 0.7% 3.8% 1.2% 17.9% 13.8% -17.0% Germany (DAX30) EUR 12,438.0 1.0% 8.3% 6.9% 9.6% 2.7% 25.5% 29.0% -14.7% UK (FTSE 100) GBP 7,203.9 -1.6% 0.9% 14.4% -4.9% -2.7% 14.4% 5.8% -5.5% France (CAC40) EUR 5,267.3 2.8% 8.3% 4.9% 8.5% -0.5% 18.0% 15.2% -16.9% Greece (ASE) EUR 712.2 6.9% 10.6% 1.9% -23.6% -28.9% 28.0% 33.4% -51.9% Spain (IBEX) EUR 10,715.8 2.4% 14.6% -2.0% -7.2% 3.7% 21.4% -4.7% -13.1% Italy (MIB) EUR 20,609.2 0.6% 7.1% -10.2% 12.7% 0.2% 16.6% 7.8% -25.2% Japan (Nikkei 225) JPY 19,196.7 1.5% 0.4% 0.4% 9.1% 7.1% 56.7% 22.9% -17.9% MSCI Emerging Markets USD 978.0 2.0% 13.4% 8.6% -17.0% -4.6% -5.0% 15.1% -20.4% MSCI Emerging Markets local Local 52,328.4 2.2% 9.8% 7.1% -8.0% 2.5% 0.9% 13.9% -14.9% MSCI Asia ex Japan USD 594.2 2.1% 15.5% 2.9% -11.3% 2.2% 0.7% 19.4% -19.2% MSCI Eastern Europe USD 150.7 2.6% 2.7% 33.0% -8.1% -40.0% -2.9% 13.2% -23.3% MSCI Latin America USD 2,600.7 -0.4% 11.1% 27.9% -32.9% -14.8% -15.7% 5.4% -21.9% Russia (MICEX) RUB 2,016.7 1.0% -9.7% 26.8% 26.1% -7.1% 2.0% 5.2% -16.9% India (Sensex) INR 29,918.4 1.0% 12.4% 1.9% -5.0% 29.9% 9.0% 25.7% -24.6% Brasil (Bovespa) BRL 65,403.3 0.6% 8.6% 38.9% -13.3% -2.9% -15.5% 7.4% -18.1% Hong Kong (Hang Seng) HKD 24,615.1 2.1% 11.9% 0.4% -7.2% 1.3% 2.9% 22.9% -20.0% China (Shanghai Comp) CNY 3,154.7 -2.1% 1.6% -12.3% 9.4% 52.9% -6.8% 3.2% -21.7% South Korea (Kospi) KRW 2,205.4 2.1% 8.8% 3.3% 2.4% -4.8% 0.7% 9.4% -11.0% Israel (TA 25) ILS 1,398.8 0.1% -4.9% -3.8% 4.4% 10.2% 12.1% 9.2% -18.2% South Africa (Top 40) ZAR 47,071.7 4.2% 7.2% -4.1% 4.2% 6.0% 19.2% 22.2% -0.6% FIXED INCOME APRIL 2017 2016 2015 2014 2013 2012 2011 Citigroup WorldBig USD 213.5 1.3% 2.6% 1.9% -3.2% 0.8% 24.1% 13.2% -7.6% Citigroup WorldBig local Local 220.5 0.6% 0.8% 3.3% 0.9% 7.9% -0.1% 5.6% 5.7% Citigroup WorldBig (EUR hedged) EUR 220.8 0.5% 0.5% 2.4% 0.6% 7.8% -0.2% 5.5% 6.2% Citigroup WorldBig (GBP hedged) GBP 271.0 0.6% 0.7% 3.6% 1.3% 8.2% 0.1% 5.8% 5.9% Citigroup WorldBig (USD hedged) USD 238.3 0.7% 1.0% 3.9% 0.9% 7.8% -0.1% 5.6% 5.5% World government bonds (Citi) USD 909.3 1.3% 2.9% 1.6% -3.6% -0.5% -4.0% 1.7% 6.4% US Treasuries, total return USD 222.3 0.7% 1.5% 1.1% 0.8% 6.1% -3.4% 2.1% 9.9% US 10-year yield USD 2.28% -0.11 -0.16 0.17 0.10 -0.86 1.27 -0.12 -1.42 US 10-year bond USD 125.7 0.9% 1.2% -1.3% -0.7% 3.0% -7.3% 1.3% 8.9% US 5y/5y forward inflation expectation USD 2.10% -0.02 0.06 0.24 -0.33 -0.51 -0.32 0.58 -0.39 Eurozone government debt EUR 230.2 0.5% -1.1% 3.3% 1.6% 13.1% 2.2% 11.0% 3.4% Eurozone corporate bonds EUR 223.0 0.5% 0.8% 4.7% -0.7% 8.2% 2.2% 13.6% 1.7% EU high yield (BofAML) USD 293.2 1.1% 2.8% 9.1% 0.8% -7.4% 15.0% 29.2% -5.6% Germany 10-year yield EUR 0.32% -0.01 0.11 -0.42 0.09 -1.39 0.61 -0.51 -1.14 Germany 10-year bond EUR 161.8 0.2% -1.4% 3.9% 1.3% 12.0% -4.4% 4.8% 11.0% UK 10-year yield GBP 1.09% -0.05 -0.15 -0.72 0.20 -1.27 1.19 -0.15 -1.42 Japan 10-year yield JPY 0.02% -0.05 -0.03 -0.22 -0.06 -0.41 -0.05 -0.20 -0.14 China 10-year yield CNY 3.47% 0.18 0.41 0.20 -0.79 -0.97 1.03 0.15 -0.47 India 10-year yield INR 6.96% 0.28 0.45 -1.25 -0.10 -0.97 0.78 -0.52 0.65 Russia 10-year yield RUB 7.55% -0.31 -0.73 -1.10 -4.13 5.98 0.89 -1.65 0.61 Loans, total return (S&P LSTA) USD 2,732.5 0.4% 1.6% 10.2% -0.7% 1.6% 5.3% 9.7% 1.5% US High yield (BofAML) USD 1,219.8 1.1% 3.9% 17.5% -4.6% 2.5% 7.4% 15.6% 4.4% US investment grade (BofAML) USD 2,799.1 1.0% 2.4% 6.0% -0.6% 7.5% -1.5% 10.4% 7.5% US mortgages (BofAML) USD 2,045.4 0.6% 1.1% 1.7% 1.5% 6.1% -1.4% 2.6% 6.1% US municipals (BofAML) USD 537.9 0.7% 2.1% 0.4% 3.6% 9.8% -2.9% 7.3% 11.2% Global high yield (BBG) USD 167.3 1.5% 4.5% 14.8% -4.7% -0.3% 7.6% 18.6% 2.7% EM hard-currency debt (JPM EMBI+) USD 818.6 2.2% 6.0% 9.6% 1.8% 6.2% -8.3% 18.0% 9.2% EM external government debt (BofAML) USD 1,100.9 1.8% 5.7% 7.6% -1.0% 5.2% -3.3% 17.6% 5.8% EM investment grade (BofAML) USD 359.4 0.9% 3.3% 5.5% -1.0% 3.9% -1.3% 13.2% 5.6% Emerging market spreads USD 246.3 1.29 -40.50 -218.44 81.55 113.54 43.24 US Investment-grade spreads USD 115.3 1.80 -8.33 -44.55 49.98 22.95 -31.46 US high-yield spreads USD 392.9 -3.55 -36.88 -289.20 187.09 180.41 -74.78 CURRENCIES APRIL 2017 2016 2015 2014 2013 2012 2011 Dollar index 99.1 -1.3% -3.1% 3.6% 9.3% 12.8% 0.3% -0.5% 1.5% Euro 1.1 2.3% 3.6% -3.2% -10.2% -12.0% 4.2% 1.8% -3.2% Pound Sterling 1.3 3.2% 5.0% -16.3% -5.4% -5.9% 1.9% 4.6% -0.4% Swiss Franc 1.0 0.8% 2.4% -1.6% -0.8% -10.2% 2.5% 2.6% -0.4% Japanese Yen 111.5 -0.1% 4.9% 2.8% -0.5% -12.1% -17.6% -11.3% 5.5% Renminbi 6.9 -0.1% 0.9% -6.6% -4.4% -2.4% 2.9% 1.1% 4.8% Won 1,137.7 -1.8% 6.2% -2.6% -7.0% -3.8% 1.0% 9.1% -3.2% Brasilian Real 3.2 -1.7% 2.4% 21.7% -33.0% -11.1% -13.2% -9.1% -11.0% Indian Rupee 64.2 0.9% 5.7% -2.6% -4.5% -2.0% -11.0% -3.1% -15.8% USD real effective exchange rate (Barclays) 135.3 -0.7% -3.6% 4.2% 7.9% 7.7% 1.4% -2.7% 1.7% EUR real effective exchange rate (Barclays) 69.9 2.0% 0.8% -1.2% -4.9% -3.8% 4.4% -1.9% -1.2% JPY real effective exchange rate (Barclays) 130.0 0.6% 2.1% 3.6% 4.9% -7.1% -17.5% -15.1% 2.5% COMMODITIES APRIL 2017 2016 2015 2014 2013 2012 2011 Global commodities, total return (S&P GSCI) USD 2,246.9 -2.1% -7.1% 11.4% -32.9% -33.1% -1.2% 0.1% -1.2% Agriculture, spot return USD 289.2 0.0% -0.6% 2.6% -12.1% -8.3% -22.1% 3.9% -14.9% Energy, total return USD 378.9 -3.6% -12.9% 18.1% -41.5% -44.1% 5.1% -1.4% 4.9% Crude oil USD 409.7 -3.2% -12.0% 8.0% -45.3% -42.6% 6.0% -11.5% -1.3% Industrial metals, total return USD 1,188.5 -3.1% 5.9% 17.6% -24.5% -7.4% -12.9% 1.4% -22.3% Copper USD 3,495.5 -1.9% 3.2% 17.3% -24.9% -12.7% -7.9% 4.3% -21.5% Livestock, total return USD 1,970.6 8.6% 10.0% -7.3% -18.3% 14.2% -3.6% -4.0% -1.2% Precious metals USD 1,541.9 0.6% 9.5% 8.4% -11.1% -4.1% -29.8% 6.2% 6.6% Gold, total return USD 676.8 1.4% 9.8% 7.7% -10.9% -1.7% -28.7% 6.1% 9.6% REAL ESTATE APRIL 2017 2016 2015 2014 2013 2012 2011 All Equity REITS total returns (FTSE NAREIT) USD 16,390.8 0.4% 3.0% 8.6% 2.8% 28.0% 2.9% 19.7% 8.3% FTSE EPRA NAREIT developed markets, total return USD 4,629.3 1.1% 3.5% 5.0% 0.1% 15.9% 4.4% 28.7% -5.8% FTSE EPRA NAREIT emerging markets USD 2,225.1 0.5% 13.0% 0.2% 2.5% 15.1% -20.0% 36.1% -28.9% New York home prices USD 184.9 0.0% 0.2% 2.8% 3.7% 2.8% 6.2% -0.3% -3.3% Greater London house price (£) GBP 636,777.0 -2.0% 3.3% -0.1% 9.9% 11.7% 10.6% 6.8% 6.4% German house prices EUR 116.7 0.0% 0.6% 8.7% 1.7% 6.6% 3.5% 5.0% 8.4% Moscow prop prices (US$/sqm) USD 2,949.0 2.3% 9.2% 3.6% -32.7% -24.8% -2.6% 6.0% 9.5% Beijing property prices (RMB/sqm) RMB 40,677.0 0.0% 3.5% 32.6% 14.7% -3.2% 30.7% -7.9% 7.9% HEDGE FUNDS APRIL 2017 2016 2015 2014 2013 2012 2011 Global hedge funds USD 1,228.6 0.4% 2.1% 2.5% -3.6% -0.6% 6.7% 3.5% -8.9% Equity hedge funds USD 1,195.2 0.7% 3.4% 0.1% -2.3% 1.4% 11.1% 4.8% -19.1% Event-driven hedge funds USD 1,621.9 0.7% 3.7% 11.1% -6.9% -4.1% 13.9% 6.0% -4.9% CTA funds USD 1,126.0 -0.1% -0.8% -2.9% -2.0% 5.2% -1.8% -1.0% -4.9% Credit hedge funds USD 2,004.2 0.4% 1.6% 5.0% -4.4% -1.8% 6.9% 7.7% -3.6% Activist hedge funds USD 2,373.6 0.0% 3.0% 9.1% 0.2% 8.5% 19.2% 9.3% -16.9%
- 12. MONTHLY VIEWPOINT From the Chief Investment Officer Marco E Pabst 13 th May 2017 ACPI Investments Ltd. Pegasus House | 37-43 Sackville Street | London W1S 3EH T +44 (0)20 3697 9580 | F +44 (0)20 3697 9501 | E marco.pabst@acpi.com www.acpi.com 12 Performance and valuations of international equity markets Year to Market Rolling 1-yr Rolling 2-yr Rolling 3-yr EPS growth Country date Cap (USDbn)* change change change 2016E 2017E 2017E 2016E 2017E WORLD All Country MSCI MXWD Index 8.8% 49,885 16.1% 4.5% 10.8% 16.6 15.0 10.7% 2.5% 2.7% Developed World MXWO Index 8.3% 41,269 15.4% 5.7% 12.4% 17.3 15.6 10.6% 2.5% 2.6% Emerging World MXEF Index 13.5% 8,616 21.5% -5.5% -3.0% 12.5 11.2 11.3% 2.7% 3.0% AMERICAS US (S&P500) SPX Index 7.2% 21,307 16.6% 13.4% 27.9% 18.5 16.5 12.0% 2.0% 2.2% US (Dow Jones Industrial) INDU Index 6.3% 5,956 18.4% 15.5% 26.9% 17.4 15.8 10.0% 2.4% 2.6% US mid/small cap RTY Index 2.9% 2,280 25.3% 13.1% 27.3% 27.9 21.6 28.8% 1.3% 1.3% Canada SPTSX Index 1.9% 1,709 13.7% 2.7% 7.1% 16.9 15.0 12.7% 2.9% 3.2% Mexico MEXBOL Index 8.4% 302 9.5% 9.7% 18.8% 18.2 16.0 13.8% 2.2% 2.4% Argentina MERVAL Index 25.1% 100 57.3% 73.4% 210.7% 9.1 7.8 17.4% 1.3% Brazil IBOV Index 9.1% 633 27.1% 15.0% 23.0% 12.3 11.0 11.6% 3.4% 4.1% EUROPE Europe SXXP Index 8.9% 11,153 18.7% -1.6% 15.9% 16.1 14.7 9.5% 3.4% 3.6% Germany DAX Index 10.5% 1,309 28.5% 8.3% 32.0% 14.0 13.0 7.7% 2.9% 3.1% France CAC Index 10.7% 1,617 25.2% 5.8% 19.5% 15.9 14.3 10.9% 3.2% 3.4% UK UKX Index 2.3% 2,529 19.3% 3.7% 6.8% 14.9 13.8 8.0% 4.2% 4.4% Spain IBEX Index 18.4% 730 27.2% -3.1% 4.5% 15.5 14.1 10.0% 3.4% 3.7% Italy FTSEMIB Index 11.2% 530 19.9% -8.3% -1.6% 14.9 12.7 17.5% 3.6% 3.9% Switzerland SMI Index 9.5% 1,124 16.3% -1.0% 6.3% 18.1 16.4 10.4% 3.4% 3.6% Norway OBX Index 2.8% 184 18.7% 8.2% 17.6% 14.9 13.1 13.1% 4.4% 4.7% Sweden OMX Index 7.6% 580 24.7% 1.0% 20.2% 16.6 15.4 7.9% 3.6% 3.8% Austria ATX Index 16.5% 90 36.2% 15.0% 22.5% 14.6 13.1 11.6% 3.0% 3.3% Greece ASE Index 17.6% 47 25.0% -9.8% -38.2% 10.6 17.0 -37.8% 7.2% 2.1% EMERGING EUROPE Hungary BUX Index 2.1% 23 25.0% 43.6% 80.4% 11.6 10.7 8.0% 2.7% 3.1% Kazakhstan KZKAK Index 13.5% 13 62.1% 80.9% 45.3% Ukraine PFTS Index 3.8% 1 25.2% -24.4% -30.9% 7.5 Russia RTSI$ Index -5.8% 520 19.0% 2.5% -11.9% 6.3 5.7 10.5% 5.4% 6.1% Poland WIG Index 19.1% 337 32.1% 7.4% 21.2% 13.2 12.2 7.6% 2.3% 2.7% Czech Rep PX Index 9.2% 46 15.9% -2.2% -0.2% 12.9 13.2 -2.2% 4.8% 4.7% Turkey XU100 Index 20.7% 170 20.4% 12.2% 24.5% 9.3 7.8 18.2% 3.3% 3.8% MIDDLE EAST & AFRICA South Africa TOP40 Index 7.1% 600 4.2% -1.5% 7.1% 14.8 13.8 7.1% 3.2% 3.5% Egypt Hermes Index 7.1% 68.9% 47.7% 42.5% 11.1 9.0 23.2% 2.8% 3.8% Namibia FTN098 Index -2.0% 128 9.8% -11.8% -7.1% 9.6 9.8 -2.2% 4.6% 5.1% Nigeria NGSEINDX Index -2.2% 29 2.2% -23.6% -32.0% 23.9% Israel TA-25 Index -3.1% 1.3% -12.7% 3.8% 12.7 11.4 11.6% 2.0% 2.3% Saudi Arabia SASEIDX Index -4.8% 2.8% -29.4% -29.9% 14.2 12.3 15.5% 3.3% 3.6% Qatar DSMIndex -5.6% 1.3% -19.8% -24.0% 13.2 11.7 12.5% 3.9% 4.2% Dubai DFMGI Index -3.9% 2.0% -17.3% -36.0% 10.1 8.7 15.2% 4.3% 4.5% ASIA Asia MXAPEXA Index 18.6% 2,820 32.8% 3.2% 20.0% 12.7 11.5 10.2% 2.4% 2.6% Japan TPX Index 4.4% 5,165 22.0% 0.0% 34.1% 14.4 13.4 7.5% 2.1% 2.2% Japan NKY Index 4.1% 3,066 23.2% 1.9% 37.6% 17.3 15.9 9.2% 1.8% 2.0% Hong Kong HSI Index 11.7% 2,005 22.2% -10.9% 12.6% 12.2 11.2 9.4% 3.4% 3.6% China domestic shashr Index -0.8% 4,334 5.8% -26.8% 52.8% 13.4 11.8 13.3% 2.0% 2.3% China offshore HSCEI Index 6.3% 600 17.8% -28.9% 2.5% 8.1 7.4 9.0% 3.7% 4.1% Taiwan TWSE Index 7.4% 963 22.0% 2.5% 11.3% 13.9 13.0 6.5% 4.0% 4.2% South Korea KOSPI Index 13.1% 1,208 16.0% 7.5% 17.0% 1.7% 1.8% New Zealand NZSE Index 6.4% 78 3.9% 20.1% 28.4% 19.8 17.9 10.6% 4.3% 4.5% Australia AS30 Index 3.1% 1,376 10.1% 4.7% 8.1% 16.5 15.4 6.9% 4.2% 4.4% Pakistan KSE100 Index 6.6% 80 41.6% 52.0% 78.7% 11.7 9.8 19.1% 4.6% 5.2% Thailand SET50 Index 3.3% 283 13.0% -0.4% 6.5% 14.8 13.5 9.9% 3.1% 3.3% Indonesia JCI Index 7.8% 466 18.4% 10.1% 17.4% 16.3 14.2 14.7% 2.0% 2.2% India NIFTY Index 13.8% 1,021 20.4% 13.7% 39.9% 17.7 14.8 19.8% 1.6% 1.8% Singapore FSSTI Index 12.4% 364 18.5% -6.2% -0.3% 14.8 13.9 7.0% 3.4% 3.6% Malaysia FBMKLCI Index 7.7% 245 7.2% -2.2% -5.1% 16.7 15.7 6.2% 3.1% 3.3% Philippines PCOMP Index 16.4% 184 13.9% 2.6% 17.7% 19.4 17.4 11.3% 1.6% 1.7% Vietnam VNINDEX Index 8.1% 77 18.5% 29.6% 36.4% 13.9 12.2 14.7% 2.5% 2.6% Source(s): ACPI, Bloomberg Data as of: 28-Apr-2017 * Market cap for the main index PER Dividend yield
- 13. MONTHLY VIEWPOINT From the Chief Investment Officer Marco E Pabst 13 th May 2017 ACPI Investments Ltd. Pegasus House | 37-43 Sackville Street | London W1S 3EH T +44 (0)20 3697 9580 | F +44 (0)20 3697 9501 | E marco.pabst@acpi.com www.acpi.com 13 Three-month outlook Highly indebted major World economies are characterised by low GDP growth, low inflation and de-synchronised growth patterns whilst the lack of fiscal stimulus puts the burden on the central banks, keeping interest rates low for a long time to come. Weight Cash We are slightly overweight cash from reductions in fixed income. Equities US Valuations are high but US equities and the dollar serve as safe havens for the time being. Rising wages and the stronger dollar are likely to provide EPS headwinds. Positive sentiment was the missing ingredient to push stocks closer to the tops in this cycle. Europe With most elections in Europe behind us and growth picking up, the outlook has improved for the Eurozone. Potential ECB tapering is likely to support the euro and the financial sector. Japan Japanese equity markets are still amongst the cheapest globally and for as long as yields remain anchored, the market remains attractive, although currency volatility induces substantial equity volatility in the country. China H shares are attractive but onshore markets are still overvalued with the country undergoing a major transition. The domestic consumer is becoming stronger and savings are rising, helped by pro-growth fiscal support. EM Dollar strength and rising US yields in combination with policy issues (Turkey, India, Brazil,...) are a difficult mix for emerging market investors. Valuations are also not sufficiently cheap in order to justify taking these risks in many countries. Central Banks Aggregate central bank balance sheets are still expanding on a global level although the Fed started tightening already and the ECB is expected to announce similar steps soon. FixedIncome DM govt After the correction in DM government bonds in the second half of 2016, yield levels look more attractive than before, especially in the US. In the medium term, yields can rise further as expectations for growth and inflation improve. EM govt The resurgent dollar leads to capital outflows. Dollar bonds of countries with low external debt levels and low/no trade and budget deficits are interesting. The higher the dollar rises, the higher the risk of a crisis in one or more emerging markets. DM credit Spreads have been tightening, supported by recovering commodity prices. Spreads in the US and the UK are more attractive than in the Eurozone where rates are extremely low but likely to rise. EM credit We avoid issuers with substantial hard-currency debt relative to the underlying revenue mix. We would stress-test balance sheets against any EM FX deterioration. Spreads for fundamentally strong issuers in hard currency are attractive. Alt FI We like alternative areas of fixed income such as peer-to-peer lending (P2P) and structured credit. P2P lending offers diversified and uncorrelated low double-digit return streams and returns in structured credit are still attractive. Currencies USD It appears unlikely that the Fed will be able to raise policy rates substantially in the near future. Furthermore, the Fed is concerned about excessive dollar strength that caused problems in various areas such as commodities and EM in the past. EUR Following several elections in Europe, the risk premium for European assets should decline and the euro should benefit accordingly. Any further tapering by the ECB would also be bullish for the euro and Eurozone assets. JPY The BoJ has turned less aggressive recently with regards to providing additional monetary stimulus. Growth prospects and inflation are declining. The market is trying to find a new direction for the yen. EM The resurgent dollar and political crises are putting a lid on EM FX performance despite the recent recovery from post US election lows. We prefer commodity exporters over commodity importers. We like RUB, MXN and avoid TRY and INR. GBP The GBP cheapened substantially as a result of the Brexit vote. Due to the long timeline of the Brexit process, uncertainty will continue, adding a substantial risk premium to the currency. Commodities Oil It appears that the rebalancing of the oil market will take longer than expected with Saudi Arabia drawing down its reserves and the outlook hinges on demand growth as well as OPEC’s ability to control output. Metals Industrial metals have been supported by the outlook of more reflationary policies and fiscal stimulus, especially in the US. Following this surge, the market is now in a wait-and-see mode and wants to see evidence of growth picking up. General We believe that after five years of high negative returns, the commodity complex in general could become more attractive again, especially energy and agricultural commodities but also precious metals as a hedge against tail risks.
- 14. MONTHLY VIEWPOINT From the Chief Investment Officer Marco E Pabst 13 th May 2017 ACPI Investments Ltd. Pegasus House | 37-43 Sackville Street | London W1S 3EH T +44 (0)20 3697 9580 | F +44 (0)20 3697 9501 | E marco.pabst@acpi.com www.acpi.com 14 DISCLAIMER This document is provided for informational purposes only. It does not constitute an offer to sell or a solicitation to buy any security or other financial instrument. While based on information believed to be reliable, no guarantee is given that it is accurate or complete. Any investments referred to may not be suitable for the specific investment objectives, financial situation or individual needs of recipients. Reliance should not be placed on the views and information expressed herein when making any individual investment and/or strategic decisions. You should also be aware that the value of investments and any income from them can go down as well as up, and you may not receive back the amount you originally invested. There can be no assurances that appreciation in value of investments will occur, or that currency fluctuations will not affect the outcomes of any investment adversely. Past performance of the index or individual funds is not a guide to future performance. Certain funds invest in emerging markets which by their nature are higher risk and potentially more volatile than those inherent in established markets. This material is for the use of intended recipients only and the contents may not be reproduced, redistributed, or copied in whole or in part for any purpose without the consent of the issuer of this document. Where foreign securities are included in collective investment schemes, there may be additional risks that arise because of events in different jurisdictions. These may include but are not limited to; potential constraints on liquidity and the repatriation of funds, macroeconomic risks, political risks, foreign exchange risks, tax risks, settlement risks and potential limitations on the availability of market information. Issued by ACPI Investment Ltd (Registered in England - Number 03781549, at 37-43 Sackville Street, London, W1S 3EH), which is authorised and regulated by the Financial Conduct Authority (Register Number 192403). Details can be found on the following link www.fca.org.uk/register. © 2017 ACPI Investments Limited. All rights reserved. No part of the website may be reproduced by any means, whether graphically, electronically, mechanically or otherwise howsoever, including without limitation photocopying and recording on magnetic tape, or included in any information store and/or retrieval system without the prior written permission of ACPI Investments Limited. UK – London Pegasus House 37-43 Sackville Street London W1S 3EH United Kingdom T +44 20 3697 9501 Channel Islands – Jersey Third Floor 7 The Esplanade St Helier JE2 3QA T +44 (0)1534 716444 South Africa – Johannesburg 1 st floor Dunkeld Place 12 North Road Dunkeld West 2196 PO Box 411325 Craighall, 2024 T +27 11 771 5315