The document discusses the upcoming release of a new Thermal module in PLAXIS, which will allow for thermal analysis and thermo-hydro-mechanical coupling. The module will model processes like thermal conduction, diffusion, convection, and advection in soils, and will be fully integrated into the existing PLAXIS interface. The release of the 2D Thermal module in early 2015 will provide new capabilities for applications involving temperature effects in geotechnical engineering.
The article discusses the analysis of excavation for the Groninger Forum project using PLAXIS 3D. The project involves deep excavation near historic buildings. The initial design in PLAXIS 3D Foundation modeled the sloping terrain with vertical steps. The new PLAXIS 3D model allows staged construction modeling and better predicts settlements. While initial predictions matched measurements, the new approach using construction stages provides additional insights and may help address large models.
This document provides a tutorial for using PLAXIS 3D software to model the settlement of a foundation in overconsolidated clay. The tutorial contains 4 cases: (1) A rigid foundation modeled with elastic elements, (2) A raft foundation with applied loads, (3) A pile-raft foundation. The tutorial guides the user through creating the geometry, generating a mesh, performing calculations, and viewing results. It also describes how to model soil layers, assign material properties, apply initial stresses, and set up plastic calculations.
This document provides a tutorial manual for using the PLAXIS 3D finite element software. It contains 7 chapters that describe various geotechnical engineering applications that can be modeled and analyzed using PLAXIS 3D. Each chapter contains step-by-step instructions on creating the geometry, generating a mesh, running calculations, and viewing the results for different example applications, including foundations, excavations, embankments, tunnels, and dynamic/earthquake analyses of structures. The first chapter provides a detailed example of modeling the settlement of different foundation types (rigid, raft, pile-raft) for a building founded in clay.
Modeling of twain Tunnel water conveyanceHamed Zarei
1. The document discusses creating a tunnel model using PLAXIS software, including defining the geometry, material properties, and boundary conditions of the tunnel and surrounding rock.
2. A horseshoe-shaped tunnel with a diameter of 5.3m and space of 12m between tunnels is modeled. Rock and shotcrete material properties are input along with standard earthquake boundary conditions.
3. Dynamic analysis is performed by applying a prescribed displacement at the bottom boundary and vertical harmonic load to model an earthquake, with results viewed in output graphs.
Numerical Simulation of Pile using PLAXISDr. Naveen BP
This document summarizes field tests and numerical simulations conducted by Naveen B.P. on various geotechnical structures. It describes field load tests on single piles under vertical and lateral loads. It also discusses numerical modeling of pile load tests in PLAXIS and compares the results to field data. Additionally, it examines soil nailing analysis, lateral monitoring of secant pile walls, and a comparison of FLAC 3D and PLAXIS 3D for laterally loaded pile analysis. The document provides details of field experience with various pile load tests and numerical modeling techniques for evaluating pile behavior.
FINITE ELEMENT ANALYSIS OF RIGID PAVEMENT USING EVERFE2.24& COMPARISION OF RE...civej
In this study analysis of plain cement concrete pavement was done with 3-D mechanistic FEM computer
programme EVERFE2.24. This programme was developed by Bill David, University of Maine,USA. Rigid
pavement is modelled as a flat slab with DLC as base course and subgrade beneath it.
Stresses in rigid pavement at critical location was calculated due to combined effect of axle load and
environmental factor.These results are compared with IRC58-2015&2002.The disparity between results
are analysed and plotted on graph.
This study finds that stressesgiven by IRC58-2015 is up to 42% less than that given by IRC58-2002, and
stresses given by EverFE2.24 is nearly same as given by IRC58-2002.italso highlighted some issues related
to new code of design i.e. IRC58-2015.
DepthInsight Geoscience Geomodeling Software Technology IntroductionBo Sun
DepthInsight is a geoscience geomodeling software platform including the following modules:
Structural Modeling Module: efficiently and stably build any complex models.
Velocity and Attribute Modeling;
Reservoir Modeling;
Geomechanics: finite element based; A direct calculation based on the structural models, and no need to export structural models into other software;
3D Paleo-Structural Restoration: finite element and geomechanics based;
Enormous Modeling Platform:distributed modeling with multiple users working in individual sub regions simultaneously and then update and seamlessly embed back into the master model.
User guide of reservoir geological modeling v2.2.0Bo Sun
This is the user guide of DepthInsight™ reservoir geological modeling module. For corresponding video tutorials , please visit and subscribe our Youtube channel: https://www.youtube.com/channel/UCjHyG-mG7NQofUWTZgpBT2w
DepthInsight™ software products include modules as follows:
Structure Interpretation
Well and Data Management
Plan Module
Profile Module
Attribute Modeling
Velocity Modeling
Structural Modeling
Reservoir Geological Modeling
Numerical Simulation Gridding
Rock Modeling
Geo-mechanical Modeling
Paleo-Structural Modeling
Enormous Modeling Platform
For more information about our company, Beijing GridWorld Software Technology Co., Ltd., please visit our website: http://gridworld.com.cn/en/
seismic analysis of multistoryed building by ETABSvishal maurya
1) The document compares the seismic analysis of a 12-storey building with dimensions 20m x 20m using ETABS software and manual calculations according to IS 1893:2002.
2) Both methods were used to analyze a symmetric building with a fixed support condition. The results from both analyses were then compared.
3) Both analyses produced similar mathematical values for the lateral forces distributed to each floor, with the manual calculation values being slightly higher than the ETABS software values.
It's a general description of the DepthInsight Software Product Series, including: DepthInsight Express Edition 2015, DepthInsight Profession Edition 2015, Geomechanics, 3D Paleo-Structural Restoration, Enormous Modeling Platform and Software Development Kit.
This document describes an SDK for structural geological modeling. It provides powerful modeling of complex geological structures like faults, horizons, and zones. The SDK was developed in C++ and has interfaces for modeling, visualization, and applications. It includes documentation, demo programs, and has been used in software like DepthInsight for modeling large geological structures.
Study on Effects of P-Delta Analysis on RC StructuresIRJET Journal
This study examines the effects of P-delta analysis on reinforced concrete (RC) structures. Six building models of varying heights (5, 10, 15, 20, 25, and 30 stories) were analyzed with and without considering P-delta effects. P-delta effects refer to additional overturning moments generated in a structure due to the product of a structure's lateral displacement and gravity loads. The study found that considering P-delta effects led to increased story displacements, story drifts, and fundamental periods across all building heights compared to analyses that did not consider P-delta effects. Increases in story displacements and drifts were more significant for taller buildings and models in higher seismic zones. Accounting for P-delta
Seismic Analysis of Multistoried Building for Different Plans using ETABS 2015IRJET Journal
This document presents the results of a seismic analysis of a 15-story building with 4 different plan configurations (rectangular, I-shaped, T-shaped, and L-shaped) using ETABS software. Key results include:
1) Storey shear and joint displacement were highest for T-shaped and L-shaped plans and lowest for rectangular plans.
2) Storey stiffness was lowest for T-shaped plans.
3) Centre of mass displacement was highest for T-shaped plans at 43% greater than rectangular plans.
4) Modal analysis showed that asymmetrical floor plans experienced more deformation than symmetrical plans. The study concludes that symmetrical plans provide better stability for structures in high seismic zones.
Product & technology portfolio of gridworldlinkedin admin
Gridworld is a software company established in 2003 that develops geological modeling software. It has 50 employees across offices in Beijing, Nanjing, and Houston. The company's software allows for complex 3D geological structural modeling without simplification. Key features include simple and efficient modeling, large-scale collaborative modeling, and various analysis and simulation capabilities. Products include structural modeling, velocity modeling, attribute modeling, reservoir modeling, and structural restoration software. The software has been applied to numerous oil fields in case studies covering a wide range of geological scenarios. Gridworld traces its origins back to 1990 in the Computational Geometry Lab at Beihang University.
Cost Analysis and Comparison of a Composite Diagrid Frame with Bare Frame und...IRJET Journal
1) The document compares the cost of constructing a G+11 story high-rise building with and without diagrid frames under dynamic loading conditions using STAAD.pro software.
2) The analysis found that introducing steel diagrid members decreases the cost of construction by allowing for smaller and lighter interior columns and beams.
3) A diagrid structure was also found to be capable of reducing the effects of dynamic loading on the building by decreasing story displacement, bending moment, shear force, and axial force compared to a bare frame structure.
IRJET- Designing and Analysis of Elements of a Multi-Storey BuildingIRJET Journal
1. The document describes designing and analyzing elements of a multi-storey building using three structural design software: STAAD.PRO, ETABS, and SAP.
2. The objective is to model and analyze a 6-storey building considering loads like dead, live, wind and seismic loads per Indian standards and compare results.
3. The analysis includes load calculation, modeling the building in the three software, and comparing results for time taken, accuracy, flexibility and quantities of concrete required. ETABS is found to be fastest while all three software give similar results.
Changes in dam break hydrodynamic modelling practice - Suter et alStephen Flood
Abstract: Today, many organisations rely on hydrodynamic modelling to assess the consequences of dam break failure on downstream populations and infrastructure. The availability of finite volume shock-capturing schemes and flexible mesh schematisations in widely used software platforms imply that dam break modelling projects will be carried out differently in the future: Finite volume based platforms allow widespread application of shock-capturing methods and flexible mesh platforms can represent features in the study area more realistically and are more flexible thanks to varying mesh resolutions. Furthermore, the recent adoption of Graphics Processing Unit (GPU) technology in mainstream scientific and engineering computing will also significantly decrease computation times at relatively low cost.
This paper examines the application of finite volume, flexible mesh and GPU technologies to dam break modelling. One-dimensional (1D) modelling results are compared to those from two-dimensional (2D) finite difference and finite volume approaches. The results demonstrate that there are differences between modelling approaches and that the computational speeds of 2D simulations can be significantly reduced by the use of GPU processors.
Engineering Mechanics: Statics Design problem # 5.4 concrete chutwkehali Haileselassie
The document discusses the design of a concrete chute for delivering wet concrete from a truck to a construction site. It analyzes the forces on the hydraulic cylinder that raises and lowers the chute as it varies between 0 and 50 degrees. Calculations determine the force capacity of the cylinder should be between 472.138 lbs and 884.531 lbs to safely transport the concrete through the varying lengths of the chute segments. The design of the concrete truck, mixer, and chute are considered to properly deliver wet concrete while ensuring safety.
This project aims at simulating lid driven cavity flow problem using package MATLAB. Steady Incompressible Navier-Stokes equation with continuity equation will be studied at various Reynolds number. The main aim is to obtain the velocity field in steady state using the finite difference formulation on momentum equations and continuity equation. Reynold number is the pertinent parameter of the present study. Taylor’s series expansion has been used to convert the governing equations in the algebraic form using finite difference schemes.
This document provides an overview of static reservoir modeling. It discusses grid definition and selection, structural modeling using seismic data interpretation, stratigraphic modeling using well log correlation, lithological modeling to define facies distributions, and petrophysical modeling to estimate properties. Structural modeling involves identifying tops, interpreting faults manually or automatically using ant tracking. Stratigraphic modeling uses sequence stratigraphy and well log correlation. Lithological modeling integrates sedimentology, facies classification, and 3D distribution. Petrophysical modeling can be deterministic or stochastic to interpolate properties between wells.
IRJET- Comparative Study of High Rise Building Subjected to Seismic and Wind ...IRJET Journal
This document compares the results of analyzing and designing a 7-story reinforced concrete building using CYPECAD and ETABS software. Both programs were used to model the building and analyze it under wind, seismic, and gravity loads. The results, such as shear forces, bending moments, storey displacement and drift, were then compared between the two programs. Generally, CYPECAD produced higher maximum values for storey displacement and drift compared to ETABS. For shear forces and bending moments, CYPECAD gave higher values for some load cases and ETABS gave higher values for others. The maximum values from both programs occurred under seismic loading. The document concludes that CYPECAD provides quicker analysis and design but both programs can adequately analyze a
Lid driven cavity flow simulation using CFD & MATLABIJSRD
Steady Incompressible Navier-Stokes equation on a uniform grid has been studied at various Reynolds number using CFD (Computational Fluid Dynamics). Present paper aim is to obtain the stream-function and velocity field in steady state using the finite difference formulation on momentum equations and continuity equation. Reynold number dominates the flow problem. Taylor’s series expansion has been used to convert the governing equations in the algebraic form using finite difference schemes. MATLAB has been used to draw to flow simulations inside the driven-cavity.
This document presents a nonlinear finite element analysis of a reinforced concrete slab tested by McNeice in 1967. A quarter-symmetric model of the slab was created in MSC/Marc using solid elements for the concrete and truss elements for the rebar. The concrete was modeled using damage plasticity to account for cracking and crushing. Load-deflection curves from the Marc analysis are compared to experimental test data and results from Abaqus. The analysis shows the slab initially cracking around 660 lbs and progressively cracking further until reaching ultimate load at 3,498 lbs. Crack patterns produced by Marc at different load levels are also presented.
Kachlakev_RC Control Beam MSC-Marc_wAppendixDavid Dearth
This document analyzes a reinforced concrete control beam tested by Kachlakev using nonlinear finite element techniques in MSC/Marc, Ansys, and Abaqus. It summarizes the geometry and material properties of the control beam, presents the finite element model idealization and boundary conditions, and compares the load-deflection curves from the finite element analysis to experimental test data. The analysis aims to predict the beam's load capacity and cracking behavior using different modeling approaches.
Performance Evaluation of G+5, G+10 and G+15 Story Symmetric and Asymmetric B...IRJET Journal
This document presents the results of a study that evaluated the performance of symmetric and asymmetric buildings of varying heights (G+5, G+10, G+15 stories) under seismic loading, using pushover analysis. Five different building shapes were analyzed - H-shape, L-shape, long slender shape, rectangular shape, and T-shape. Pushover curves showed that symmetric buildings had much higher capacity than asymmetric buildings. Capacity spectrum analysis also indicated the long slender shape building had the highest capacity. Hinge formation analysis found that the long slender shape building developed the most hinges, while the H-shape building developed the fewest. Symmetric buildings were able to sustain higher base forces at lower displacements compared to asymmetric
This document presents a methodological approach for designing composite tanks produced by filament winding. The method aims to reduce the time needed to develop finite element models by integrating MATLAB and Abaqus. It allows the user to define tank geometry parameters, numerically integrate a differential equation to determine the optimal dome profile, and import the profile directly into Abaqus via a MATLAB script without using CAD software. Conducting netting analysis can provide preliminary estimates of required layer thicknesses before developing an accurate finite element model in Abaqus using its wound composite modeler plugin. This integrated approach streamlines the virtual prototyping process for composite pressure vessels.
Evaluation of Modelling of Flow in Fracturesidescitation
Heat-transport is important for geothermal exploration. The presence of
fractures can have a pronounced effect on groundwater and heat transfer.The inclusion of
fractures into geothermal reservoir models on different scales is often still a difficult task. A
comparison of approaches for flow in fractures has been carried out. A very simple
approach is to simulate fractures with thin but highly conductive layers, for instance by
applying the Cubic-Law. A more sophisticated approach, typically in FEM codes, is the
application of lower dimensional (1D/2D) high permeable discrete elements with specific
flow properties, following e.g. Hagen-Poiseuille or Manning-Strickler. However, such an
approach typically fails while studying only partly saturated fractures. For studying the
applicability of simplified fracture modellingapproaches a comparison with a CFD
(Computational Fluid Dynamics) solution was performed. Furthermore a DEM (Discrete
Element Method)approach has been illuminated. The various methodologies are studied by
varying roughnesses,this way studying the versatility of the approach. The sensitivity of
flow in fractures to various numerical parameters can be studied this way. A detailed
analysis of temperature and flow using Péclet and Reynolds numbers helps to quantify the
contributions of the different transfer processes.
This document summarizes a study that analyzed different unsteady friction models used in water hammer analysis software. The study implemented several friction models in Python code and compared them based on input requirements, stability, computational efficiency, and accuracy when validated with experimental data. It was found that Vítkovský's unsteady friction model performed best. This model was then implemented in the WANDA commercial software. Testing showed the model provided more accurate simulations of transient pressure waves compared to the previous quasisteady friction approach.
In this report everything about “CFD ANALYSIS OF PARALLEL FLOW HEAT EXCHANGERS” is written. The idea of choosing this topic is that in any industry a considerable portion of investment is being made for machinery installation and running.
Today in this world every task have been made quicker and fast due to technology advancement but this advancement also demands huge investments and expenditure, every industry desires to make high productivity rate maintaining the quality and standard of the product at low average cost.
This document summarizes a large eddy simulation of flow around a sharp-edged surface-mounted cube. The simulation was performed using the Petsc-Fem code developed at CIMEC. The flow conditions matched published benchmarks, with a Reynolds number of 40,000. An upstream channel flow was first simulated to provide turbulent inflow conditions. The simulation results are analyzed to validate the LES implementation and identify areas for improving turbulence modeling.
Case Study of Solar Flat Plat CollectorIRJET Journal
This document describes a study analyzing the thermal performance of flat plate solar collectors when using different tube path designs and cross-sections. It discusses how the collector efficiency is affected by parameters like the tube material and shape. The researchers created 3D models of collectors with varying tube paths (zigzag, U-bend, parallel etc.) and cross-sections (circular, elliptical) and analyzed them using CFD simulation software. The goal is to identify designs that enhance heat transfer and collector efficiency by changing these factors. Previous studies on similar topics are also reviewed which analyzed tube shapes like triangular but none looked at varying the tube path configurations in depth.
IRJET - CFD Analysis of Hot and Cold Steam Flow in an ElbowIRJET Journal
This document presents a computational fluid dynamics (CFD) analysis of hot and cold steam flow through an elbow pipe using ANSYS software. The study aims to analyze pressure, velocity, temperature and mass transfer distribution for both laminar and turbulent flow conditions. A venturi pipe is used as the hot inlet to aid mixing. Meshing and simulations are performed and results are presented for velocity, temperature, pressure and viscosity at different points within the elbow. The results provide insight into flow patterns that can be used as a reference for elbow pipe design.
This document discusses the use of microclimate analysis tools in architectural design. It provides an overview of commonly used tools like Ladybug, ENVI-met, SimScale, and Eddy3D. It describes challenges encountered in implementing microclimate analysis in a design context, such as setting up representative meteorological boundary conditions and efficiently extracting results from simulations. Methods are presented for constructing boundary conditions from weather files and parsing output data with Python scripts. The benefits of microclimate analysis for architectural design are also discussed.
This document describes a study that analyzed the void fraction distribution within a hydraulic jump in a USBR II stilling basin. Both a physical and numerical model of the case study were developed. Void fraction measurements were taken at different profiles throughout the hydraulic jump for both models. The results from these models were then compared to data from other studies on void fraction distributions in classical hydraulic jumps. The physical model using an optical fiber probe was able to fully reproduce the aeration of the hydraulic jump, while the numerical model missed some aeration mechanisms. The models provide insight into how the energy dissipation devices in the USBR II basin impact the void fraction distribution within the jump.
The design and documentation of large infrastructures have to respond, in an integrated way, to an increasing number of constraints and inter-connected variables. The complexity of those projects prevents them from being approached in a linear or hierarchical fashion, as every parameter has to be balanced in order to reach an optimum result.
This paper summarizes our approach to the management of four complexities in three different projects through the use of constraints and specific processes built around the development of customized design tools. These tools focus in the interoperability and compatibility of information
across the different disciplines engaged in the definition and construction of the project, paying special attention to geometric, structural and energetic issues.
This document is Ian McLeod's portfolio for his Master of Science in Mechanical Engineering. It includes summaries of two projects completed as part of his graduate studies. The first project involved building a two-cover flat plate solar collector and using temperature measurements to calculate the collector's overall loss coefficient. Ian was responsible for constructing the collector, developing equations to model heat transfer, and coding data collection and analysis in LabView and Matlab. The second project used statistical analysis methods to assess risk for small-scale wind energy investments. Ian developed discriminant analysis, error estimation, and other statistical models in Matlab. Both projects demonstrated Ian's engineering and analytical skills in renewable energy applications.
IRJET-V9I12214.Comparative Computational analysis of performance parameters f...IRJET Journal
This document presents a computational analysis comparing the performance of a shell and tube heat exchanger using different working fluids and a helical insert. It analyzes heat transfer rate, overall heat transfer coefficient, and effectiveness using water, SiO2 nanofluid at 0.4% volume fraction, and a helically twisted insert. The nanofluid and insert improve performance by increasing turbulence and the heat transfer coefficient compared to water alone. Calculations of nanofluid properties, heat exchanger parameters, and a performance evaluation criterion are presented. CFD analysis in SolidWorks is used to simulate and validate the virtual heat exchanger model against experimental results.
ANALYSIS AND EVALUATION OF COEFFICIENT OF DISCHARGE ON ORIFICE PLATE AND FLOW...IRJET Journal
This document analyzes and evaluates the coefficient of discharge of orifice plates and flow nozzles through computational fluid dynamics (CFD) simulations. Orifice plates and flow nozzles are differential pressure devices used to measure fluid flow rates. The study models orifice plates and flow nozzles in CATIA and analyzes them in ANSYS to predict flow characteristics like velocity and pressure. The CFD results are used to calculate the coefficient of discharge for different orifice and nozzle diameters. The coefficient of discharge increases with increasing diameter and flow nozzles have a higher coefficient than orifice plates. The theoretical coefficient of discharge values also closely match the analytical values obtained from the CFD simulations.
3D Television: When will it become economically feasible?Jeffrey Funk
This document analyzes when the technology of 3D television became economically feasible. It proposes analyzing a new technology's timing of economic feasibility based on improvements to its key components over time, rather than only considering cost reductions from cumulative production. For 3D TV, improvements in liquid crystal display (LCD) technology that were primarily driven by 2D TV demand, such as increased frame rates and resolution, are what finally made 3D TV economically viable by enabling the use of time-sequential 3D displays and eventually auto-stereoscopic displays without the need for glasses. The document uses 3D TV as a case study to demonstrate this novel approach to understanding when a new technology becomes a viable option for consumers.
This document describes the development of an aeraulic toolbox for modeling and simulating airflow and HVAC systems in Scilab/Xcos. The toolbox includes elements like pipes, hoods, fans, and ideal junctions that can be connected in a circuit. Constitutive equations are provided for calculating pressure drops across each element based on properties like geometry, flow rates, and loss coefficients. An example circuit with three hoods and a fan is presented and numerical results for pressure and flow over time are shown.
NUMERICAL ANALYSIS TO OPTIMIZE THE HEAT TRANSFER RATE OF TUBE-IN-TUBE HELICAL...Netha Jashuva
The document discusses numerical analysis to optimize the heat transfer rate of tube-in-tube helical coil heat exchangers. It begins with an introduction to heat exchangers and computational fluid dynamics (CFD) modeling. It then reviews previous literature on optimizing heat transfer rates in helical coil heat exchangers through varying parameters like coil diameter, pitch, fluid flow rates, and using nanofluids. The literature survey found that increasing the Dean number through these parameters generally increases heat transfer rates, though it also increases pumping power requirements. The goal of the project is to find the optimal point where increased heat transfer rates outweigh increased power needs.
Application of a software programme language called python in determining the...eSAT Journals
Abstract This research was to create software that can analyze, design and determine the cost of a beam/ deck for a simple supported bridge, the name of the software is Ivy. The method employed for the analysis is a grillage method, using finite element (beam element) and comparing the results with a manual approach (moment distribution and influence line). A 15m span was considered with a width of 7.5m, using a grillage distance of 1.5m, a knife edge load of 120KN and a uniformly distributed load of 30KN/m. The BS5400 and BS 8110 were used for the analysis and design. The result shows that values for the maximum bending moment locating the knife edge at 3m from the support is Mmax = 412KNm (manual approach), Mmax= 506.25KNm (Ivy) to give a percentage difference of 18.6%, at 6m, Mmax= 653KNm (manual approach), and Mmax= 566.25KNm with a percentage difference of -15.3%, at mid span 7.5m, it is Mmax= 789KNm (manual approach), Mmax= 768.75KNm(ivy) indicating a percentage difference of -2.63%. Similarly, the shear force at support locating the knife edge load at 3m is Vmax= 24.81KN (manual approach), and Vmax= 33.75KN (ivy) to give a percentage difference of 26.4%, at 6m, Vmax = 57.58KN (manual approach), and Vmax= 67.50KN (ivy) to give a percentage difference of 14.6% while at mid span 7.5m,Vmax = 38.98KN (manual approach), and Vmax= 67.50KN (ivy) to give a percentage difference of 42.2%. The main reinforcement area of steel locating the knife edge load at 3m is As = 5419mm2 (manual approach), and As = 5271.72mm2(ivy) with a percentage difference of -2.7%; at 6m, As = 6145mm2(manual approach), and As = 5910.52mm2(ivy) with a percentage difference of -3.9%, while at mid span 7.5m, As = 8617mm2(manual approach), and As = 8088.6mm2(ivy), giving a percentage difference of -6.5% Keywords: Simply supported long span bridge/deck, Python, Finite element (beam element)
Computational Estimation of Flow through the C-D Supersonic Nozzle and Impuls...IJMTST Journal
In this paper, CFD analysis of flow within, Convergent – Divergent rectangular super sonic nozzle and super sonic impulse turbine with partial admission have been performed. The analysis has been performed according to shape of a super sonic nozzle and length of axial clearance and the objective is to investigate the effect of nozzle-rotor interaction on turbine’s performance. It is found that nozzle-rotor interaction losses are largely dependent on axial clearance, which affects the flow within nozzle and the extent of flow expansion. Therefore selecting appropriate length of axial clearance can decrease nozzle-rotor interaction losses. The work is carried in two stages:1) Modeling and analysis of flow for rectangular convergent divergent super sonic nozzle. 2) Prediction of optimal axial gap between the nozzle and rotor blades by allowing the above nozzle flow. In the present work, using a finite volume commercial code, ANSYS FLUENT 14.5, carries out flow through the convergent divergent nozzle study. The nozzle geometry is modeled and grid is generated using ANSYS14.5 Software. Computational results are in good agreement with the experimental ones.
Rapid prototyping refers to technologies that can automatically construct physical models from CAD data. These technologies allow designers to quickly create tangible prototypes rather than just 2D pictures. The document discusses several rapid prototyping techniques including stereolithography, laminated object manufacturing, selective laser sintering, fused deposition modeling, solid ground curing, and 3D inkjet printing. All techniques involve slicing a 3D CAD model into layers and building the model layer-by-layer. Rapid prototyping enables faster and cheaper prototype production compared to traditional methods, facilitating improved product design and testing.
This document summarizes the latest issue of the Engineering Edge newsletter from Mentor Graphics. It discusses new product releases including an updated version of FloTHERM and a new 12-channel power tester. It highlights several customer applications using FloEFD and Flowmaster software for simulations in industries like submarine design, train exhaust systems, and power supply development. The newsletter also features an interview about liquid cooling of power modules, a technology article on the future of CFD, and a summary of a conference paper on extracting thermal interface material properties.
ACEP Magazine edition 4th launched on 05.06.2024Rahul
This document provides information about the third edition of the magazine "Sthapatya" published by the Association of Civil Engineers (Practicing) Aurangabad. It includes messages from current and past presidents of ACEP, memories and photos from past ACEP events, information on life time achievement awards given by ACEP, and a technical article on concrete maintenance, repairs and strengthening. The document highlights activities of ACEP and provides a technical educational article for members.
International Conference on NLP, Artificial Intelligence, Machine Learning an...gerogepatton
International Conference on NLP, Artificial Intelligence, Machine Learning and Applications (NLAIM 2024) offers a premier global platform for exchanging insights and findings in the theory, methodology, and applications of NLP, Artificial Intelligence, Machine Learning, and their applications. The conference seeks substantial contributions across all key domains of NLP, Artificial Intelligence, Machine Learning, and their practical applications, aiming to foster both theoretical advancements and real-world implementations. With a focus on facilitating collaboration between researchers and practitioners from academia and industry, the conference serves as a nexus for sharing the latest developments in the field.
Embedded machine learning-based road conditions and driving behavior monitoringIJECEIAES
Car accident rates have increased in recent years, resulting in losses in human lives, properties, and other financial costs. An embedded machine learning-based system is developed to address this critical issue. The system can monitor road conditions, detect driving patterns, and identify aggressive driving behaviors. The system is based on neural networks trained on a comprehensive dataset of driving events, driving styles, and road conditions. The system effectively detects potential risks and helps mitigate the frequency and impact of accidents. The primary goal is to ensure the safety of drivers and vehicles. Collecting data involved gathering information on three key road events: normal street and normal drive, speed bumps, circular yellow speed bumps, and three aggressive driving actions: sudden start, sudden stop, and sudden entry. The gathered data is processed and analyzed using a machine learning system designed for limited power and memory devices. The developed system resulted in 91.9% accuracy, 93.6% precision, and 92% recall. The achieved inference time on an Arduino Nano 33 BLE Sense with a 32-bit CPU running at 64 MHz is 34 ms and requires 2.6 kB peak RAM and 139.9 kB program flash memory, making it suitable for resource-constrained embedded systems.
Presentation of IEEE Slovenia CIS (Computational Intelligence Society) Chapte...University of Maribor
Slides from talk presenting:
Aleš Zamuda: Presentation of IEEE Slovenia CIS (Computational Intelligence Society) Chapter and Networking.
Presentation at IcETRAN 2024 session:
"Inter-Society Networking Panel GRSS/MTT-S/CIS
Panel Session: Promoting Connection and Cooperation"
IEEE Slovenia GRSS
IEEE Serbia and Montenegro MTT-S
IEEE Slovenia CIS
11TH INTERNATIONAL CONFERENCE ON ELECTRICAL, ELECTRONIC AND COMPUTING ENGINEERING
3-6 June 2024, Niš, Serbia
Understanding Inductive Bias in Machine LearningSUTEJAS
This presentation explores the concept of inductive bias in machine learning. It explains how algorithms come with built-in assumptions and preferences that guide the learning process. You'll learn about the different types of inductive bias and how they can impact the performance and generalizability of machine learning models.
The presentation also covers the positive and negative aspects of inductive bias, along with strategies for mitigating potential drawbacks. We'll explore examples of how bias manifests in algorithms like neural networks and decision trees.
By understanding inductive bias, you can gain valuable insights into how machine learning models work and make informed decisions when building and deploying them.
Introduction- e - waste – definition - sources of e-waste– hazardous substances in e-waste - effects of e-waste on environment and human health- need for e-waste management– e-waste handling rules - waste minimization techniques for managing e-waste – recycling of e-waste - disposal treatment methods of e- waste – mechanism of extraction of precious metal from leaching solution-global Scenario of E-waste – E-waste in India- case studies.
Low power architecture of logic gates using adiabatic techniquesnooriasukmaningtyas
The growing significance of portable systems to limit power consumption in ultra-large-scale-integration chips of very high density, has recently led to rapid and inventive progresses in low-power design. The most effective technique is adiabatic logic circuit design in energy-efficient hardware. This paper presents two adiabatic approaches for the design of low power circuits, modified positive feedback adiabatic logic (modified PFAL) and the other is direct current diode based positive feedback adiabatic logic (DC-DB PFAL). Logic gates are the preliminary components in any digital circuit design. By improving the performance of basic gates, one can improvise the whole system performance. In this paper proposed circuit design of the low power architecture of OR/NOR, AND/NAND, and XOR/XNOR gates are presented using the said approaches and their results are analyzed for powerdissipation, delay, power-delay-product and rise time and compared with the other adiabatic techniques along with the conventional complementary metal oxide semiconductor (CMOS) designs reported in the literature. It has been found that the designs with DC-DB PFAL technique outperform with the percentage improvement of 65% for NOR gate and 7% for NAND gate and 34% for XNOR gate over the modified PFAL techniques at 10 MHz respectively.
6th International Conference on Machine Learning & Applications (CMLA 2024)ClaraZara1
6th International Conference on Machine Learning & Applications (CMLA 2024) will provide an excellent international forum for sharing knowledge and results in theory, methodology and applications of on Machine Learning & Applications.
Technical Drawings introduction to drawing of prisms
Bulletin 36 autumn 2014
1. Title
Ed
Issue 36 / Autumn 2014
Plaxis Bulletin
Validating a new design method for piled embankments with PLAXIS 2D and 3D
3D Modelling of Train Induced Moving Loads on an Embankment
Preliminary 3D Modelling of Structural Behaviour of Face Bolting
and Umbrella Arch in Tunneling
2. Page16
Table of contents
Page4Page6Page10
Colophon
Any correspondence regarding the Plaxis
Bulletin can be sent by e-mail to:
bulletin@plaxis.com
or by regular mail to:
Plaxis Bulletin
c/o Annelies Vogelezang
PO Box 572
2600 AN Delft
The Netherlands
The Plaxis Bulletin is a publication of
Plaxis bv and is distributed worldwide among
Plaxis subscribers
Editorial board:
Ronald Brinkgreve
Erwin Beernink
Martin de Kant
Arny Lengkeek
Design:
Judi Godvliet
For information about PLAXIS software contact
your local agent or Plaxis main office:
Plaxis bv
P.O. Box 572
2600 AN Delft
The Netherlands
info@plaxis.com
www.plaxis.com
Tel: +31 (0)15 251 7720
Fax: +31 (0)15 257 3107
»The Plaxis Bulletin is the combined
magazine of Plaxis bv and the Plaxis users
association (NL). The bulletin focuses on the use
of the finite element method in geotechnical
engineering practise and includes articles on the
practical application of the PLAXIS programs,
case studies and backgrounds on the models
implemented in PLAXIS.
The bulletin offers a platform where users of
PLAXIS can share ideas and experiences with
each other. The editors welcome submission of
papers for the Plaxis bulletin that fall in any of
these categories.
The manuscript should preferably be submitted
in an electronic format, formatted as plain text
without formatting. It should include the title
of the paper, the name(s) of the authors and
contact information (preferably e-mail) for the
corresponding author(s). The main body of
the article should be divided into appropriate
sections and, if necessary, subsections. If any
references are used, they should be listed at the
end of the article.
The author should ensure that the article is
written clearly for ease of reading.
In case figures are used in the text, it should
be indicated where they should be placed
approximately in the text. The figures themselves
have to be supplied separately from the text in
a vector based format (eps,ai). If photographs
or ‘scanned’ figures are used the author should
ensure that they have a resolution of at least 300
dpi or a minimum of 3 mega pixels. The use of
colour in figures and photographs is encouraged,
as the Plaxis bulletin is printed in full-colour.
Editorial03
New developments04
Recent activities22
3D Modelling of Train
Induced Moving Loads on an
Embankment
10
Validating a new design method
for piled embankments with
PLAXIS 2D and 3D
06
PLAXIS Expert Services update05
Preliminary 3D Modelling of
Structural behaviour of Face
Bolting and Umbrella Arch in
Tunneling
16
Upcoming events24
Page22
3. www.plaxis.com l Autumn issue 2014 l Plaxis Bulletin 3
»We are pleased to present you the new
edition of the PLAXIS bulletin, including
three very diverse user articles. With the PLAXIS
2D AE release behind us and its positive reception
by our user base, we have since then focused our
efforts back into developing new features for the
upcoming 3D and 2D releases. We are proud to
already reveal a snippet in this Autumn edition,
which brings us closer to another milestone in the
long history of Plaxis.
The New Developments column focuses on the
new Thermal module which is due for release
in 2015. With the gradual change of the climate
felt worldwide, engineers come across new
geotechnical challenges like buildings founded
on now thawing permafrost, which they seek to
take into account in their modelling. The Thermal
module will fulfill their needs and will also open
possibilities for some of the more conventional
applications like modelling soil freezing or
temperature effects of buried pipelines. With the
new module we meet our customers’ demands to
perform these types of analyses with the PLAXIS
program, with the user friendliness that you have
come to know.
The first user’s article discusses the validation for
a new design method for piled embankments in
PLAXIS 2D and 3D. The article expands on earlier
works, where a proposed concentric arches model
is validated via finite element analyses against
earlier measurements from laboratory scaled
test and field tests. New insights into previously
uncertain factors led to an improved match
between model and measurements.
In the second user’s contribution, work on 3D
modelling of train induced moving loads on an
embankment is presented. The authors propose
a method on how to model dynamic loads
simulating high-speed trains, which pass over the
embankment. Furthermore different constitutive
models were used to approximate and compare
the dynamic behaviour of the embankment.
The authors comment that with more details in the
load system, PLAXIS 3D can successfully model
interaction between two trains. In the future Plaxis will
add facilities to ease the modelling of moving loads.
The third user’s article describes preliminary 3D
modelling of structural behaviour of face bolting
and umbrella arch in tunneling. Through parametric
studies on a base model for the South tube of the
Toulon tunnel in France, the author investigates
and discusses the effects of face bolting density
on surface settlements and on tunnel face
displacements. In a second study the effect of the
density of the umbrella arch on surface settlements
is investigated, finding agreement with an earlier
study on the Toulon tunnel.
For the Expert Services update, we review an
In-house training that Plaxis delivered in the USA,
where the customer required a broad education
on the PLAXIS 2D and 3D programs and a day
entirely focused on their needs with respect to
Dynamic analysis.
In our recent activities section we look back at some
of the events that our Asiapac and Americas offices
hosted or attended, and we touch upon the joint-
venture between NGI and Plaxis: XG-Geotools.
For our worldwide presence on events or hosted
courses we refer you to the upcoming events on
the backside of the bulletin.
We hope to have created another interesting
reading for our readers and we look forward to
receiving your comments on the autumn 2014
edition of the bulletin
The Editors
Editorial
4. 4 Plaxis Bulletin l Autumn issue 2014 l www.plaxis.com
New Developments
»Before considering the details of this new
PLAXIS module, let’s first consider some
particular applications that require thermal
analysis or THM coupling:
• Calculating strut forces and wall forces as a
result of thermal expansion of the strut (due to
sunlight absorption and temperature changes)
in excavation projects.
• Calculating the forces on walls and other
structures in the ground as a result of (cyclic)
movements due to daily temperature changes.
• Calculating the temperature distribution around
freeze pipes in excavation projects involving
ground freezing.
• Calculating ground movement and stability
considering thermal expansion of underground
pipelines.
• Calculate the influence of a changing climate on
the temperature distribution in the ground (for
example in permafrost areas) to evaluate the
corresponding change of soil properties.
• Calculate the efficiency and sustainability of
borehole heat exchangers in aquifer layers.
• Calculate the change of temperature in the
underground as a result of nuclear waste
storage.
Several of such applications are driven by societal
issues (global warming, renewable energy, care
for the environment). The fact is that more and
more PLAXIS users are working on such projects
and therefore require thermal calculation
capabilities in the software. The new 2D module
involves thermal conduction, diffusion and
convection in the soil mass as well as advection
with groundwater flow. The latter may also lead to
density flows due to differences in groundwater
temperature. Also air-soil interaction at the ground
surface is included, as well as thermal conduction
in structural elements and thermal insulation in
interface elements.
Just like Plaxflow, the Thermal module will be fully
integrated with the existing PLAXIS user-interface.
Thermal properties are added to material data
sets, and thermal boundary conditions and cluster-
related conditions are added to the geometry;
all in the same manner as for groundwater flow
calculations. In the calculations window, you
can specify whether or not you want to consider
temperature. If so, the initial temperature
distribution can easily be defined based on the
earth’s gradient.
In subsequent calculations you can adopt the
temperature distribution from the previous phase,
or define a new steady-state condition for the
current phase, or define a fully coupled transient
analysis. The latter also allows for functions
for temperature or heat flux to be defined in
the attributes library and assigned to certain
boundaries; again, very similar as the definition of
groundwater flow functions.
Although the Thermal module will first be released
as a 2D module only, we are confident to provide
many users with thermal calculation facilities that
are very useful in several applications. We are
looking forward to welcome you as a user of this
new module as of the first quarter of 2015, and we
are very interested to receive your feedback.
In addition to the facilities for rock engineering, as mentioned in the previous Bulletin, PLAXIS is now coming with new facilities
for thermal analysis and thermo-hydro-mechanical (THM) coupling. This major extension will again broaden the range of
applications in civil, environmental, energy, mining and polar engineering. The first release of the Thermal module will become
available with the new 2D 2015 version.
Ronald Brinkgreve, Plaxis bv
Figure 1: Temperature distribution around a nuclear waste
canister after 100 days
5. www.plaxis.com l Autumn issue 2014 l Plaxis Bulletin 5
»The group of geotechnical engineers to be
trained at Hart Crowser Inc. consisted of 3
different levels of engineers:
1. Principle engineers, responsible for project
acquisition and marketing;
2. Associate engineers, responsible for project
management and project review;
3. Geotechnical engineers, responsible for Plaxis
calculations.
The purpose of the training was to provide the
different attendees with the specific knowledge
for their daily work. In consultation with the Client
a stepwise approach was chosen.
The first part of the training concentrated on the
Principle engineers and explained the basics of
Finite Element (FE) modelling with Plaxis 2D and
3D. With this knowledge the Principle engineers
are better able to judge when the use of a Plaxis
model in a project is suitable.
The second part concentrated on the Associate
engineers and explained more theoretical aspects
of FE modelling and also a number of hands on
exercises were made. Finally some important
aspects of FE model review were discussed. With
this knowledge the Associate engineers are better
able to review the Plaxis models set up for their
projects.
The third part was only for the level 3 Geotechnical
engineers who work with Plaxis on a regular basis
and focused in detail on working with PLAXIS 3D
and dynamic modelling with PLAXIS 2D.
Hart Crowser Inc. requested Plaxis to provide an In-House training for their geotechnical engineers at their Seattle office.
The group of geotechnical engineers to be trained consisted of different levels of engineers. In close consultation with Hart
Crowser Inc. a fit for purpose 4 day training was organized meeting the specific needs of the participants.
Brice Exley, Geotechnical engineer, Hart Crowser, Seattle USA
PLAXIS Expert Services update
With this knowledge the engineers are better able
to set up and run their Plaxis models.
Course schedule
First day, part 1 (level 1, 2 and 3 engineers):
• Introduction to PLAXIS 2D and 3D
• Possibilities and limitations of PLAXIS 2D and 3D
• Demonstration of 2D and 3D models
First day, part 2 (level 2 and 3 engineers):
• Background of the MC and HS(small) model
• Exercise: simulation with SoilTest
Second day (level 2 and 3 engineers):
• Focus on excavations and embankments with a.o.:
• Background and modelling of undrained behavior
• Exercise: modelling tied-back excavation with
MC and HS model
• Important aspects of FE model review
Third day (level 3 engineers):
• Focus on modelling using PLAXIS 3D, with a.o.:
• Tips on modelling and meshing in Plaxis 3D
• Exercise: Piled raft foundation
• Discussion on common modelling problems
Fourth day (level 3 engineers):
• Focus on dynamic analysis using Plaxis 2D, with a.o.:
• Modelling liquefaction using the UBCsand model
• Exercise: Quay wall in Kobe
Customer quotes
“Plaxis worked with us to create a unique training
schedule that allowed us to maximize the time
spent in training. The trainer was excellent and
was comfortable working with some of the unusual
problems we proposed to him.”
-Brice Exley, Hart Crowser, Inc. 2014
About Hart Crowser Inc.
Founded in 1974, Hart Crowser is a 110-person
consulting firm specializing in natural resources,
environmental, and geotechnical services.
The firm’s offices are in Seattle (headquarters),
Edmonds, and Vancouver, Washington, and
Portland, Oregon, and Honolulu, Hawaii. Hart
Crowser has been the geotechnical engineer of
record on signficant projects including the world’s
longest floating bridge, largest diameter bored
tunnel, and many deep excavations.
6. 6 Plaxis Bulletin l Autumn issue 2014 l www.plaxis.com
included two steps of validation. First, a numerical
model was designed and its results compared to field
and laboratory measurements. Then, the numerical
model was used for a parameter variation study to
validate the Concentric Arches model. This was done
by comparing the numerical results to predictions
of the Concentric Arches model as well as two other
models that are currently in use. The Zaeske (2001)
model is used in guidelines in Germany and the
Netherlands and the Hewlett & Randolph (1988)
model is used in guidelines in the UK and France.
Definitions of arching and load distribution
Figure 1 shows a basal reinforced piled
embankment: piles surrounded by soft subsoil,
overlain by a geosynthetic grid, on which the
embankment fill is placed. Because of the friction
within the fill, the piles do not only carry the weight
of the soil directly on top of them, but also part of
the load above the field between the piles. This
effect, called arching, is increased by the use of a GR.
Furthermore, the GR itself transfers load to the pile.
Three load parts are defined as shown in Figure
1, each in kN/pile. Load part A is the part that is
directly transferred to the piles by arching (this load
part increases when using a GR). The residual load
is partly redirected to the piles by the GR (load part
B) and partly carried by the subsoil (load part C).
When designing piled embankments, the (relative)
amount of arching, A% = A / (A+B+C) needs to be
determined. This is the objective of the Concentric
Arches model or other arching models.
Lessons learned
As described before, the validation of the
Concentric Arches model was done in two steps.
The first step was to create a numerical model
with results that are similar to measurements.
These measurements were drawn from scaled
laboratory tests (Van Eekelen et al., 2012a and
2012b) and full-scale field tests (Van Eekelen et
al., 2012c). The laboratory test was modelled first.
It became clear that the test set-up included a
number of complexities that greatly influenced the
performance of the numerical model.
Validating a new design method for piled
embankments with PLAXIS 2D and 3D
»In September 2013, Van Eekelen et al.
published a new design model for basal
reinforced piled embankments. This Concentric
Arches model specifically focusses on determining
the load distribution within the embankment.
Additional to the validation given in the publication
itself, numerical calculations were used to determine
the validity of the Concentric Arches model. This was
done within the MSc thesis of Van der Peet (2014), also
reported in Van der Peet and Van Eekelen (2014) and
Infrastructural projects such as roads and railway tracks are usually built on an embankment of sand or granular material.
When building on soft soils, the prevention of differential settlements and resulting damage is traditionally done by including
a long settlement period in the construction process. One method to decrease construction time is to use a pile foundation
beneath the embankment. If a geosynthetic reinforcement (GR) is used in the base of the embankment, the construction is
called a basal reinforced piled embankment.
T.C. van der Peet, Witteveen + Bos consulting engineers - P.G. van Duijnen, Huesker Synthetic BV - S.J.M. van Eekelen, Deltares
Figure 2: Geometry of the 3D basic modelFigure 1: Load distribution in a basal reinforced piled embankment
7. www.plaxis.com l Autumn issue 2014 l Plaxis Bulletin 7
The soft subsoil is modelled using the Mohr-
Coulomb (MC) model. The embankment fill,
consisting of crushed granular material,
is modelled by the hardening soil (HS) model,
using the drainage type Drained. The fill property
set is copied with Rinter
set to 1.0, to be used
specifically for the interface extensions of the
subsoil-beam interfaces. The geogrid is modelled
as a Linear-Elastic material. In 2D, the material is
isotropic, using axial stiffnesses EA1 = EA2 = 1500
kN/m, which is a stiffness for long term loading
and strains usual in practice. In 3D however, in
order to correctly model the biaxial material
behaviour, the stiffness is set to anisotropic and
the stiffness in shear loading, GA, is set to zero.
Construction was modelled in four phases aside
from the initial phase, which are summarized in
Table 2. In phase 2, when the embankment is built
Some of these issues could not be solved within
the limited time available. Other issues were
solved and led to a model that produced similar
results as the field test measurements. The solved
issues are:
• In practice, a sand layer is often placed between
the piles and the GR. In the numerical model,
punching failure occurs in this layer at the edges
of the piles. This punching failure can be pre-
vented by modelling the sand layer as a linear-
elastic material with low stiffness. By using a
Poisson’s ratio ν close to 0.5, the stiffness of the
layer as a whole is included. However, the actual
modelled stiffness cannot straightforwardly be
compared to measured parameters. Therefore,
in the final model of the field test, the sand layer
was removed.
• To correctly model the friction between the
GR and the surrounding soils, interfaces were
added around the GR. Because the linear-
elastic material of the piles cannot behave
plastically, slip of the GR over the piles is very
small. This slip reaches more realistic values if a
separate material set is used for the interface.
This material set uses the Mohr-Coulomb model
with low strength parameters. The stiffness is
kept high, to prevent overlap of the GR over the
piles or sand layer.
• When subsoil with low stiffness is used, the wa-
ter inside has an unrealistic low stiffness, lead-
ing to unrealistically low water overpressures
for undrained conditions. By increasing the
Skempton-B parameter of the subsoil the ratio
between the stiffness of the soil and the water
can be increased so that the water overpressure
matches measurements.
Description of numerical models
Using the lessons learned above, a numerical
model was set up that gives acceptably similar
results to the field measurements, both in PLAXIS
2D (2012) and PLAXIS 3D (2012.02). Its geometry
incorporates two fields. After slight adaption of
embankment height and material parameters,
the basic geometry of the 3D model, as shown
in Figure 2, uses a pile width b = 0.75 m and a
centre-to-centre distance sx
= sy
= 2.25 m. The
embankment height was chosen H = 2.0 m, the
subsoil height Hsub
= 1.0 m and the top load
p = 5.0 kN/m2
. These are realistic values in
practice. In the 2D model, the piles in y-direction
were combined into beams using the same
parameters. All boundary conditions are standard
conditions (bottom fixed in all directions, sides
fixed in lateral direction). Vertical interfaces were
added between the beams/piles and the subsoil,
including an extension of 0.10 meter up into the
embankment fill. Horizontal interfaces were used
around the GR, both above towards the fill and
below towards the beams/piles and the subsoil.
The constitutive models and their parameters are
given in Table 1. The piles are modelled as a linear
elastic (LE) and Non-porous material.
Unit
Piles
(LE)
Subsoil
(MC)
Fill
(HS)
Interface
Extension
(HS)
Interface
GR-Piles
(MC)
γdry
kN/m3
15 18 17 17 15
γwet
kN/m3
- 20 19 19 15
E(50)
kN/m2
25x106
500 80x103
80x103
25x106
Eoed
kN/m2
- - 60x103
60x103
-
Eur
kN/m2
- - 210x103
210x103
-
m - - - 0.5 0.5 -
ν(ur)
- 0.0 0.2 0.2 0.2 0.0
c kN/m2
- 5 1 1 1
ϕ ° - 10 45 45 10
ψ ° - 0 15 15 0
pref
kN/m2
- - 100 100 -
K0
nc
- - - 0.2929 0.2929 -
Rinter
- 1.0 0.6 0.8 1.0 1.0
Table 1: Soil material sets in the basic models
8. 8 Plaxis Bulletin l Autumn issue 2014 l www.plaxis.com
No. Phase name Type Activated geometry
0 Initial phase K0 procedure Subsoil
1 Pile installation Plastic (UM) Beams, Subsoil
2 Embankment constr. Plastic (UM) Beams, Subsoil, GR, Embankment
3 Top load Plastic (UM) Beams, Subsoil, GR, Embankment, Top load 5.0 kPa
4 No subsoil support Plastic (UM) Beams, GR, Embankment, Top load
Basic model GR Stiffness Height Friction angle Top load
Hewlett & Randolph × ∨ × × ×
Zaeske ∨ ∨ ∨ × ×
Concentric Arches ∨ ∨ ∨ ∨ ×
Validating a new design method for piled embankments with PLAXIS 2D and 3D
by activating the GR and fill, the displacements are
set to zero. In the last phase (Phase 4), the subsoil
cluster is turned off to simulate a situation where
subsoil support is lost. This is realistic when a
sand layer is included between the piles and the
GR, which makes the subsoil settle below the GR
leaving a gap from which no support is possible.
All calculation phases (not counting the initial
situation) use a plastic drained analysis, which
means the effect of consolidation is not included,
but only the final situation of equilibrium. It is
necessary to account for large deformation effects,
so the updated mesh (UM) option is turned on.
During the parameter variation study, the basic
model was adapted one parameter at a time.
The parameters included in this study were the
GR stiffness EA1 and EA2, the top load p, the fill’s
friction angle ϕ and the embankment height H.
Interpreting the results
The arching models under consideration are
limit state models, attempting to find the lightest
construction that will remain stable. This implies
that throughout the (arches of the) models the
ultimate limit state (ULS) is reached and the full
strength profile of the embankment has been
mobilised. This can be analysed using the relative
shear stress output of PLAXIS. In both 2D and 3D,
the last phase, without subsoil support, results
in a relative shear value of 1.0 throughout the
embankment.
This means the shear strength is fully mobilized
and ULS has been reached. In the earlier stages
however, ULS is not reached, not even when the
top load is increased to unrealistically high values.
Therefore, only the last phase is comparable to the
results of the analytical models.
Van der Peet (2014) and Van der Peet and Van
Eekelen (2014) extensively analysed different
aspects of the numerical results, such as the shape
of the arches, the stress distribution above the GR
(Figure 3), the deflection of the GR and the load
distribution over arching (A), GR (B) and subsoil
(C). In the 3D model, the analysis of the shape of
the arches and GR deflection was done for three
separate areas, see Figure 4, to include 3D effects.
The principal stress directions output of Plaxis was
used to determine the arch shape (Figure 5 and
figure 6). For the 2D model, the distribution of the
load (over A, B and C) could be analysed using
the forces view option of the Output program.
However, more accurate results were acquired
by integrating the closest stress points over the
surface under consideration. This is a method that
can be extended to the 3D situation as well.
The stress points used were selected using their
material type and location. This introduces a slight
inaccuracy because the updated mesh analysis
results in coordinate values for the stress points
that change each phase. The stresses in the stress
points under consideration were then averaged
using a weighing factor equal to the volume of the
stress point’s element.
By creating a thin soil layer both above and below
the GR, the elements are enforced to have similar
heights. Therefore, this method should closely
approximate the exact result. An overview of
the results of the analysis of the basic model and
parameter study can be found in table 3. These
results are presented extensively in Van der Peet
and Van Eekelen (2014).
Figure 3: Vertical stress distribution on GR resulting from numerical calculations
and analytical models
Table 2: Calculation phases in the basic models
Table 3: Results of the analysis of the basic model and parameter study
9. www.plaxis.com l Autumn issue 2014 l Plaxis Bulletin 9
Validating a new design method for piled embankments with PLAXIS 2D and 3D
Conclusions
The numerical calculations and the predictions
of the Concentric Arches method show strong
similarities, both in shape of the arches and the
amount of arching A%. Especially for higher top
loads and when the influence of the fill’s friction
angle is of importance, the Concentric Arches
model performs better than the other analytical
models under consideration.
References
• Hewlett, W.J., Randolph, M.F., 1988. Analysis of
piled embankments. Ground Engineering, April
1988, Volume 21, Number 3, 12-18
• Van der Peet, T.C., 2014. Arching in basal
reinforced piled embankments, numerical
validation of the Concentric Arches model.
Figure 4: Three separate areas for analysis of the 3D model
MSc thesis, Delft University of Technology,
Delft, the Netherlands.
• Van der Peet, T.C. and Van Eekelen, S.J.M.,
2014. 3D numerical analysis of basal reinforced
piled embankments. Proceedings of 10ICG,
September 2014, Berlin, Germany.
• Van Eekelen, S. J. M., Bezuijen, A., Lodder, H.
J. and Van Tol, A. F., 2012a. Model experiments
on piled embankments. Part I. Geotextiles and
Geomembranes, 32, pp. 69-81.
• Van Eekelen, S. J. M., Bezuijen, A., Lodder, H.
J. and Van Tol, A. F., 2012b. Model experiments
on piled embankments. Part II. Geotextiles and
Geomembranes, 32, pp. 82-94.
• Van Eekelen, S. J. M., Bezuijen, A. and Van
Duijnen, P. G., 2012c. Does a piled embankment
‘feel’ the passage of a heavy truck?
Field measurements. Proceedings of the 5th
European Geosynthetics Congress EuroGeo 5,
Valencia. pp. 162-166.
• Van Eekelen, S.J.M., Bezuijen, A. and Van
Tol, A.F., 2013. An analytical model for piled
embankments. Geotextiles and Geomembranes
39, pp. 78-102.
• Zaeske, D., Zur Wirkungsweise von
unbewehrten und bewehrten mineralischen
Tragschichten über pfahlartigen Gründungsel-
ementen. Schriftenreihe Geotechnik, Uni
Kassel, Heft 10, February 2001 (in German).
Figure 5 Principal stress directions between two neighbouring piles
(cross-section 1) after ULS is reached
Figure 6: Principal stress directions between two diagonally neighbouring piles (cross-
section 2) after ULS is reached
10. 10 Plaxis Bulletin l Autumn issue 2014 l www.plaxis.com
»In terms of structural dynamics, a moving
load changes its place during the time and
compared to a static load, it can significantly
increase displacements in the structure. Moreover,
it causes different soil behavior, which has not
been fully investigated so far. The dynamic
deformation that is caused by trains is normally
inelastic. The cumulative plastic dAeformations
during track’s lifetime increase progressively and
its amount depends on several factors, among
them on the subsoil parameters. Irregularities in
the track level are common phenomena due to
the spatial variation of subsoil and, to some extent
the embankment. This degradation of the track is
known as differential track settlement [1].
High train speeds demand smaller differential
settlement, which must be considered in the
modelling of the rail-embankment-subsoil-system
by reducing the model error. Another important
problem to address is that, after a critical speed,
great dynamic amplification appears in the dynamic
response of the system, which shows again the
importance of the modelling to detect this critical
speed of the rail-embankment-subsoil-system [2].
Due to the importance of the moving and dynamic
loads, several studies deal with this problem,
especially for high-speed railway trains [3, 4].
Increasing traffic intensity and train speed in modern railway tracks require complex analysis with focus on
dynamic soil behavior. Proper modelling of the dynamic behavior of the railway track system (railway track,
trainload, embankment materials and subsoil) is essential to obtain realistic results. This paper presents preliminary
results of numerical modelling in PLAXIS 3D for simulating moving loads on a typical soil embankment, which is
designed for high-speed railway trains. For this purpose, several static point loads were applied along the railway
track. The amount of load is equal to the axle load of the train. For each point load, a dynamic multiplier is assigned
as a time-shear force signal. A beam under unit loads on the elastic foundation was modeled for calculation of
shear forces. The resulting shear forces in the beam were applied to the 3D model as factors of the dynamic
multiplier. In addition, different constitutive soil models such as Linear Elastic (LE), Mohr-Coulomb (MC) and
Hardening Soil small-strain (HS-small) were used to approximate the dynamic behavior of the soil embankment.
3D Modelling of Train Induced Moving Loads on an Embankment
M.Sc. Mojtaba Shahraki, Bauhaus-Universität Weimar, mojtaba.shahraki@uni-weimar.de - M.Sc. M.Sc. Mohamad Reza Salehi Sadaghiani, Bauhaus-Universität Weimar,
mohamad.salehi@uni-weimar.de - Prof. Dr.-Ing Karl Josef Witt, Bauhaus-Universität Weimar, kj.witt@uni-weimar.de - Dr.-Ing Thomas Meier, Baugrund Dresden
Ingenieurgesellschaft mbH, meier@baugrund-dresden.de
To consider the effect of the moving loads,
the authors have statically analyzed the beam
to approximate the length of the shear force
distribution in the rail and then those distances
are taken into account to extend the length of
the model. To estimate shear forces in the rail, a
static analysis based on the theory of ‘beam on
the elastic foundation’ has been computed by
using PROKON (Structural Analysis and Design
software). PROKON performs a linear analysis in
which the beam is modeled as a 2D frame on a
series of springs with very short distances [8]. The
shear forces that were obtained from this analysis
have been used as the dynamic multipliers for
each point load in PLAXIS 3D.
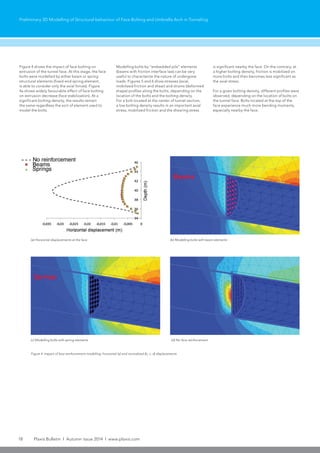
It has been assumed that the distance between
two supports are too small and contacted
support along the beam has been provided by
the underlying soil. Furthermore, the beam is
significantly thin; hence, the external loads are
transferred to the support directly (See Figure 1).
The length of the train axles ‘L’ controls the length
of the model. Moreover, this length has been
extended ‘0.18L’ on both sides of the beam for
considering the effect of the shear force on the
adjacent parts of the impact points of the loads.
In case of the numerical simulation, Vogel et al.
(2011) carried out a study about dynamic stability
of railway tracks on soft soils. They have modeled
a train railway embankment in PLAXIS 2D and
the numerical results have been compared to
experimental data [5]. Correia et al. (2007) also
accomplished a preliminary study of comparative
suitability of 2D modelling with different numerical
tools such as PLAXIS 2D and other finite element
software [6]. In recent studies, the effect of the third
dimension is considered by some assumptions, for
example, Yang and Hung (2001) suggested a so
called 2.5 D model for moving loads [7].
The reliability of the models depends largely on
the accuracy of the model, the input data and the
choice of an appropriate underlying theory. In
this respect, the presented results are based on
3D modelling and a first contribution to provide a
method for modelling of moving loads.
Simulation Approach
The moving-loads-induced reactions at the track
differ significantly depending on trainloads and
speed. When the loads travel on a beam, they
do not affect only under the impact points; these
loads have also effect on the adjacent parts (away
from the impact points of the loads) of the beam.
11. www.plaxis.com l Autumn issue 2014 l Plaxis Bulletin 11
It has been supposed that the dynamic loads have
effect over a greater length of the beam than static
loads, and the effect of each axle is felt further away,
hence, another length of ‘0.12L’ is added to each
side of the beam, to consider the dynamic impact
of the loads. Therefore, the optimal length of model
could be suggested as ‘Lm
=L+2(0.12+0.18)L’
(see Table 1).
To approximate the shear forces in a standard
railway track, a beam with length ‘Lm
’ and pin
supports in every 60 cm (a = 60) laying on soil
was considered. A dynamic multiplier is defined
as a time-shear force signal in PLAXIS 3D. In the
model, every single dynamic point load has its own
multiplier. In other words, the dynamic point load
is multiplied with the value of signal in every time
step. These load multipliers represent the shear
forces in the beam due to the static load along the
rail in the specific time. The time interval of the
multiplier signal has to be considered sufficiently
small to prevent miscalculation in FE simulations.
The time step is constant because the train speed
and the distance between dynamic point loads
are constant. For example, a train with speed 180
km/h passes every 30 cm in 0.006 sec, hence, the
time interval must be chosen 0.006 sec for the
fixed dynamic point loads [9].
The dynamic point loads are located in distances
of ‘a/2’, to consider the maximum shear forces in
the middle of the spans. The distance between the
dynamic point loads can be reduced to minimize
the model error; but it increases the calculation
time. A total number of ‘4(Lm
/a)’ dynamic point
loads for two rails are defined (Figure 2 & Table 1).
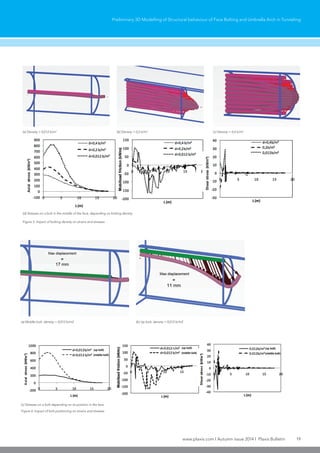
Example
In Figure 2 and Table 1 the relevant information for
the model can be found. In the example simulation,
the train speed is 180 km/h, and the distance
between each dynamic point load is 30 cm. The
train passes every 30 cm in 0.006 sec (time step).
Consequently, the first axle of the train needs 0.702
sec to pass all 117 dynamic point loads.
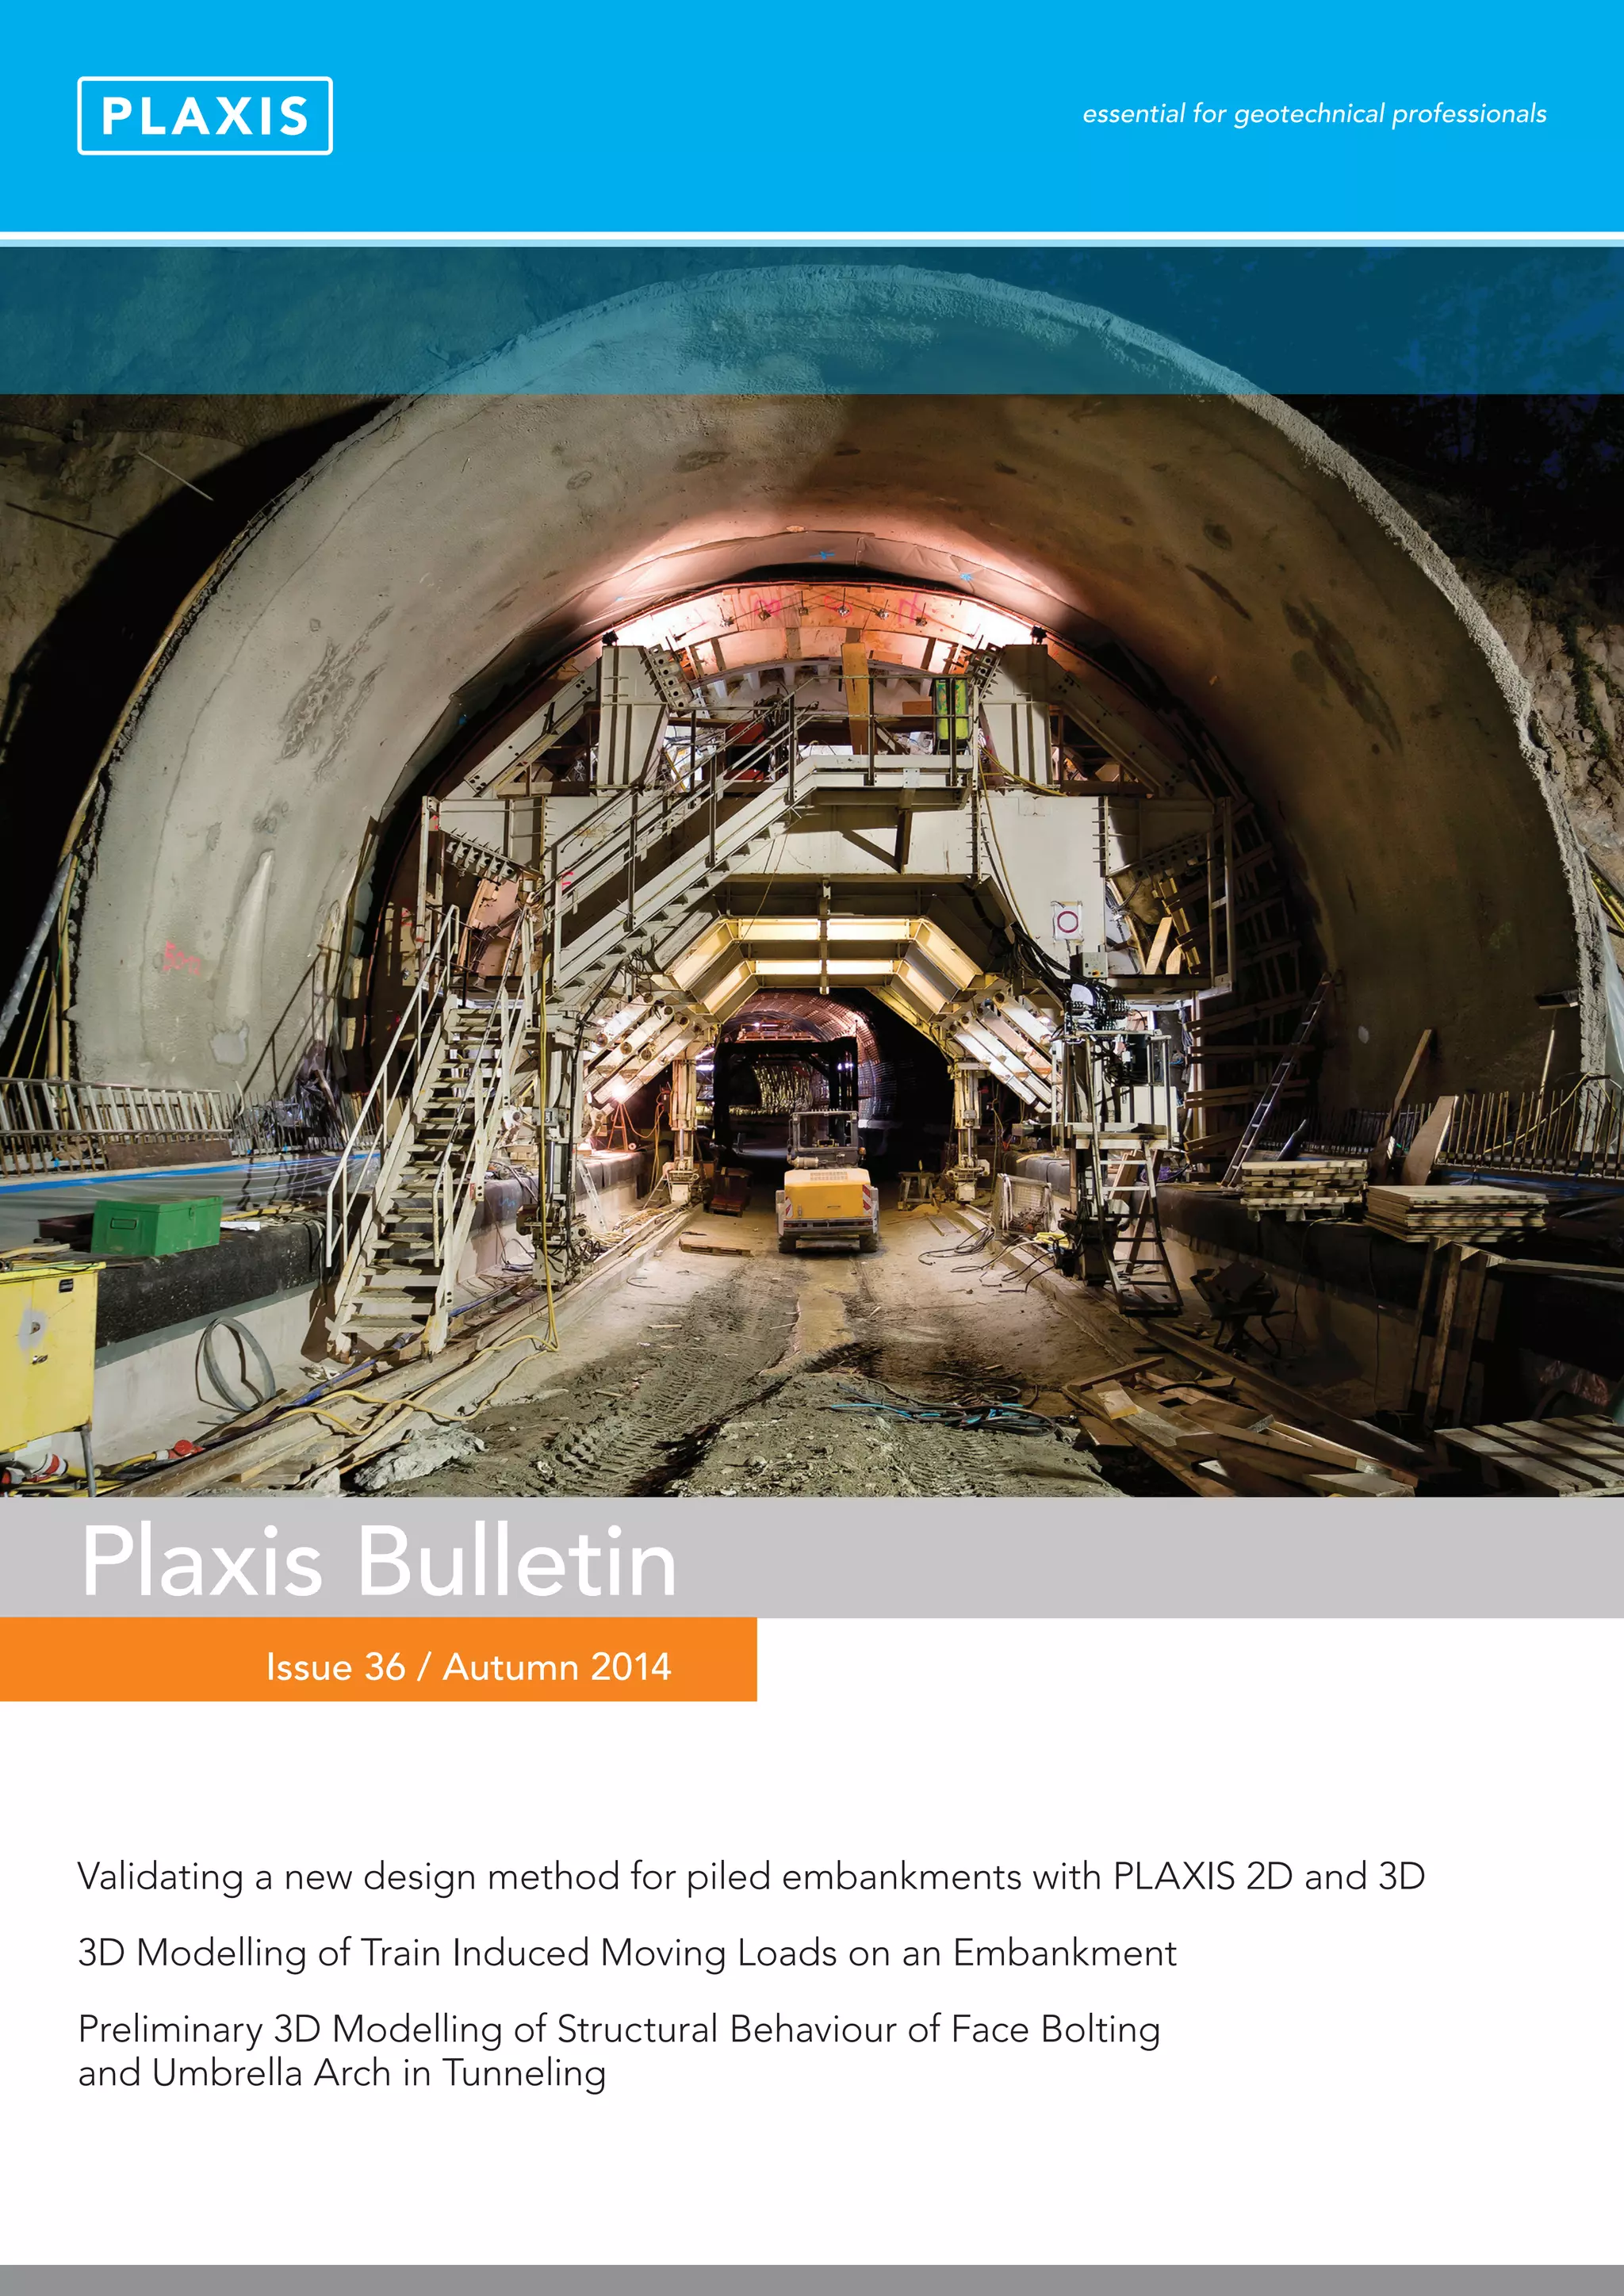
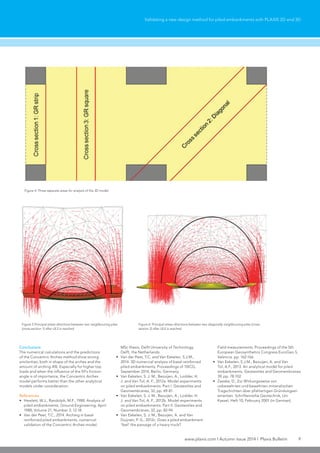
Figure 1: Theory and assumption
Table 1: Model parameters for modelling the moving loads
Distance between the first and the last wagon axles [m] L 21.7
Additional length for model [m] La
= 0.3L 6.5
Total additional length (right and left) [m] La,total
= 2*0.3L 13.0
Model length [m] Lm
=L+0.6L 34.7
Sleepers distance [m] a 0.6
Dynamic loads distance [m] a/2 0.3
Number of dynamic loads for one rail [-] (2Lm
)/a 117
Number of dynamic loads for whole model (two rails) [-] (4Lm
)/a 234
Figure 2: Dimensions of an ICE train and calculated lengths for model
12. 12 Plaxis Bulletin l Autumn issue 2014 l www.plaxis.com
3D Modelling of Train Induced Moving Loads on an Embankment
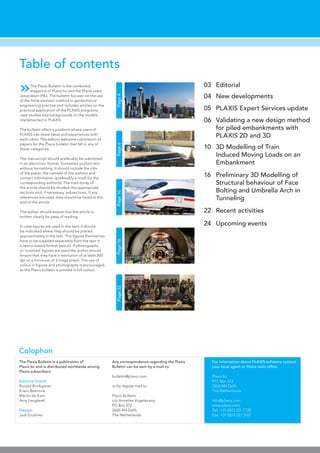
value used for K. Figure 5 illustrates the calculated
shear force in the beam. The length of the model
in PROKON was rescaled to the model length used
in the PLAXIS model.
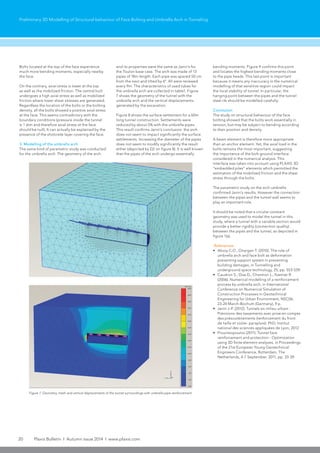
Geometry of 3D-model
The length of the model for X and Y direction is 35
meters. Due to the geological conditions a model
with the depth of 11 m has been considered.
Standard fixities and absorbent boundaries were
applied in the model to reduce wave reflection at
the boundaries. A typical railway track includes
rails, rail clips (rail fastening system), and sleepers
while all these track elements rest on ballast and
subsoil with different soil layers.
The rail is modeled with a beam element along 35
m of profile in Y direction with rectangular cross
section. The properties of the beam section are
considered in such a way that it has the same
properties as a rail (UIC 60). The rail clips are
modeled as node to node anchor elements. Each
of the sleepers is connected to the rail with two rail
clips with 30 cm thickness. The standard sleeper
B70 is modeled as a beam element by providing
the moment of inertia and area. 68 sleepers
are placed in the model with a center-to-center
distance of 60 cm. Figure 6 shows the model in
PLAXIS 3D. Active dynamic point loads are defined
For each time step all of the point loads acquire
their values based on the PROKON outputs. In this
way, the point loads will be activated continuously
and they reach the maximum values when the train
axles pass over them (See Table 2).
The distance between the first and the last axle for
an ICE is 21.7 m, which in terms of time is 0.434 sec
for a train with speed of 180 km/h. The total time
that the last axle of the train needs to pass the
length of the model is 1.136 sec. In this time, the
effect of the train before entering and after leaving
the model was also considered.
An additional time of 0.112 sec, which denotes
eighteen added rows to the multiplier was
considered for relaxing and preventing of
miscalculations in the model to the effect of stress
wave reflection in dynamic calculations. Various
methods are used for modelling boundaries
that decrease the effect of wave reflection. Nine
multiplier rows with values (shear forces) equal to
zero are inserted in the beginning and the end of the
multiplier. A small part of the multipliers’ sequence
is shown in Table 2 and schematic view of multipliers
change during the time is illustrated in Figure 3.
The static analysis for the calculation of shear
forces was performed by applying four unit point
HS-small model, besides the basic parameters,
oedometric, tangent, un/reloading Young’s
modulus, reference shear modulus and shear
strain as well as the advanced parameters are
calculated from the secant modulus [11].
Small values of cohesion in shallow depth for
simulation with the HS-small constitutive model,
particularly for gravel materials leads to unreliable
outcomes [12], hence, greater values of cohesion
are chosen for the upper soil layers.
Moreover, the first layer (Ballast) is modeled with
MC rather than HS-small constitutive model;
because of small vertical stresses in the upper
layers, the hardening soil constitutive model
tend to deliver unrealistic results. Soil basic and
advanced properties in models are listed in Table
3 and Table 4. The applied poisson’s ratio for all
layers in the HS-small model is the default value of
PLAXIS (υur
= 0.2).
To define a node to node anchor in PLAXIS, the
maximum forces that the element can carry in
tension as well as compression are demanded.
In addition, it needs only one stiffness parameter,
which is the axial stiffness [13]. The properties of
rail clips and the needed parameters for modelling
of beam element are listed in Table 5 and Table 6.
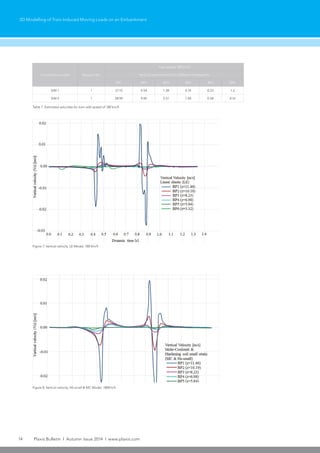
Figure 4: Scaled static model of unit loads of the beam in PROKON
Figure 3: Pictorial representation of multipliers sequence for 117 point loads in the
PLAXIS model
loads on the beam to simulate four axle’s forces
of one wagon. The beam with pin supports
every 60 cm are placed on soil. Figure 4 shows
the position of four unit point loads, rail and
sleepers in PROKON. For this calculation, the
default parameters of PROKON (see Figure 4)
were used. The modulus of subgrade reaction,
K, is a conceptual relationship between the soil
pressure and deflection of the beam. Because
the beam stiffness is usually ten or more times
as large as the soil stiffness as defined by K, the
bending moments in the beam and calculated soil
pressures are normally not very sensitive to the
on track 1 (Figure 6-b). For better visualization
of the 3D model, the modeled point loads are
deactivated in Figure 6-a and 6-b. Figure 6-c
shows exemplary some dynamic point loads.
Material Properties
Saturated, unsaturated density, Poisson’s ratio and
shear modulus were available from geotechnical
investigations, which were used for modelling of
soil behavior with the linear elastic constitutive
model. Secant modulus, friction angle, cohesion
and dilatancy of materials were acquired from
literature [10]. To model the soil behavior with the
Calculation Phases and Results
The calculation consists of three phases. The first
phase is common for generating the initial stresses
with active groundwater table. A plastic drained
calculation type is chosen in phase two. In this phase,
all elements of the railway track (sleepers, rails and
rail clips) should be active. The dynamic option
should be selected in phase three to consider stress
waves and vibrations in the soil. In this phase, all
dynamic point loads on the rails are active.
The simulations (SIM1 and SIM2) are performed
for a train (one wagon) speed of 180 km/h with
13. www.plaxis.com l Autumn issue 2014 l Plaxis Bulletin 13
3D Modelling of Train Induced Moving Loads on an Embankment
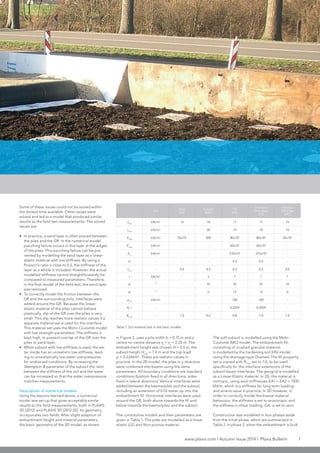
Table 2: Sequence of multipliers for all point loads
Table 3: Basic material properties of the soil layers for LE and MC models
No. Soil layers
γsat γunsat υ φ′ c′ Ψ E′
[kN/m3
] [kN/m3
] |-| |°| [kN/m2
] |°| [kN/m2
]
1 Ballast 21 19 0.30 35 30 5 30000
2 Protective layer 23 22 0.25 40 30 15 55000
3 Backfill, SE, SU, loose 19 18 0.35 28 10 0 25000
4 Backfill, SE, SU, semidense 20 19 0.35 28 10 0 35000
5 Backfill, SE, SU, dense 20 19.5 0.35 28 10 0 43000
6 Peat, HN, HZ 11 11 0.35 26 15 0 2000
7 Organic silt 13 13 0.35 25 10 0 4000
8 Sand 20 19 0.35 40 5 10 80000
Table 4: Advanced material properties of the soil layers for HS-small model
No. Soil layers
m Eoed
ref
E50
ref
Eur
ref
Ed0
Gd0
=G0
ref
γ0,7
|-| [kN/m2
] [kN/m2
] [kN/m2
] [kN/m2
] [kN/m2
] |-|
6 Peat, HN, HZ 0.7 2000 2000 6000 8100 3000 6.29×10⁻³
7 Organic silt 0.7 4000 4000 12000 16200 6000 2.79×10⁻³
8 Sand 0.5 80000 80000 240000 270000 100000 1.81-×10-4
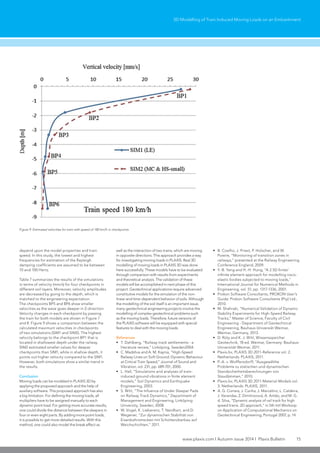
Figure 5: Shear force in the beam
Figure 6: Details of the model
Table 5: Input properties in PLAXIS 3D for rail and sleeper
Parameter Unit Rail Sleeper
Cross section area (A) [m2
] 7.7×10⁻³
5.13×10⁻²
Unit weight (γ) [kN/m3
] 78 25
Young's modulus (E) [kN/m3
] 200×106
36×106
Moment of inertia around the second axis (I3
) [m4
] 3.055×10⁻⁵
0.0253
Moment of inertia around the third axis (I2
) [m4
] 5.13×10⁻⁶
2.45×10⁻⁴
Table 6: Rail clip’s properties
Maximum tension force |Fmax,ten
| 312 kN
Maximum compression force |Fmax,com
| 1716 kN
Axial stiffness (EA) 2×10⁶
kN
consideration of three different constitutive
soil models. In SIM1, for all soil layers the Linear
Elastic (LE) model was used. SIM2 was simulated
using a combination of Mohr-Coulomb (MC) and
Hardening Soil small-strain model (HS-small).
Here, upper soil layers are modeled with the
MC model and the deepest three soil layers are
modeled with the HS-small model [12].
In dynamics, velocities rather than displacements
are presented to avoid second integration leading
to increasing errors in low frequency domain [14].
The velocity amplitude decreases by propagation
of the wave to the deeper soil layers. Material and
geometric damping are the main reasons for the
decreasing velocity amplitude in deep layers. In
this model, both types of damping are considered
by applying Rayleigh damping coefficients.
The lowest and highest relevant frequencies
14. 14 Plaxis Bulletin l Autumn issue 2014 l www.plaxis.com
3D Modelling of Train Induced Moving Loads on an Embankment
Table 7: Estimated velocities for train with speed of 180 km/h
Constitutive model Wagons No.
Train speed 180 km/h
Vertical velocity (mm/s) in different checkpoints
BP1 BP2 BP3 BP4 BP5 BP6
SIM 1 1 27.15 4.54 1.38 0.74 0.23 1.2
SIM 2 1 28.90 9.40 2.51 1.40 0.58 0.16
Figure 8: Vertical velocity, HS-small & MC-Model, 180Km/h
Figure 7: Vertical velocity, LE-Model, 180 Km/h
15. www.plaxis.com l Autumn issue 2014 l Plaxis Bulletin 15
3D Modelling of Train Induced Moving Loads on an Embankment
depend upon the model properties and train
speed. In this study, the lowest and highest
frequencies for estimation of the Rayleigh
damping coefficients are assumed to be between
10 and 100 Hertz.
Table 7 summarizes the results of the simulations
in terms of velocity (mm/s) for four checkpoints in
different soil layers. Moreover, velocity amplitudes
are decreased by going to the depth, which is
matched to the engineering expectation.
The checkpoints BP5 and BP6 show smaller
velocities as the wave goes deeper in Z-direction.
Velocity changes in each checkpoint by passing
the train for both models are shown in Figure 7
and 8. Figure 9 shows a comparison between the
calculated maximum velocities in checkpoints
of two simulations (SIM1 and SIM2). The highest
velocity belongs to the checkpoint BP1 that is
located in shallowest depth under the railway.
SIM2 estimated smaller values for deeper
checkpoints than SIM1, while in shallow depth, it
points out higher velocity compared to the SIM1.
However, both simulations show a similar trend in
the results.
Conclusion
Moving loads can be modeled in PLAXIS 3D by
applying the proposed approach and the help of
auxiliary software. This proposed approach has also
a big limitation. For defining the moving loads, all
multipliers have to be assigned manually to each
dynamic point load. For getting more accurate results,
one could divide the distance between the sleepers in
four or even eight parts. By adding more point loads,
it is possible to get more detailed results. With this
method, one could also model the break effect as
well as the interaction of two trains, which are moving
in opposite directions. This approach provides a way
for investigating moving loads in PLAXIS. Real 3D
modelling of moving loads in PLAXIS 3D was done
here successfully. These models have to be evaluated
through comparison with results from experiments
and theoretical analysis. The validation of these
models will be accomplished in next phase of this
project. Geotechnical applications require advanced
constitutive models for the simulation of the non-
linear and time-dependent behavior of soils. Although
the modelling of the soil itself is an important issue,
many geotechnical engineering projects involve the
modelling of complex geotechnical problems such
as the moving loads. Therefore, future versions of
the PLAXIS software will be equipped with special
features to deal with the moving loads.
References
• T. Dahlberg, “Railway track settlements - a
literature review,” Linköping, Sweden2004.
• C. Madshus and A. M. Kaynia, “High-Speed
Railway Lines on Soft Ground: Dynamic Behaviour
at Critical Train Speed,” Journal of Sound and
Vibration, vol. 231, pp. 689-701, 2000.
• L. Hall, “Simulations and analyses of train-
induced ground vibrations in finite element
models,” Soil Dynamics and Earthquake
Engineering, 2003.
• S. Witt, “The Infuence of Under Sleeper Pads
on Railway Track Dynamics,” Department of
Management and Engineering, Linköping
University, Sweden, 2008.
• W. Vogel, K. Lieberenz, T. Neidhart, and D.
Wegener, “Zur dynamischen Stabilität von
Eisenbahnstrecken mit Schotteroberbau auf
Weichschichten,” 2011.
• B. Coelho, J. Priest, P. Holscher, and W.
Powrie, “Monitoring of transition zones in
railways,” presented at the Railway Engineering
Conference England, 2009.
• Y.-B. Yang and H.-H. Hung, “A 2.5D finite/
infinite element approach for modelling visco-
elastic bodies subjected to moving loads,”
International Journal for Numerical Methods in
Engineering, vol. 51, pp. 1317-1336, 2001.
• Prokon Software Consultants, PROKON User’s
Guide: Prokon Software Consultants (Pty) Ltd.,
2010.
• M. Shahraki, “Numerical Validation of Dynamic
Stability Experiments for High-Speed Railway
Tracks,” Master of Science, Faculty of Civil
Engineering - Department of Geotechnical
Engineering, Bauhaus-Universiät Weimar,
Weimar, Germany, 2013.
• D. Rüty and K. J. Witt, Wissensspeicher
Geotechnik, 18 ed. Weimar, Germany: Bauhaus-
Universität Weimar, 2011.
• Plaxis bv, PLAXIS 3D 2011-Reference vol. 2.
Netherlands: PLAXIS, 2011.
• P.-A. v. Wolffersdorff, “Ausgewählte
Probleme zu statischen und dynamischen
Standsicherheitsberechnungen von
Staudämmen,” 2010.
• Plaxis bv, PLAXIS 3D 2011-Material-Models vol.
3. Netherlands: PLAXIS, 2011.
• A. G. Correia, J. Cunha, J. Marcelino, L. Caldeira,
J. Varandas, Z. Dimitrovová, A. Antão, and M. G.
d. Silva, “Dynamic analysis of rail track for high
speed trains. 2D approach,” in 5th Intl Worksop
on Application of Computational Mechanics on
Geotechnical Engineering, Portugal 2007, p. 14.
Figure 9: Estimated velocities for train with speed of 180 km/h in checkpoints
16. 16 Plaxis Bulletin l Autumn issue 2014 l www.plaxis.com
Preliminary 3D Modelling of Structural behaviour
of Face Bolting and Umbrella Arch in Tunneling
»Face bolts act essentially in tension but
they may also be subjected to bending
depending on the bolting density and the location
of bolts in the tunnel cross section. They are
designed to ensure the face stability and reduce
the extrusion. In the literature the effect of an
umbrella arch in tunnel stabilization has not been
Umbrella arch and face bolting are two reinforcement technics used in tunnelling (NATM conventional tunnelling), especially
for low-depth tunnels (H/D=1 to 5) in poorly consolidated soils. The arch is built by setting pipes around the contour line of the
tunnel face prior to excavation, while bolting consists in setting and sealing long fiberglass or metallic rods at the tunnel face.
The bolts provide improved mechanical properties to the ground that is to be excavated and they are gradually destroyed as
the excavation progresses, whereas the arch brings stability to the whole face area and is left as a permanent reinforcement.
In this context, 3D modelling of these tunnels and their reinforcement is essential to predict surface settlements and an
important tool to validate appropriate tunnel designs.
Antoine Monnet - Emad Jahangir, emad.jahangir@mines-paristech.fr, Mines ParisTech
(a) Umbrella arch reinforcement (b) Effect of reinforcements on settlements
Figure 1: Tunnel reinforcements and settlements (Aksoy and Onargan, 2010)
as well documented as face bolting.
Most studies agree on the improvements brought
by the face bolts regarding surface settlements
and face stability. Though, some authors point
out that the umbrella arch may only provide
better global stability. This may depend on the
surrounding ground characteristics (hard or soft
rocks, etc.), on the applied arch tilt and on the
connection type used to hang the arch pipes to
the tunnel steel ribs. Through a numerical analysis,
Prountzopoulos (2011) showed how the umbrella
arch could provide a good protection against
local instabilities which are rather common in soft
grounds or fractured rocks. Similar concluding
17. www.plaxis.com l Autumn issue 2014 l Plaxis Bulletin 17
remarks were highlighted by Janin (2012): while the
face bolting undergoes tension loads to improve
face stability and reduce settlements, the umbrella
arch mainly absorbs bending moments but does
not affect surface settlements significantly.
Aksoy and Onargan (2010) concluded that an
umbrella arch could be more efficient in grounds
with poor mechanical properties. Figure 1 shows
the efficiency of the combined system of both face
bolting and umbrella arch in soft rocks (Ankara
argillite, RQD<10%).
In order to verify above-mentioned findings and
to examine the mechanical behaviour of each
reinforcement element a parametric study was
performed using the PLAXIS 3D software.
In the context of face bolting and the umbrella
arch reinforcement, it is obvious that a realistic
numerical modelling should be done in 3D
configuration. PLAXIS 3D software was chosen
because it includes in its library firstly, the
Hardening Soil constitutive model (HSM) adapted
to the rheology of studied soils (normally-
consolidated soils due to small depth of
tunnelling), and secondly an appropriate structural
element to model the used bolts. The latter one is
a beam element entitled “embedded pile” which
is able to take into account the soil-bolt interface
to study closely the behaviour of reinforcement.
This software also has a quick and easy automatic
mesh generation tool.
1. Base case
The analysis was conducted on the South tube
of Toulon tunnel that is the tunnel on which Janin
(2012) based his Phd Thesis. This tunnel was
chosen, as it is well documented and appropriate
to the study of settlements in low-depth
tunnelling. Similar ground properties (c= 20kPa,
ϕ=30°) and dimensions were used in order to
compare results with Janin’s model. Though the
geometry was slightly simplified to a circular and
constant tunnel section. The staged construction
of Plaxis 3D (staged-step features) was used, with
3m-long processing cuts. The tunnel surface at
the most recent cut is modelled by plate elements
(with mechanical properties representative of
shotcrete of 0.3m thickness). A layer of shotcrete is
also sprayed on the face at every stage. The bolts
are partially renewed every 3m. These bolts are
18-m long, and their properties are collected in
table 1 together with other used reinforcements.
Figure 2 shows the geometry of the tunnel and the
vertical displacements caused by the excavation.
2. Modelling of the tunnel face bolting
This study investigated first the impact of bolting
density on surface settlements. As shown in figure
3, settlements decrease while increasing bolting
density (d = number of bolts per square meter
at the tunnel face) even though this effect is less
significant if we keep increasing this density. Here,
bolts are modelled by “embedded pile” elements,
which is discussed in the following.
Figure 2: Geometry, mesh and vertical
displacements of the tunnel surroundings
Table 1: Characteristics of used reinforcements
E(GPa) S(m2
) I(m4
) L(m)
Face bolt 210 0.448×10⁻³
0.0327×10⁻⁶
18
Umbrella arch 210 2.036×10⁻³
1.689×10⁻⁴
9
Shotcrete 1.35 - - 3
Figure 3: Impact of bolt density: partial settlement
depression for a 3m-long cut for 0.4 bolt/m², 0.2 bolt/m²
and without bolts
18. 18 Plaxis Bulletin l Autumn issue 2014 l www.plaxis.com
Preliminary 3D Modelling of Structural behaviour of Face Bolting and Umbrella Arch in Tunneling
Figure 4 shows the impact of face bolting on
extrusion of the tunnel face. At this stage, the face
bolts were modelled by either beam or spring
structural elements (fixed-end spring element,
is able to consider only the axial forces). Figure
4a shows widely favourable effect of face bolting
on extrusion decrease (face stabilization). At a
significant bolting density, the results remain
the same regardless the sort of element used to
model the bolts.
Modelling bolts by “embedded pile” elements
(beams with friction interface law) can be very
useful to characterize the nature of undergone
loads. Figures 5 and 6 show stresses (axial,
mobilized friction and shear) and strains (deformed
shape) profiles along the bolts, depending on the
location of the bolts and the bolting density.
For a bolt located at the center of tunnel section,
a low bolting density results in an important axial
stress, mobilized friction and the shearing stress
is significant nearby the face. On the contrary, at
a higher bolting density, friction is mobilized on
more bolts and then becomes less significant as
the axial stress.
For a given bolting density, different profiles were
observed, depending on the location of bolts on
the tunnel face. Bolts located at the top of the
face experience much more bending moments,
especially nearby the face.
Figure 4: Impact of face reinforcement modelling: horizontal (a) and normalized (b, c, d) displacements
(a) Horizontal displacements at the face
(c) Modelling bolts with spring elements (d) No face reinforcement
(b) Modelling bolts with beam elements
19. www.plaxis.com l Autumn issue 2014 l Plaxis Bulletin 19
Preliminary 3D Modelling of Structural behaviour of Face Bolting and Umbrella Arch in Tunneling
(a) Density = 0,012 b/m2
(b) Density = 0,2 b/m2
(c) Density = 0,4 b/m2
(d) Stresses on a bolt in the middle of the face, depending on bolting density
Figure 5: Impact of bolting density on strains and stresses
(a) Middle bolt, density = 0,012 b/m2
(c) Stresses on a bolt depending on its position in the face
Figure 6: Impact of bolt positioning on strains and stresses
(b) Up bolt, density = 0,012 b/m2
20. 20 Plaxis Bulletin l Autumn issue 2014 l www.plaxis.com
Preliminary 3D Modelling of Structural behaviour of Face Bolting and Umbrella Arch in Tunneling
Figure 7: Geometry, mesh and vertical displacements of the tunnel surroundings with umbrella pipe reinforcement
Bolts located at the top of the face experience
much more bending moments, especially nearby
the face.
On the contrary, axial stress is lower at the top
as well as the mobilized friction. The central bolt
undergoes a high axial stress as well as mobilized
friction where lower shear stresses are generated.
Regardless the location of the bolts or the bolting
density, all the bolts showed a positive axial stress
at the face. This seems contradictory with the
boundary conditions (pressure inside the tunnel
is 1 atm and therefore axial stress at the face
should be null). It can actually be explained by the
presence of the shotcrete layer covering the face.
3. Modelling of the umbrella arch
The same kind of parametric study was conducted
for the umbrella arch. The geometry of the arch
and its properties were the same as Janin’s for
the Toulon base case. The arch was made of 13
pipes of 18m length. Each pipe was spaced 50 cm
from the next and tilted by 6°. All were renewed
every 9m. The characteristics of used tubes for
the umbrella arch are collected in table1. Figure
7 shows the geometry of the tunnel with the
umbrella arch and the vertical displacements
generated by the excavation.
Figure 8 shows the surface settlement for a 60m
long tunnel construction. Settlements were
reduced by about 5% with the umbrella pipes.
This result confirms Janin’s conclusion: the arch
does not seem to impact significantly the surface
settlements. Increasing the diameter of the pipes
does not seem to modify significantly the result
either (depicted by D2 on figure 8). It is well known
that the pipes of the arch undergo essentially
bending moments. Figure 9 confirms this point
and locates the highest bending moments close
to the pipe heads. This last point is important
because it means any inaccuracy in the numerical
modelling of that sensitive region could impact
the local stability of tunnel. In particular, the
hanging point between the pipes and the tunnel
steel rib should be modelled carefully.
Conclusion
The study on structural behaviour of the face
bolting showed that the bolts work essentially in
tension, but may be subject to bending according
to their position and density.
A beam element is therefore more appropriate
than an anchor element. Yet, the axial load in the
bolts remains the most important, suggesting
the importance of the bolt-ground interface
considered in the numerical analysis. This
interface was taken into account using PLAXIS 3D
“embedded piles” elements which permitted the
estimation of the mobilized friction and the shear
stress through the bolts.
The parametric study on the arch umbrella
confirmed Janin’s results. However the connection
between the pipes and the tunnel wall seems to
play an important role.
It should be noted that a circular constant
geometry was used to model the tunnel in this
study, where a tunnel with a variable section would
provide a better rigidity (connection quality)
between the pipes and the tunnel, as depicted in
figure 1(a).
References
• Aksoy C.O., Onargan T. (2010). The role of
umbrella arch and face bolt as deformation
preventing support system in preventing
building damages, in Tunnelling and
underground space technology, 25, pp. 553-559.
• Caudron S., Dias D., Chantron L., Kastner R.
(2006). Numerical modelling of a reinforcement
process by umbrella arch, in International
Conference on Numerical Simulation of
Construction Processes in Geotechnical
Engineering for Urban Environment, NSC06,
23-24 March-Bochum (Germany), 9 p.
• Janin J-P. (2012). Tunnels en milieu urbain :
Prévisions des tassements avec prise en compte
des présoutènements (renforcement du front
de taille et voûte- parapluie). PhD, Institut
national des sciences appliquées de Lyon, 2012.
• Prountzopoulos (2011). Tunnel face
reinforcement and protection - Optimization
using 3D finite element analyses, in Proceedings
of the 21st European Young Geotechnical
Engineers Conference, Rotterdam, The
Netherlands, 4-7 September, 2011, pp. 33-39.
21. www.plaxis.com l Autumn issue 2014 l Plaxis Bulletin 21
Preliminary 3D Modelling of Structural behaviour of Face Bolting and Umbrella Arch in Tunneling
Figure 8: Impact of umbrella-arch reinforcement on cumulative surface settlement
Figure 9: Bending moment in the umbrella arch
22. 22 Plaxis Bulletin l Autumn issue 2014 l www.plaxis.com
Recent activities
Since the release of the PLAXIS 2D Anniversary
Edition in the beginning of the year, we have
already released two updates.
These updates contain some valuable improved
features and fixed issues in the program. These
are amongst others, improvements regarding
groundwater flow calculations. Most notable
is the improved visualization of flow boundary
conditions and the ability to specify a non-
uniform groundwater head along non-vertical
lines. It is now also possible to edit Polygon point
coordinates directly through the selection and
model explorers.
Furthermore in the latest update, PLAXIS 2D AE.02
we have focused some attention on the Dynamics
module. Please read some of the new tips-and-
tricks on our knowledge base (kb.plaxis.nl) to get
the most out of its advanced technical features:
• Compliant base and free field boundaries:
check on input signal
• How to setup tied degrees of freedom
• Using an accelerogram for Dynamics
• Drift correction for dynamic input signal from file
• Fixed and Compliant base: what input motion
is required?
• On the use of dynamic boundary conditions
Users of PLAXIS 2D AE can update their software
through PLAXIS Connect, or download the new
software via the software updates page on our
website. Prospects for the new PLAXIS 2D AE can
request a new introductory version via the demo
page on our website: www.plaxis.nl/page/
demo_cd/.
XG Geotools
Press Release - April 23, 2014
On April 23, 2014, NGI from Norway and
Plaxis from the Netherlands announced the
establishment of their joint venture XG Geotools
bv. XG Geotools will produce and market cloud
based software tools tailored for design tasks in
offshore geotechnical engineering. These tools
will combine the in-depth subject knowledge and
software design skills of both companies.
SPCalc is the first tool that has been launched
at OTC in Houston TX, U.S.A. early May - a tailor
made application for calculating the capacity of
suction anchors and suction piles using the finite
element method. XG Geotools plans regular new
additions to their ‘toolbox’ in the time to come.
SPCalc is a special purpose two-dimensional
finite element application used to calculate the
factor of safety for the undrained load capacity
of suction anchors in offshore geotechnical
engineering projects. The calculation is based
on robust numerical procedures and the FEM
analysis is fully automated – a calculation run takes
less than a minute. The computational results are
automatically stored and always available online.
The soil, geometry and load data are easily input
into the model using clear and intuitive input
screens. The finite element model is generated
automatically, and the calculation kernel solves for
the undrained capacity of the anchor design using
a non-linear, anisotropic soil model. 3D effects are
approximated in the anchor capacity calculation.
The output facilities provide visualization of the
stress distributions on the anchor under load.
23. www.plaxis.com l Autumn issue 2014 l Plaxis Bulletin 23
Plaxis Americas
The summer of 2014 saw yet another course in
New York City. This sold-out standard course had
a wide range of attendees, with a strong presence
of engineers interested in deep foundations
and several contracting companies present. The
course featured a special day on design and
analysis of foundations using PLAXIS 3D.
Plaxis was an exhibitor or visitor at a numerous
events in the past months, ranging from one of
the largest US trade shows to a small regional
geotechnical conference. Modelling suction piles,
mudmats and other subsea structures in PLAXIS
3D was further brought under the attention at the
Offshore Technology Conference in Houston (with
an attendance of over 100,000). Additionally, the
first product of the newly formed joint-venture
between NGI and Plaxis was revealed at OTC.
Further, in the past months pleasant chats and
good discussions took place at the Plaxis booth at
Geo-Congress in Atlanta, the Central Pennsylvania
Geotechnical Conference in Hershey, the
American Rock Mechanics Association conference
in Minneapolis, and the North American Tunneling
conference in Los Angeles. We’ll continue to visit
and exhibit at events across North America in
2015, so be sure to receive our emails or check the
list of upcoming events to see when and where
you can meet us in person. We look forward to
meet you!
In the fall of 2014 another advanced course will
be organized, this time in Houston, October 7
through 10. This advanced course will include a
special day on offshore geotechnics. We plan to
organize several interesting courses throughout
North America in 2015 with a variety of topics.
These courses will be announced through our
e-mailings and on our website.
Plaxis AsiaPac
The first Indonesia Plaxis Users meeting was held
on April 17, 2014. The meeting was well received
with an attendance of almost 200 users and
guests. This event was co-organized by our local
counterpart in Jakarta and Plaxis AsiaPac. There
were 9 presentations and the topics touched
on the use of PLAXIS 2D and PLAXIS 3D on the
modelling of Deep Foundations, Embankments,
Reinforced Soil Walls and Slope Stabilization.
We look forward in seeing our users from Indonesia
in the 2nd
edition of PUM-Indo 2015 in Jakarta.
Other events this summer organized by or
contributed to:
• The HKIE Geotechnical Division Annual Seminar
in Hong Kong
• ATC-18 International Workshop on Mega Deep
Foundations in Japan
• 49th
National Conference in Geotechnics in Japan
24. Title
16 Jalan Kilang Timor
#05-08 Redhill Forum
159308 Singapore
P.O. Box 572
2600 AN Delft
The Netherlands
www.plaxis.com
Tel +31 (0)15 2517 720
Fax +31 (0)15 2573 107
Plaxis AsiaPac Pte Ltd
Singapore
Tel +65 6325 4191
Plaxis bv
Computerlaan 14
2628 XK Delft
8 -11 September
Standard Course on Computational Geotechnics
Zurich, Switzerland
9 - 13 September
Combramseg 2014
Goiania, Brazil
12 September
Workshop on Foundations and 3D Modelling
Zurich, Switzerland
21 - 25 September
Dam Safety 2014
San Diego CA, U.S.A.
21 -25 September
10th International Conference on Geosynthetics
Berlin, Germany
23 -26 September
33. Baugrundtagung
Berlin, Germany
23 September
Workshop on Modelling 2D vs. 3D
Delft, The Netherlands
24 September
Workshop on Advanced Modelling in PLAXIS
Delft, The Netherlands
28 September - 1 October
GeoRegina 2014
Regina, Canada
29 - 30 September
Workshops on PLAXIS 3D and Offshore
Applications
Hamburg, Germany
29 September - 2 October
Advanced Course on Computational Geotechnics
Trondheim, Norway
30 September - 3 October
Standard Course on Computational Geotechnics
& Undrained Soil Behaviour
Brisbane, Australia
6 - 10 October
Advanced Course On Computational
Geotechnics & Dynamics
Wellington, New Zealand
7 - 10 October
Advanced Course on Computational Geotechnics
Houston TX, U.S.A.
13 - 15 October
AFTES 14th International Congress
Lyon, France
14 - 16 October
Advanced Course on Computational Geotechnics
Dubai, U.A.E.
21 - 24 October
DFI 39th Annual Conference on Deep
Foundations
Atlanta GA, U.S.A.
29 - 31 October
Advanced Course on Computational Geotechnics
New Delhi, India
10 - 14 November
7th International Congress on Environmental
Geotechnics
Melbourne, Australia
19 – 21 November
XXVII Reunión Nacional de Ingeniería Geotécnica
Puerto Vallarta, Mexico
25 – 28 November
Modélisation Numérique des Ouvrages
Géotechniques avec PLAXIS 2D
Paris, France
Upcoming Events 2014