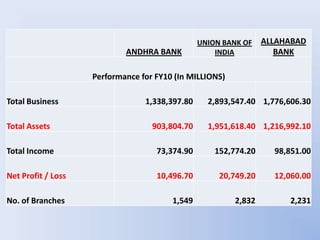
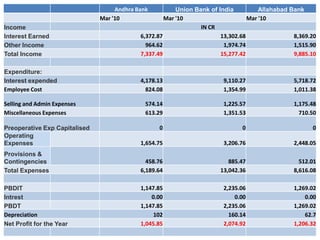
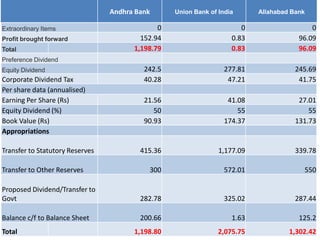
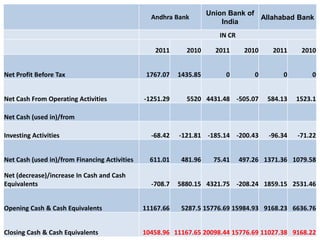
PRESENTED BY :
                  Swapnil Turakane
                  Deepanjali Ahire
                  Akshaya Lad
                  Nikita Rane
                  Gaurav Tarkar.
UNION BANK OF    ALLAHABAD
                            ANDHRA BANK             INDIA           BANK

                    Performance for FY10 (In MILLIONS)

Total Business                   1,338,397.80     2,893,547.40 1,776,606.30

Total Assets                       903,804.70     1,951,618.40 1,216,992.10

Total Income                        73,374.90       152,774.20     98,851.00

Net Profit / Loss                   10,496.70        20,749.20     12,060.00

No. of Branches                         1,549            2,832        2,231
Andhra Bank          Union Bank of India          Allahabad Bank
                               Mar '10               Mar '10                      Mar '10
Income                                                           IN CR
Interest Earned                             6,372.87                    13,302.68                8,369.20
Other Income                                  964.62                     1,974.74                1,515.90
Total Income                                7,337.49                    15,277.42                9,885.10

Expenditure:
Interest expended                           4,178.13                    9,110.27                 5,718.72
Employee Cost                                 824.08                    1,354.99                 1,011.38

Selling and Admin Expenses                    574.14                    1,225.57                 1,175.48
Miscellaneous Expenses                        613.29                    1,351.53                   710.50

Preoperative Exp Capitalised                      0                            0                       0
Operating
Expenses                                    1,654.75                    3,206.76                 2,448.05
Provisions &
Contingencies                                 458.76                      885.47                   512.01
Total Expenses                              6,189.64                   13,042.36                 8,616.08

PBDIT                                       1,147.85                    2,235.06                 1,269.02
Intrest                                         0.00                        0.00                     0.00
PBDT                                        1,147.85                    2,235.06                 1,269.02
Depreciation                                     102                      160.14                     62.7
Net Profit for the Year                     1,045.85                    2,074.92                 1,206.32
Andhra Bank      Union Bank of India      Allahabad Bank

Extraordinary Items                           0                        0                   0
Profit brought forward                   152.94                     0.83               96.09
Total                                  1,198.79                     0.83               96.09
Preference Dividend
Equity Dividend                           242.5                   277.81              245.69
Corporate Dividend Tax                    40.28                    47.21               41.75
Per share data (annualised)
Earning Per Share (Rs)                    21.56                    41.08               27.01
Equity Dividend (%)                          50                       55                  55
Book Value (Rs)                           90.93                   174.37              131.73
Appropriations

Transfer to Statutory Reserves           415.36                 1,177.09              339.78

Transfer to Other Reserves                 300                    572.01                550

Proposed Dividend/Transfer to
Govt                                     282.78                   325.02              287.44

Balance c/f to Balance Sheet             200.66                     1.63               125.2
Total                                  1,198.80                 2,075.75            1,302.42
Union Bank of
                                                 Andhra Bank                      Allahabad Bank
                                                                        India
                                                                       IN CR

                                                  2011      2010      2011      2010    2011     2010


Net Profit Before Tax                           1767.07   1435.85        0         0       0        0


Net Cash From Operating Activities             -1251.29     5520 4431.48 -505.07       584.13   1523.1

Net Cash (used in)/from

Investing Activities                             -68.42   -121.81 -185.14 -200.43      -96.34   -71.22


Net Cash (used in)/from Financing Activities     611.01    481.96    75.41     497.26 1371.36 1079.58

Net (decrease)/increase In Cash and Cash
Equivalents                                      -708.7   5880.15 4321.75 -208.24 1859.15 2531.46


Opening Cash & Cash Equivalents                11167.66    5287.5 15776.69 15984.93 9168.23 6636.76


Closing Cash & Cash Equivalents                10458.96 11167.65 20098.44 15776.69 11027.38 9168.22
Mar '10              Mar '10              Mar '10
Proprietary ratio                    0.022265             0.020148             0.023808


Debt Equity ratio                    172.2488             354.8762             249.5886

Quick ratio                          0.768869             0.721239             0.684233

Operating Expenses
ratio                                25.96554             24.10612              29.2507

Expenses ratio:
Selling & admn exps
ratio                                0.090091              0.09213             0.140453

Net Profit ratio                     16.41097             15.59776              14.4138

Return on Investment
(ROI)                                19.61319             24.25377             23.34697

Divident per share                   5.830515             6.434765             6.434744

Return on Equity Capital             165.6392             355.7788             215.0504
Afs banking

Afs banking

  • 1.
    PRESENTED BY :  Swapnil Turakane  Deepanjali Ahire  Akshaya Lad  Nikita Rane  Gaurav Tarkar.
  • 2.
    UNION BANK OF ALLAHABAD ANDHRA BANK INDIA BANK Performance for FY10 (In MILLIONS) Total Business 1,338,397.80 2,893,547.40 1,776,606.30 Total Assets 903,804.70 1,951,618.40 1,216,992.10 Total Income 73,374.90 152,774.20 98,851.00 Net Profit / Loss 10,496.70 20,749.20 12,060.00 No. of Branches 1,549 2,832 2,231
  • 3.
    Andhra Bank Union Bank of India Allahabad Bank Mar '10 Mar '10 Mar '10 Income IN CR Interest Earned 6,372.87 13,302.68 8,369.20 Other Income 964.62 1,974.74 1,515.90 Total Income 7,337.49 15,277.42 9,885.10 Expenditure: Interest expended 4,178.13 9,110.27 5,718.72 Employee Cost 824.08 1,354.99 1,011.38 Selling and Admin Expenses 574.14 1,225.57 1,175.48 Miscellaneous Expenses 613.29 1,351.53 710.50 Preoperative Exp Capitalised 0 0 0 Operating Expenses 1,654.75 3,206.76 2,448.05 Provisions & Contingencies 458.76 885.47 512.01 Total Expenses 6,189.64 13,042.36 8,616.08 PBDIT 1,147.85 2,235.06 1,269.02 Intrest 0.00 0.00 0.00 PBDT 1,147.85 2,235.06 1,269.02 Depreciation 102 160.14 62.7 Net Profit for the Year 1,045.85 2,074.92 1,206.32
  • 4.
    Andhra Bank Union Bank of India Allahabad Bank Extraordinary Items 0 0 0 Profit brought forward 152.94 0.83 96.09 Total 1,198.79 0.83 96.09 Preference Dividend Equity Dividend 242.5 277.81 245.69 Corporate Dividend Tax 40.28 47.21 41.75 Per share data (annualised) Earning Per Share (Rs) 21.56 41.08 27.01 Equity Dividend (%) 50 55 55 Book Value (Rs) 90.93 174.37 131.73 Appropriations Transfer to Statutory Reserves 415.36 1,177.09 339.78 Transfer to Other Reserves 300 572.01 550 Proposed Dividend/Transfer to Govt 282.78 325.02 287.44 Balance c/f to Balance Sheet 200.66 1.63 125.2 Total 1,198.80 2,075.75 1,302.42
  • 5.
    Union Bank of Andhra Bank Allahabad Bank India IN CR 2011 2010 2011 2010 2011 2010 Net Profit Before Tax 1767.07 1435.85 0 0 0 0 Net Cash From Operating Activities -1251.29 5520 4431.48 -505.07 584.13 1523.1 Net Cash (used in)/from Investing Activities -68.42 -121.81 -185.14 -200.43 -96.34 -71.22 Net Cash (used in)/from Financing Activities 611.01 481.96 75.41 497.26 1371.36 1079.58 Net (decrease)/increase In Cash and Cash Equivalents -708.7 5880.15 4321.75 -208.24 1859.15 2531.46 Opening Cash & Cash Equivalents 11167.66 5287.5 15776.69 15984.93 9168.23 6636.76 Closing Cash & Cash Equivalents 10458.96 11167.65 20098.44 15776.69 11027.38 9168.22
  • 6.
    Mar '10 Mar '10 Mar '10 Proprietary ratio 0.022265 0.020148 0.023808 Debt Equity ratio 172.2488 354.8762 249.5886 Quick ratio 0.768869 0.721239 0.684233 Operating Expenses ratio 25.96554 24.10612 29.2507 Expenses ratio: Selling & admn exps ratio 0.090091 0.09213 0.140453 Net Profit ratio 16.41097 15.59776 14.4138 Return on Investment (ROI) 19.61319 24.25377 23.34697 Divident per share 5.830515 6.434765 6.434744 Return on Equity Capital 165.6392 355.7788 215.0504