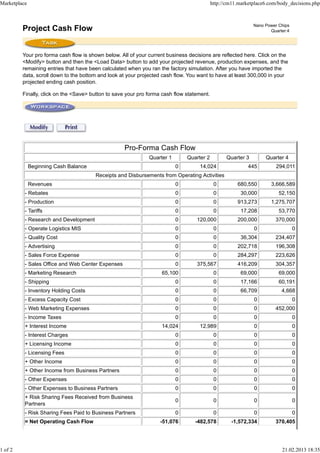
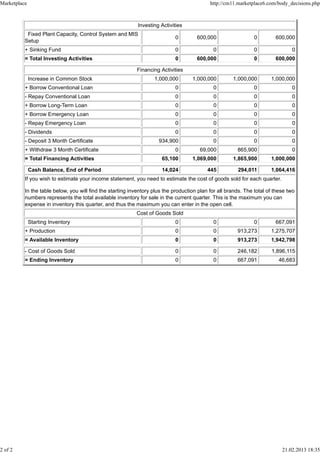
Marketplace                                                                                http://cm11.marketplace6.com/body_decisions.php


                                                                                                             Nano Power Chips
         Project Cash Flow                                                                                          Quarter:4


         Your pro forma cash flow is shown below. All of your current business decisions are reflected here. Click on the
         <Modify> button and then the <Load Data> button to add your projected revenue, production expenses, and the
         remaining entries that have been calculated when you ran the factory simulation. After you have imported the
         data, scroll down to the bottom and look at your projected cash flow. You want to have at least 300,000 in your
         projected ending cash position.

         Finally, click on the <Save> button to save your pro forma cash flow statement.


                                                   Pro-Forma Cash Flow
                                                              Quarter 1       Quarter 2          Quarter 3        Quarter 4
              Beginning Cash Balance                                      0        14,024                  445         294,011
                                       Receipts and Disbursements from Operating Activities
              Revenues                                                    0                 0         680,550        3,666,589
          - Rebates                                                       0                 0           30,000          52,150
          - Production                                                    0                 0         913,273        1,275,707
          - Tariffs                                                       0                 0           17,208          53,770
          - Research and Development                                      0       120,000             200,000          370,000
          - Operate Logistics MIS                                         0                 0                0                  0
          - Quality Cost                                                  0                 0           36,304         234,407
          - Advertising                                                   0                 0         202,718          196,308
          - Sales Force Expense                                           0                 0         284,297          223,626
          - Sales Office and Web Center Expenses                          0       375,567             416,209          304,357
          - Marketing Research                                     65,100                   0           69,000          69,000
          - Shipping                                                      0                 0           17,166          60,191
          - Inventory Holding Costs                                       0                 0           66,709           4,668
          - Excess Capacity Cost                                          0                 0                0                  0
          - Web Marketing Expenses                                        0                 0                0         452,000
          - Income Taxes                                                  0                 0                0                  0
          + Interest Income                                        14,024          12,989                    0                  0
          - Interest Charges                                              0                 0                0                  0
          + Licensing Income                                              0                 0                0                  0
          - Licensing Fees                                                0                 0                0                  0
          + Other Income                                                  0                 0                0                  0
          + Other Income from Business Partners                           0                 0                0                  0
          - Other Expenses                                                0                 0                0                  0
          - Other Expenses to Business Partners                           0                 0                0                  0
          + Risk Sharing Fees Received from Business
                                                                          0                 0                0                  0
          Partners
          - Risk Sharing Fees Paid to Business Partners                   0                 0                0                  0
          = Net Operating Cash Flow                                -51,076       -482,578           -1,572,334         370,405


1 of 2                                                                                                                   21.02.2013 18:35
Marketplace                                                                                 http://cm11.marketplace6.com/body_decisions.php


                                                            Investing Activities
           Fixed Plant Capacity, Control System and MIS
                                                                            0         600,000                   0        600,000
          Setup
          + Sinking Fund                                                    0                0                  0               0
          = Total Investing Activities                                      0         600,000                   0        600,000

                                                           Financing Activities
              Increase in Common Stock                             1,000,000        1,000,000         1,000,000        1,000,000
          + Borrow Conventional Loan                                        0                0                  0               0
          - Repay Conventional Loan                                         0                0                  0               0
          + Borrow Long-Term Loan                                           0                0                  0               0
          + Borrow Emergency Loan                                           0                0                  0               0
          - Repay Emergency Loan                                            0                0                  0               0
          - Dividends                                                       0                0                  0               0
          - Deposit 3 Month Certificate                              934,900                 0                  0               0
          + Withdraw 3 Month Certificate                                    0          69,000           865,900                 0
          = Total Financing Activities                                 65,100       1,069,000         1,865,900        1,000,000

              Cash Balance, End of Period                              14,024              445          294,011        1,064,416
          If you wish to estimate your income statement, you need to estimate the cost of goods sold for each quarter.

          In the table below, you will find the starting inventory plus the production plan for all brands. The total of these two
          numbers represents the total available inventory for sale in the current quarter. This is the maximum you can
          expense in inventory this quarter, and thus the maximum you can enter in the open cell.
                                                           Cost of Goods Sold
              Starting Inventory                                            0                0                  0        667,091
          + Production                                                      0                0          913,273        1,275,707
          = Available Inventory                                             0                0          913,273        1,942,798

          - Cost of Goods Sold                                              0                0          246,182        1,896,115
          = Ending Inventory                                                0                0          667,091           46,683


2 of 2                                                                                                                      21.02.2013 18:35

Proforma cf (1)

  • 1.
    Marketplace http://cm11.marketplace6.com/body_decisions.php Nano Power Chips Project Cash Flow Quarter:4 Your pro forma cash flow is shown below. All of your current business decisions are reflected here. Click on the <Modify> button and then the <Load Data> button to add your projected revenue, production expenses, and the remaining entries that have been calculated when you ran the factory simulation. After you have imported the data, scroll down to the bottom and look at your projected cash flow. You want to have at least 300,000 in your projected ending cash position. Finally, click on the <Save> button to save your pro forma cash flow statement. Pro-Forma Cash Flow Quarter 1 Quarter 2 Quarter 3 Quarter 4 Beginning Cash Balance 0 14,024 445 294,011 Receipts and Disbursements from Operating Activities Revenues 0 0 680,550 3,666,589 - Rebates 0 0 30,000 52,150 - Production 0 0 913,273 1,275,707 - Tariffs 0 0 17,208 53,770 - Research and Development 0 120,000 200,000 370,000 - Operate Logistics MIS 0 0 0 0 - Quality Cost 0 0 36,304 234,407 - Advertising 0 0 202,718 196,308 - Sales Force Expense 0 0 284,297 223,626 - Sales Office and Web Center Expenses 0 375,567 416,209 304,357 - Marketing Research 65,100 0 69,000 69,000 - Shipping 0 0 17,166 60,191 - Inventory Holding Costs 0 0 66,709 4,668 - Excess Capacity Cost 0 0 0 0 - Web Marketing Expenses 0 0 0 452,000 - Income Taxes 0 0 0 0 + Interest Income 14,024 12,989 0 0 - Interest Charges 0 0 0 0 + Licensing Income 0 0 0 0 - Licensing Fees 0 0 0 0 + Other Income 0 0 0 0 + Other Income from Business Partners 0 0 0 0 - Other Expenses 0 0 0 0 - Other Expenses to Business Partners 0 0 0 0 + Risk Sharing Fees Received from Business 0 0 0 0 Partners - Risk Sharing Fees Paid to Business Partners 0 0 0 0 = Net Operating Cash Flow -51,076 -482,578 -1,572,334 370,405 1 of 2 21.02.2013 18:35
  • 2.
    Marketplace http://cm11.marketplace6.com/body_decisions.php Investing Activities Fixed Plant Capacity, Control System and MIS 0 600,000 0 600,000 Setup + Sinking Fund 0 0 0 0 = Total Investing Activities 0 600,000 0 600,000 Financing Activities Increase in Common Stock 1,000,000 1,000,000 1,000,000 1,000,000 + Borrow Conventional Loan 0 0 0 0 - Repay Conventional Loan 0 0 0 0 + Borrow Long-Term Loan 0 0 0 0 + Borrow Emergency Loan 0 0 0 0 - Repay Emergency Loan 0 0 0 0 - Dividends 0 0 0 0 - Deposit 3 Month Certificate 934,900 0 0 0 + Withdraw 3 Month Certificate 0 69,000 865,900 0 = Total Financing Activities 65,100 1,069,000 1,865,900 1,000,000 Cash Balance, End of Period 14,024 445 294,011 1,064,416 If you wish to estimate your income statement, you need to estimate the cost of goods sold for each quarter. In the table below, you will find the starting inventory plus the production plan for all brands. The total of these two numbers represents the total available inventory for sale in the current quarter. This is the maximum you can expense in inventory this quarter, and thus the maximum you can enter in the open cell. Cost of Goods Sold Starting Inventory 0 0 0 667,091 + Production 0 0 913,273 1,275,707 = Available Inventory 0 0 913,273 1,942,798 - Cost of Goods Sold 0 0 246,182 1,896,115 = Ending Inventory 0 0 667,091 46,683 2 of 2 21.02.2013 18:35