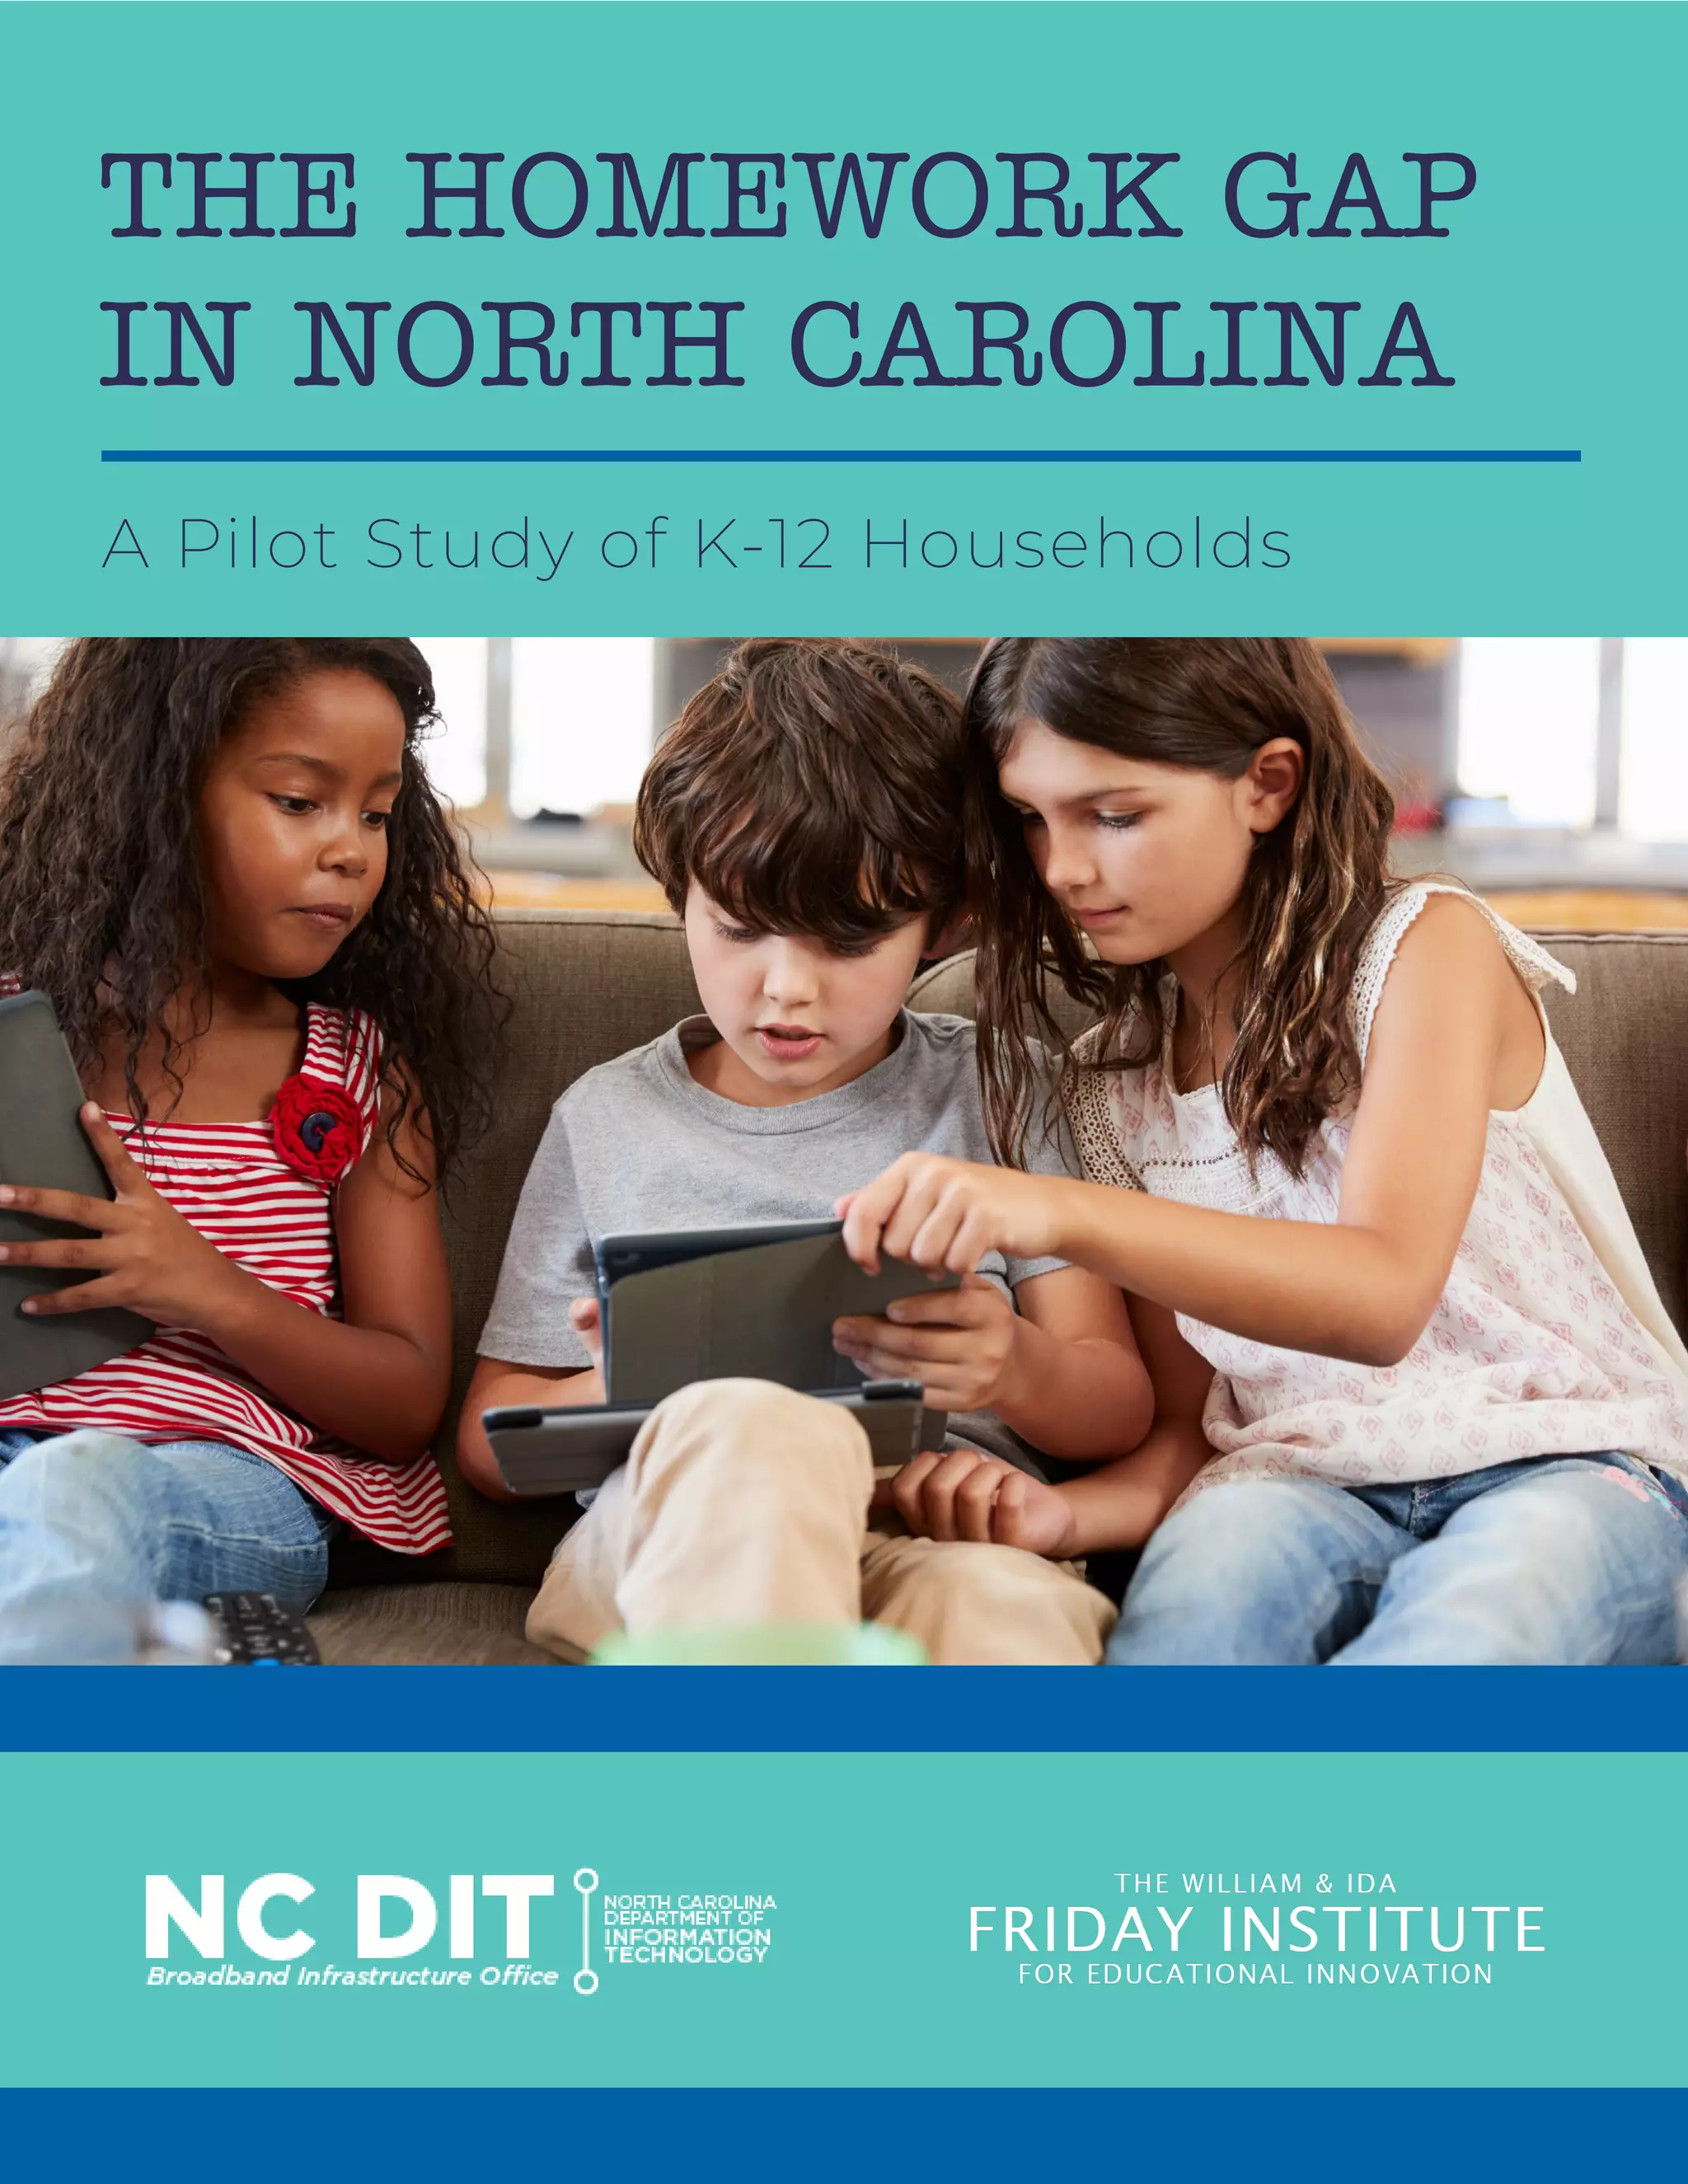
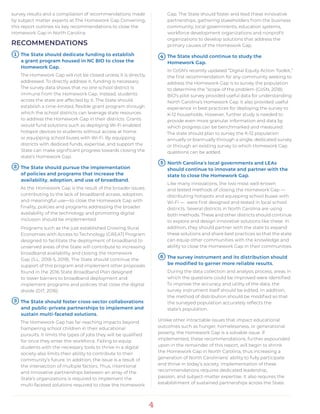
1
THE HOMEWORK GAP
IN NORTH CAROLINA
A Pilot Study of K-12 Households
THE HOMEWORK GAP
IN NORTH CAROLINA
A Pilot Study of K-12 Households
Presented by the Broadband Infrastructure Office and
the William Ida Friday Institute for Educational Innovation
Executive Summary............................................................................................................................ 3
Introduction............................................................................................................................................ 5
Understanding the Big Picture: Context for the Homework Gap.................................7
Developing the Pilot Survey.......................................................................................................... 10
Survey Analysis..................................................................................................................................... 11
Major Findings......................................................................................................................................12
The Homework Gap Convening Summary..............................................................................17
Closing the Gap: Recommendations to Close North Carolina’s Homework Gap.23
Conclusion.............................................................................................................................................25
References.............................................................................................................................................26
Appendices...........................................................................................................................................27
Acknowledgements......................................................................................................................... 66
About the Authors.............................................................................................................................67
Photos courtesy of the NC Department of Information Technology.
3
Data from the 2018 Teacher Working Conditions survey
issued biannually by the North Carolina Department of
Public Instruction (DPI) shows that 70 percent of high
school teachers, 60 percent of middle school teachers,
and 43 percent of elementary school teachers in North
Carolina regularly assign homework that requires internet
access to complete (NC Teacher Working Condition Survey
Results, 2018). Meanwhile, at least 259,000 North Carolinian
households do not have access to adequate broadband in
their homes (FCC, 2018). In addition, half of North Carolina’s
households do not have broadband because they cannot
afford it, do not have the skills to use it, do not have a device
at home to use it with, or do not see its relevance to their
lives (FCC, 2018).
Beyond these figures, the true state of the Homework Gap,
its impacts, and specific causes in North Carolina were
unknown. Without granular data about the number of
North Carolina’s school children affected by the Homework
Gap, the primary cause for their lack of access, the location
and geographic disbursement of these families, and the
impact of socioeconomic and demographic factors, targeted,
strategic solutions could not be designed.
To gather this data to inform strategic policy design, the
Broadband Infrastructure Office (BIO), a division of the
North Carolina Department of Information Technology (DIT),
partnered with the Friday Institute Research and Evaluation
(FIRE) Group at North Carolina State University to issue a
survey and host a convening of subject matter experts on the
topic of the Homework Gap. Understanding the common
reasons for and implications of the Homework Gap provides
stakeholders who seek to close the gap with the information
needed to design effective programs and policies.
The survey results, while not representative of all North
Carolinians due to the survey’s pilot nature, offer more detail
and color to paint a more focused picture of the Homework
Gap in North Carolina. Of the nearly 8,500 K-12 households
that responded to the survey, 10 percent lack broadband
access at home. For those without service, cost of the service
was the most cited reason for not having home access.
Lack of access often extended to the ownership of a
computer, laptop or tablet. Those without access were less
comfortable completing common tasks online in addition
to being less comfortable assisting their children with their
online homework. Finally, the Homework Gap impacted
low-income households and households with lower
educational levels more frequently.
Since the partners began studying the issue in 2017, the
topic of the Homework Gap has attracted an increasing
amount of attention. Just this year, the Department of
Education released a report examining the Homework Gap
nationwide, the Consortium for School Networking (CoSN)
released an updated toolkit designed to assist districts
as they address the Homework Gap locally, and in North
Carolina, Governor Cooper proposed a $2.5 million grant
program to improve home access for students.
This report contributes to the growing body of research
and strategic policy recommendations designed to
address the Homework Gap. The goal of this report is to
equip policymakers at the local and state level as well as
educators, school districts, and other key stakeholders with
the necessary information to understand the Homework Gap
and strategies for addressing it. After careful analysis of the
Executive Summary
“It truly is the cruelest part of the digital divide,” FCC Commissioner Jessica Rosenworcel
said when describing what she termed the Homework Gap at the Homework Gap
Convening hosted by the North Carolina Broadband Infrastructure Office and the William
Ida Friday Institute for Educational Innovation at North Carolina State University. The
Homework Gap, a specific subset of the digital divide, occurs when students are assigned
homework requiring access to the internet but do not have home access.
4
survey results and a compilation of recommendations made
by subject matter experts at The Homework Gap Convening,
this report outlines six key recommendations to close the
Homework Gap in North Carolina.
RECOMMENDATIONS
The State should dedicate funding to establish
a grant program housed in NC BIO to close the
Homework Gap.
The Homework Gap will not be closed unless it is directly
addressed. To directly address it, funding is necessary.
The survey data shows that no one school district is
immune from the Homework Gap. Instead, students
across the state are affected by it. The State should
establish a time-limited, flexible grant program through
which the school districts can leverage state resources
to address the Homework Gap in their districts. Grants
would fund solutions such as deploying Wi-Fi enabled
hotspot devices to students without access at home
or equipping school buses with Wi-Fi. By equipping
districts with dediced funds, expertise, and support the
State can make significant progress towards closing the
state’s Homework Gap.
The State should pursue the implementation
of policies and programs that increase the
availability, adoption, and use of broadband.
As the Homework Gap is the result of the broader issues
contributing to the lack of broadband access, adoption,
and meaningful use—to close the Homework Gap with
finality, policies and programs addressing the broader
availability of the technology and promoting digital
inclusion should be implemented.
Programs such as the just established Growing Rural
Economies with Access to Technology (GREAT) Program
designed to facilitate the deployment of broadband to
unserved areas of the State will contribute to increasing
broadband availability and closing the Homework
Gap (S.L. 2018-5, 2018). The State should continue the
support of this program and implement other proposals
found in the 2016 State Broadband Plan designed
to lower barriers to broadband deployment and
implement programs and policies that close the digital
divide (DIT, 2016).
The State should foster cross-sector collaborations
and public-private partnerships to implement and
sustain multi-faceted solutions.
The Homework Gap has far-reaching impacts beyond
hampering school children in their educational
pursuits. It limits the types of jobs they will be qualified
for once they enter the workforce. Failing to equip
students with the necessary tools to thrive in a digital
society also limits their ability to contribute to their
community’s future. In addition, the issue is a result of
the intersection of multiple factors. Thus, intentional
and innovative partnerships between an array of the
State’s organizations is required to implement the
multi-faceted solutions required to close the Homework
Gap. The State should foster and lead these innovative
partnerships, gathering stakeholders from the business
community, local governments, education systems,
workforce development organizations and nonprofit
organizations to develop solutions that address the
primary causes of the Homework Gap.
The State should continue to study the
Homework Gap.
In CoSN’s recently updated “Digital Equity Action Toolkit,”
the first recommendation for any community seeking to
address the Homework Gap is to survey the population
to determine the “scope of the problem (CoSN, 2018).
BIO’s pilot survey provided useful data for understanding
North Carolina’s Homework Gap. It also provided useful
experience in best practices for deploying the survey to
K-12 households. However, further study is needed to
provide even more granular information and data by
which progress can be benchmarked and measured.
The state should plan to survey the K-12 population
annually or biannually through a single, dedicated survey
or through an existing survey to which Homework Gap
questions can be added.
North Carolina’s local governments and LEAs
should continue to innovate and partner with the
state to close the Homework Gap.
Like many innovations, the two most well-known
and tested methods of closing the Homework Gap —
distributing hotspots and equipping school buses with
Wi-Fi — were first designed and tested in local school
districts. Several districts in North Carolina are using
both methods. These and other districts should continue
to explore and design innovative solutions like these. In
addition, they should partner with the state to expand
these solutions and share best practices so that the state
can equip other communities with the knowledge and
ability to close the Homework Gap in their communities.
The survey instrument and its distribution should
be modified to garner more reliable results.
During the data collection and analysis process, areas in
which the questions could be improved were identified.
To improve the accuracy and utility of the data, the
survey instrument itself should be edited. In addition,
the method of distribution should be modified so that
the surveyed population accurately reflects the
state’s population.
Unlike other intractable issues that impact educational
outcomes such as hunger, homelessness, or generational
poverty, the Homework Gap is a solvable issue. If
implemented, these recommendations, further expounded
upon in the remainder of this report, will begin to shrink
the Homework Gap in North Carolina, thus increasing a
generation of North Carolinians’ ability to fully participate
and thrive in today’s society. Implementation of these
recommendations requires dedicated leadership,
passion, and subject-matter expertise. It also requires the
establishment of sustained partnerships across the State.
5
41
2
3
6
5
And yet, until the U.S. Department of Education released a
report in April 2018 compiling data from multiple sources
to provide a more robust analysis of the impacts a lack of
access to broadband at home has on K-12 households, little
was known about the size and scope of the Homework Gap
beyond rough national estimates. Even with an increase
in data available to measure the national Homework Gap,
state, county, and municipal-level data on the Homework
Gap are non-existent and are not collected by the federal
agencies that measure broadband availability and adoption.
However, before targeted policies and programs to bridge
the Homework Gap can be designed and implemented, its
size, scope, and regional distribution must be determined.
This need for granular data, coupled with the desire to
address the Homework Gap holistically and systemically
led the BIO and The FIRE Group to partner to conduct a
pilot research study on the topic. The two organizations
designed and piloted a survey to collect information on the
Homework Gap, who it affects, and its primary causes for
North Carolina households.
Both organizations have a long history of advancing research,
policies and programs designed to bridge the digital divide
in North Carolina’s public schools and communities. The FIRE
Group leads the development and current implementation
of the “North Carolina Digital Learning Plan,” which highlights
the digital learning needs of the state to include out of
Introduction home · work · gap
/ʼhŌmˌwərk/ʼgap/
noun
The ‘Homework Gap’ occurs when students
are assigned homework requiring access to
the internet, but don’t have home access.
Nationally, seven in ten teachers assign
homework that requires internet access, but an
estimated 5 million households with
school-age children do not have internet
access at home, according to research from the
Pew Research Center (Pew Research Center,
2015). From difficulty in completing homework to diminished educational outcomes, the
consequences of the Homework Gap are vast and combine to hinder future career and
economic opportunities for both the students and their communities.
The Homework
Gap is the cruelest
problem we have,
but I think it is in
our power to fix.”
JESSICA ROSENWORCEL,
FCC COMMISSIONER
“
6
school access (The Friday Institute, 2015). In 2016, the BIO
released Connecting North Carolina State Broadband Plan
with nearly 80 policy recommendations to ensure all North
Carolinians who seek to adopt broadband have access to
it by 2021 (DIT, 2016). Given the importance of ensuring the
state’s youth are adequately prepared to participate in a 21st
century economy, closing the Homework Gap became one
of the primary topics the plan addressed. Among the four
recommendations focusing specifically on the Homework
Gap, the plan recommended conducting statewide research
on out-of-school internet access to fully articulate the
breadth of Homework Gap challenges for NC students.
More specifically the plan reads:
HG2.1 The state should distribute a survey in the
schools for parents to complete and return to obtain
more granular data on where the Homework Gap
exists. This could be a telephone, internet, or paper
survey (or all the above) targeted at parents. The
Friday Institute at North Carolina State University is
regarded nationally for developing and evaluating
these types of surveys.
To this end, the BIO partnered with the FIRE group to 1)
develop and administer a pilot Homework Gap survey, and
2) hold a convening of educational technology leaders to
brainstorm solutions to eradicate the Homework Gap. This
report details these activities.
7
Causes for the Homework Gap mirror those that prevent
households from adopting broadband in their homes.
Research shows that the four major obstacles to broadband
adoption are:
1 a lack of digital literacy knowledge
2 the unaffordability of either the internet service or the 		
	 digital device necessary for utilizing the internet
3 a lack of access to broadband service
4 the lack of understanding how the internet is relevant to 	
	 a person’s life.
In the 2015 study, The Numbers Behind the Broadband
‘Homework Gap’, the Pew Research Center found that
households with K-12 students are more likely to adopt
broadband than households without them. The study found
that 82.5 percent of surveyed households with K-12 students
adopt broadband, while roughly 73.5 percent of households
without K-12 students adopt. But among households
with K-12 students, low-income households fall about 20
percentage points behind average income households, and
Pew found they make up a disproportionate portion of the
5,000,000 households in the Homework Gap. In addition,
the Homework Gap disproportionately impacts low-
income black and Hispanic households, which are about 10
percentage points more likely to fall into the Homework Gap
than white households.
Data from previous North Carolina reports mirror these
findings. In a 2013 survey, 86 percent of respondents with
children in the household reported having home internet
service while 81 percent of respondents overall reported
having internet service (Wilson, 2014).
Meanwhile, school districts, schools, and teachers
increasingly use digital resources and tools in and outside
the classroom to supplement or replace their traditional
teaching methods. For those without home access or digital
devices, the Homework Gap results in digital inequities that
prevent those students from participating at the same levels
as their peers.
Two 2013 statutes passed by North Carolina’s General
Assembly encourage a transition from a reliance on physical
textbooks to a comprehensive digital learning ecosystem
in North Carolina’s K-12 schools (S.L. 2013-11 and S.L.2013-12).
The FIRE Group developed a digital learning plan for the
State Board of Education and DPI to guide the statute’s
implementation. The plan identified five major components
of the education system to address and support to
successfully implement a digital learning environment: 1)
leadership, 2) professional learning, 3) digital-age content
and instruction, 4) technology infrastructure and devices,
and 5) effective use of data and assessment (The Friday
Institute, 2015).
FIGURE 1
Digital Learning Progress Rubric Categories
Understanding the
Big Picture: Context for
the Homework Gap
The Homework Gap is a subset of the digital divide or “the gulf between those who have
access to computers and internet and those who do not,” (Oxford Dictionary, 2018). Both
the Homework Gap and the digital divide can be studied through the lens of broadband
adoption or households who subscribe to broadband service.
8
All five components of the plan rely upon a robust
broadband infrastructure in the schools and their
surrounding communities to effectively implement and
realize the full benefits from the plan. In addition, the plan
indicates that equity of access to all schools and students
cannot be achieved without reliable, consistent access to
digital resources.
Building from this plan, the Friday Institute hosted the
“Equity for Digital-Age Learning Convening” in 2016 where
attendees learned from subject matter experts the necessity
of promoting digital equity practices and programs
within and outside of the schoolhouse. Attendees also
brainstormed solutions for solutions to five key topic areas,
all of which impact the Homework Gap in some way: 1) out
of school internet access, 2) professional development and
preparation for educators, 3) personalized learning in
high-need classrooms, 4) building parent and community
support, and 5) planning for sustainability for devices,
networks and resources (The Friday Institute, 2016).
The convening accentuated BIO’s finding from the State
Broadband Plan — that further study of the Homework Gap
at the state level would be necessary to inform the creation
of policies and programs to address the Homework Gap
(DIT, 2016).
THE CURRENT STATE OF BROADBAND
IN NORTH CAROLINA
To understand the Homework Gap, it is necessary to
understand the broadband availability and adoption
landscape in North Carolina. Broadband availability — also
sometimes referred to as access or deployment — measures
the supply of broadband while broadband adoption
measures its demand.
Broadband availability and subscription data are provided by
the Federal Communications Commission (FCC). According
to its latest data release, 93.7 percent of North Carolinians
have access to broadband at the FCC recommended speed
threshold of 25 Mbps download/3 Mbps upload (2018). Due
to the FCC’s method of data collection and analysis, the data
are overstated, thus the estimates reported underestimate
the number of North Carolina residents without broadband
access. The state’s rural areas are particularly affected by the
lack of access with 95 percent of those without service in
rural communities.
As previously discussed, households cannot adopt
broadband if access is unavailable at their locations. For
259,000 households in North Carolina, a lack of access is
their primary barrier to adoption as broadband service is not
available at their home (FCC, 2018). Within North Carolina,
43 of the 100 counties have a household broadband
deployment rate at the FCC recommended speed threshold,
equal to or above North Carolina’s average of 93.7 percent
(FCC, 2018).
See Figure 2, opposite page
North Carolina’s subscription rate at 25/3 is 49.8 percent,
and ranks 18th
in the country (FCC, 2018). This indicates that
just under half of North Carolina’s households purchase
broadband at this speed threshold in their homes, according
to data from the FCC’s Internet Access Services 2016 report
(FCC, 2018).
See Figure 3, opposite page
As speeds decrease, subscriptions increase. When
considering all speeds, North Carolina’s adoption rate of 81
percent outranks the United States average of 80 percent
(American Community Survey, 2015).
See Figure 4, opposite page
Data on the availability and adoption of broadband form
part of the picture of where the Homework Gap exists,
who it impacts, and what causes it. However, because
broadband availability data are overstated, adoption data
are only granular to the county level, and neither dataset
systematically studies how households with school-age
children are impacted, the partners determined a systematic
study of the Homework Gap in North Carolina was needed.
9
FIGURE 2
Broadband Availability: Advertised Speeds of at least 25 MBPS Download/3 MBPs Upload
FIGURE 3
Broadband Adoption: Broadband Adoption Rates at all Speeds, 2015
FIGURE 4
Broadband Adoption Rate: North Carolina v. United States, 2016
Data derived from U.S. Federal Communications Commission Form 477
Data Release, December 2016
A provider that reports deployment of a particular technology and bandwidth
in a census block may not necessarily offer that service everywhere in the block.
10
Developing the
Pilot Survey
Without national or state datasets to measure the
Homework Gap quantitatively, the researchers
developed a mixed-method survey to measure its size,
scope, causes, and impacts. The researchers identified two primary purposes:
1 To understand the scope of the Homework Gap in North Carolina’s Legislative
	 Education Authorities (LEAs)
2 To better understand the barriers to students’ access to internet and their use of it for 	
	 homework and school activities
Given the Homework Gap’s close relation to broadband
adoption, the researchers began the survey development
process by compiling a list of relevant questions from surveys
previously administered by broadband and education
researchers such as BIO (and its predecessors, NC Broadband
and eNC Authority) the Pew Research Center, CoSN, the Census
Bureau and SpeakUp!. From this list, the researchers selected
the questions that best matched the research’s purpose.
The researchers then modified and adapted the questions
from previous research to ensure each question served the
research goals. Additional questions were added to achieve
the research goals. The researchers also consulted with
subject matter experts on final format and design. The final
survey was a mix of 17 quantitative and qualitative questions,
including demographic questions. It was also translated into
Spanish to reach more households. The survey was primarily
administered online, however some districts and partners
distributed and collected printed copies of the survey.
The target survey population for the survey was all North
Carolina households with school-age children (K-12). Given
the pilot nature of the study, the time restraints, and the
limited budget, researchers were unable to survey the
entire target population. Instead, the researchers employed
a nonprobability volunteer sample strategy. This strategy
consisted of partnering with several organizations that
interact with K-12 households to highlight the survey in
their communication with them or to distribute the survey
to them directly (see Appendix F for full list of partners).
Online and paper versions of both the English and Spanish
versions of the survey were provided. The primary mode of
distribution was online; however, partners were provided
with a printable version to print and distribute if they chose.
The researchers provided partners with a packet of prepared
and customizable information to use to distribute the survey
(see Appendices B-D). Most partners distributed online,
however, several individual schools and at least one entire
district printed the survey to distribute to students.
Through DPI, the researchers asked North Carolina’s 115
school districts to distribute the survey to their student
population. Similarly, the State Librarian’s Office informed
all the state’s libraries of the survey, some of whom printed
the survey for patrons to complete while visiting the library.
To test the process of distributing paper surveys, BIO printed
and distributed paper copies of the survey to one elementary
school in Durham. All print surveys from the test school and
all other locations were delivered to BIO who recorded the
data for analysis. Data from the paper surveys was flagged
when entered to allow for comparative analysis to surveys
completed online.
The survey was open for nearly two months. Initially slated to
be open for six weeks, from March 15, 2017, to May 1, 2017. The
researchers extended the time to May 12, 2017 to allow for the
collection of paper versions of the survey from partners.
LIMITATIONS
Methodological limitations include the unforeseen limitations
of the survey logic in the online version, the structure of
responses provided for one or two survey questions, and
the inherent limitations of reaching an accurate population
sample when the primary distribution method is online.
Due to the limitations resulting from the distribution
methodology, the sampled population did not represent
the average North Carolinian. As such, the survey results
are not generalizable, nor can they be used to estimate a
definitive number of North Carolinian households impacted
by the Homework Gap. However, given the results’ similarity
to previous adoption studies, the results reliably report the
barriers to internet access that impact K-12 households and
how a lack of access impacts their and their children’s usage
of the internet as well as their own comfort using the internet.
The pilot study, and lessons learned in its distribution, will
inform future research efforts.
RESEARCH PURPOSES:
1 To understand the scope of the 	
	 Homework Gap in North Carolina’s 	
	 Legislative Education Authorities 	
	(LEA’s)
2 To better understand the barriers 	
	 to students’ access to internet and 	
	 their use of it for homework and 	
	 school activities
11
ABOUT THE RESPONDENTS
The survey was completed by 9,490 participants. Of the
total participants, 8,485 completed the survey in full and
were included in analysis. Of the 8,485, 752 participants
completed a paper version of the survey while 7,733
participants completed the survey online. The number
of responses (N) varies from question to question, but for
most questions at least 7,000 respondents completed the
question and are included in the analysis.
Mothers or female guardians primarily completed the
survey on behalf of their households — 82.85 percent of
respondents were female, and 16.67 percent were male.
Respondent’s children overwhelmingly attended North
Carolina’s public schools — 96.98 percent reported that their
children attend public schools.
The respondent’s household size varied — 38 percent of
respondents had one child, 44 percent of respondents had 2
children, and 18 percent had three. Most respondents were
white, with 79.88 percent of respondents selecting “white”
as their race/ethnicity. As table 1 (below) shows, respondents
who reporting being Black/African American made up
9.61 percent of the responses and were the second-largest
population represented.
TABLE 01
Respondents by Race/Ethnicity
RESPONSE # %
Asian/Pacific Islander 112 1.41
Black/African American 761 9.61
Hispanic/Latino 411 5.19
Native American/American
Indian
152 1.92
White 6,324 79.88
Other 157 1.98
On average, respondents reported a higher level of
household income than the average household in North
Carolina. The median income level for respondents was
$74,999, whereas the state’s median income level is $49,999.
Respondents also reported higher levels of educational
attainment than the average North Carolinian. The average
survey respondent’s educational attainment level was
‘Bachelor’s Degree’ while the average North Carolinian
has completed “some college” according to data from the
American Community Survey (ACS, 2017).
At least one household participated from 99 of North
Carolina’s 100 counties. Some school districts and schools
promoted the survey more heavily than others, so some
regions were disproportionately represented in the sample
population. Of the 9,490 total respondents who completed
the survey, 110 completed the Spanish version of the survey.
See Figure 5, page 16
RESPONDENTS BY THE NUMBERS
Total Survey Participants 9,490
Usable Results 8,485
Completed Online 7,733
Completed on Paper 752
Survey Analysis
From the primary research questions, the researchers compiled a list of questions
designed to provide a framework for analysis and a deeper understanding of the
responses. In addition to summary statistics compiled for each survey question, statistical
tests were performed. The following section contains the major findings from the analysis.
The full analysis is found in Appendix E.
12
FINDING 1
10 percent of respondents reported not having
broadband access at home.
Contrary to the researcher’s hypothesis, people who
completed the survey online as opposed to the paper version
did not differ in the extent to which they reported having
internet access in their homes as seen in Table 1. However,
due to the survey’s limitations caused by sampling method,
this figure of 10 percent is not generalizable to the state as
whole. Meaning, the statewide percent of K-12 households
who lack access to broadband is still unknown.
However, this finding does not significantly differ from
national and previous state estimates. Pew Internet
estimated the Homework Gap affected roughly 17.5 percent
of K-12 households in 2015. 2013 data from the North
Carolina’s Citizen’s Survey indicated roughly 14 percent of
North Carolina’s K-12 households did not have broadband
at home (Wilson, 2014). Thus, while further study is needed
to determine the actual percent of North Carolina’s K-12
households impacted by the Homework Gap, the difference
between the survey’s finding and the actual figure is likely
not greater than 5 to 15 percentage points.
TABLE 02
Online v. Paper Survey Internet Access
INTERNET
ACCESS
NO INTERNET
ACCESS
Online 89.3% 10.6%
Paper 89.1% 10.9%
The lack of access was dispersed relatively evenly across the
state, and was present in both rural and urban areas.
See Figure 6, page 16
FINDING 2
Cost was the primary barrier to broadband access
for respondents.
Of the 10 percent of respondents without access, 65.96
percent (n=799—or the majority of those without access)
cited cost as the primary reason for not having internet in
their homes.
This is like national data which show that cost and relevancy
(a lack of understanding of how the internet impacts
one’s life) were the two primary reasons households with
school-age children cited for not having access in 2015 (U.S.
Department of Education, 2018). This was particularly true for
those with low incomes (those making less than $34,999) —
76.2 percent of whom indicated cost was the primary barrier.
TABLE 03
Relationship Between Income Level and ‘Too Expensive’
as Main Reason Respondent Does Not Have Broadband
Home Access; N=777
INTERNET
ACCESS
NO INTERNET
ACCESS
Low (Less Than
$10,000 - $34,999)
23.8 % 76.2 %
Medium ($35,000 -
$74,999)
43.4 % 56.6 %
High ($75,000 -
$200,000+)
81.2 % 18.8 %
Lack of access to the service itself was the second
most-frequent response with 23.27 percent of respondents
citing “it is not available in my area” as a reason for not
having access in their home. Respondents could choose
multiple reasons.
Major Findings
The survey analysis unearthed seven major findings that address the primary research
purposes: to better understand the scope of the Homework Gap in North Carolina’s 115
school districts, and to better understand the barriers to students’ access to the internet
and their use of it for homework and school activities.
13
Cost was also the primary barrier to device ownership. While
just 36 respondents reported not owning a single digital
device, 69.44 percent of them cited cost as the primary
reason for not owning a device.
However, for high-income respondents without broadband
access (those with annual incomes greater than $75,000),
the primary reason they lacked broadband at home
was because it was not available at their household. 71.9
percent of those without access who also had high incomes
indicated that it was the main reason they lacked access.
TABLE 04
Relationship Between Income Level and ‘Not Available’
as Main Reason Respondent Does Not Have Broadband
Home Access; N=777
IS NOT
A MAIN
REASON
IS A MAIN
REASON
Low (Less Than $10,000 -
$34,999)
87.4 % 12.6 %
Medium ($35,000 - $74,999) 59.8 % 40.2 %
High ($75,000 - $200,000+) 28.1 % 71.9 %
The response option, “Internet Too Slow” was the
third-most frequent selection as a reason for not having
home broadband access. However, as with the availability of
the service itself, this response was more frequent among
households with high incomes. 12.5 percent of
high-income respondents indicated the speed of the service
was their primary barrier, whereas 6.2 percent of low-income
households selected the same option.
Other response options — ‘’Don’t see the need for it,” “My
device does not connect,” “I use the internet somewhere else,”
and “Concerns about online privacy,” — did not significantly
impact respondents access to broadband in their home.
TABLE 05
Relationship Between Respondents Without Access and
Main Reason for Not Having Internet in their Home; N=937
RESPONSE OPTION
NOT FOR
THIS
REASON
FOR THIS
REASON
Don't see the need for it 96.37 % 3.63 %
Not available in my area 76.73 % 23.27 %
Internet too slow 91.36 % 8.64 %
My device does not
connect
97.65 % 2.35 %
Too expensive 34.04 % 65.96 %
I use the internet
somewhere else
92.85 % 7.15 %
Concerns about online
privacy
97.23 % 2.77 %
Other 89.01 % 10.99 %
Mobile devices and smart phones were included as
possible response options for the question that gauged
device ownership. As such, many respondents had access
to a mobile or smartphone only. However, the survey was
constructed in such a way to prevent a calculation of the
number of households with a mobile or smart phone only.
Future research should separate mobile phone ownership
from computer ownership to better understand the true
nature of device ownership.
FINDING 3
The lower the respondent’s income and education
levels, the less likely they were to have broadband
access at home.
The data show that the higher a household’s income, the
more likely it was to have access to broadband, even free
broadband. And the higher a person’s income, the more
likely they were to have broadband access. The median
income bracket for respondents without access was
$25,000-34,999 — 65 percent of those without access
reported household incomes of $34,999 or less.
The same is true for educational attainment. The lower
the household’s educational level, the less likely it was to
have access at home. Of those without access at home, 64
percent responded as having completed “Some College” or
less. Those with access were more likely to have a bachelor’s
degree or higher than those without access.
14
The relationship between race and/or ethnicity and
broadband access was less clear. This is primarily due to
the make-up of the respondents, which was predominantly
white with 79.8 percent. However, national research shows
that higher percentages of minority-led households lack
access when compared to their white peers (Pew Research
Center, 2015). To better understand the relationship between
race/ethnicity and broadband access in North Carolina,
further research is needed.
FINDING 4
Most respondents without broadband access also
do not own a desktop, laptop, or tablet.
78.9 percent of respondents without internet access do
not own a desktop computer and 51.4 do not own a laptop
computer. Meanwhile, only 9.3 percent of respondents
with a paid subscription do not own a laptop computer.
The ownership difference between those with and without
broadband access is statistically significant for all three
digital device types.
However, of the three device types, respondents without
broadband access were most likely to own a tablet. 57.1
percent of respondents without access reported owning a
tablet, while 48.6 percent reported owning laptops and 21.1
percent indicated they owned a desktop computer.
TABLE 06
Relationship Between at Home Access and Ownership of
Tablet; N=8,257
DOES NOT
OWN
OWNS
Paid Access 9.5 % 90.5 %
Free Access 28.3 % 71.7 %
No Access 42.9 % 57.1 %
Ownership of other types of internet-enabled devices such as
smart TVs, streaming devices, and gaming systems was less
frequent than desktop, laptop and tablet ownership among
those with broadband access and without. However, those
with access continued to own these devices at a greater rate
than those without broadband access.
FINDING 5
Smart phone device ownership was nearly
universal among respondents, but those without
home broadband access were more likely to not own a
smart phone.
The most popular device for accessing the internet among
respondents was the smart phone. 98% (n=7,691) of
households reported owning at least one smart phone.
TABLE 07
Relationship between Access at Home and Ownership of
Smart Phone Devices; N=8,653
0 1 2 3 4
Paid Access 1.8 % 10.4 % 34.7 % 27 % 26.2 %
Free Access 4.7 % 23 % 26.7 % 19.3 % 26.4 %
No Access 9 % 29.2 % 33.6 % 15.4 % 12.8 %
However, analysis demonstrated a statistically significant
difference in the number of smart phones individuals
reported owning based on their internet access at home.
Those with home broadband access were more likely to
own more smart phones. Those without access were more
likely to own fewer smart phones or no smart phone at all.
For instance, 9 percent of those without broadband access
reported not owning a smart phone, while for those with
access, just 1.8 percent reported not owning a smart phone.
15
FINDING 7
Students without broadband access at home use
the internet most frequently in someone else’s home.
To better understand where K-12 students complete
homework that requires internet access, the survey asked
parents to rate the frequency at which their children visited
a variety of locations to complete homework requiring the
internet. ‘Someone Else’s Home’ was the most frequent
response from all respondents and those without access.
Of those without access, 45 percent reported accessing the
internet in someone else’s home at least once a week while
20 percent of the total respondents reported the same.
Restaurants and libraries were equally popular (at 31 percent)
among those without access while for the entire survey
population restaurants (at 12 percent) outranked libraries (at
9 percent).
These results mirror national data which also identified
“someone else’s home” as the most popular place to access
the internet outside of school (U.S. Department of Education,
2018). Public libraries outrank restaurants by 13 percentage
points in the national data, however, indicating further study
of North Carolina’s most popular destinations is needed.
FINDING 6
Households without broadband access were less
comfortable in helping their children with schoolwork
and completing other online tasks themselves.
The difference in levels of comfort in assisting their children
with online schoolwork between respondents with access
and those without was statistically significant. In addition,
there was a statistical difference between those with and
without access and their level of comfort in using digital
devices and the internet to complete each of the categories
surveyed: online banking, completing work, online shopping,
accessing personal information, job searching, and accessing
entertainment. Meaning respondents with broadband
access were more comfortable navigating and using digital
devices than those without access at home.
TABLE 08
Level of Parent’s Comfortability in Helping Children with
Schoolwork by Access Level; N=7,995
VERY
UNCOMFORTABLE
SOMEWHAT
UNCOMFORTABLE
SOMEWHAT
COMFORTABLE
VERY
COMFORTABLE
Paid Access 9 % 6.1 % 22.3 % 62.6 %
Free Access 13.9 % 7.4 % 29.2 % 49.5 %
No Access 16.5 % 11.3 % 28.1 % 44.1 %
16
FIGURE 6
Count of Households Reporting They Do Not Have Home Access by Zip Code
FIGURE 5
Count of Survey Participants by Zip Code
17
The Homework Gap
Convening Summary
To continue conversations held during the 2016 “Digital Equity Convening,” reveal and
discuss the preliminary data and findings from the survey, and engage stakeholders and
subject matter experts in designing solutions to close the Homework Gap, the partner
organizations hosted a convening called “The Homework Gap Convening” on September
13, 2017 at the Friday Institute. Representatives from local and state governments,
institutes of higher education, private business, public organizations, and schools/districts
assembled to engage in productive conversations about eradicating the Homework Gap.
The schedule for the day was intentional. Each session
addressed eliminating the Homework Gap and provided
opportunities for the participants to engage in meaningful
discussion. The following sections of this paper will provide
an overview of the day, including participants’ feedback
during working groups and recommendations for addressing
digital inequities in NC.
OPENING SESSION
The Convening featured speakers from the partner
organizations as well as Governor Roy Cooper’s Senior
Education Advisor Geoff Coltrane, Department of
Information Technology’s Secretary Eric Boyette, and
a keynote address from FCC Commissioner Jessica
Rosenworcel. Dr. Glenn Kleiman set the tone for the day
with a welcome and a brief explanation of the importance of
addressing digital inequities in North Carolina’s schools.
18
Throughout all this work which dates
back 10 years, we’ve made great
progress, but this issue of equity
has been a critically important
one – equity of access, equity
of opportunity for all students
across the state. We’ve made great
progress in the schools themselves
but still this issue of what’s called
the Homework Gap…is enormous.
”DR. GLENN KLEIMAN,
FORMER DIRECTOR, FRIDAY INSTITUTE
If we are not able to bridge this Homework Gap,
our state’s children, our future workforce, will
not be adequately prepared for the jobs of the
21st
century. In addition, expanding broadband
access, especially in our rural communities, will
help to expand economic opportunities for
families across North Carolina.
”GEOFF COLTRANE, SENIOR EDUCATION ADVISOR,
OFFICE OF THE GOVERNOR
Jeff Sural, BIO’s Director, provided an overview of BIO and
its interest in solving the Homework Gap. In addition, he
provided a working definition for the Homework Gap that
would be used throughout the day, “students who are
assigned homework requiring access to the internet, but
don’t have home access.”
“
“Kleiman then invited
attendees to settle
in for a day filled
with the promise of
making a difference
in the lives of
students. He closed
by mentioning that
the very solution to
the Homework Gap
could reside in the
minds of the diverse
crowd assembled for
the convening. “This
is a working session
in which we plan to
put you to work to
get your best ideas.”
Sural was followed by Coltrane, who brought remarks from
the governor’s office. Coltrane discussed Governor Cooper’s
Common Ground Solutions budget, which included $20
million to improve internet access and service to households
and businesses in underserved areas of North Carolina. In
conclusion, he shared the words of Governor Cooper:
19
HOMEWORK GAP
SURVEY DATA
PRESENTATION
Representatives from the BIO and the
FIRE Group led the following session in
which they reaffirmed the definition of
the Homework Gap, provided context
about the broadband challenges
facing North Carolina, and provided an
overview of the survey development
process, survey administration, the
analysis procedures, and the results. The
presenters explained the impetus for the
survey, the primary findings from the
data, and lessons learned in conducting
the survey. The data was provided to
each participant in a visual report to refer
to and use during the brainstorming
sessions in the afternoon.
KEYNOTE ADDRESS: JESSICA
ROSENWORCEL, FEDERAL
COMMUNICATION COMMISSIONER
Federal Communication Commissioner Jessica Rosenworcel
delivered an inspiring keynote address highlighting both the
need for closing the Homework Gap and innovative solutions
she’s witnessed across the country. She began by recounting
how she first encountered the Homework Gap while visiting
Department of Information
Technology Secretary
Eric Boyette began his
remarks by thanking the
convening participants
for their attendance and
encouraged them to
actively engage contacts in
their sphere of influence to
help reduce the Homework
Gap. He lauded the
progress made to connect
North Carolina’s schools, but
pointed to limited levels
of access to devices and
broadband connectivity as
barriers to some students.
He ended his remarks
by asking participants to
dig deep and help move
the work forward in a
meaningful manner.
a middle school, and subsequently coined the term to
describe the condition she witnessed when K-12 students are
assigned homework that requires internet access, but don’t
have access at home. She continued by sharing stories from
across the country of how students “cobble together” access
by using restaurants, late-night school access, and appealing
to family and friends. She complemented the progress North
Carolina has made toward narrowing the divide thus far and
charged the state to continue refining existing programs and
designing new mechanisms to support digital age learning
and sustainable, comprehensive solutions for closing the
Homework Gap.
Federal Communication Commissioner Jessica Rosenworcel addresses a room of
stakeholders at the Homework Gap Convening.
“The good news is that our
K-12 schools are all connected.
That’s a big plus. We are a
model state. We have had other
states ask how have you done
this, which is a good thing for
North Carolina. Still we have a
growing divide and too many of
our state’s children lack the means
for broadband access and the tools
that they need to be successful and
to build our workforce for the
future.
”ERIC BOYETTE, SECRETARY AND
STATE CHIEF INFORMATION OFFICER,
NORTH CAROLINA DEPARTMENT OF
INFORMATION TECHNOLOGY
20
HOMEWORK GAP
SOLUTIONS PANEL
A panel of local leaders from Charlotte, Lee County, and
Montgomery County moderated by Phil Emer of the Friday
Institute described their efforts to close the Homework Gap. With a
mix of rural and urban participants, the panel presented strategies
for addressing the Homework Gap for both types of communities.
Bruce Clark, Executive Director of Digital Charlotte, shared
information about the implementation of a Sprint 1Million
program in Charlotte-Mecklenburg schools that will provide 2,500
hotspots to high school students over five years. Rob Dietrich
of Lee County described the partnership with UR Cast and U.S.
Cellular to provide low-bandwidth hotspots and caching software
through which students can download pages and information
from the internet for the completion of homework before leaving
school and upload it when they return. And Beth Lancaster
of Montgomery County detailed their initiative to install Wi-Fi
equipment on school buses with long commutes for students to
complete homework while traveling to and from school.
When asked about how they could sustain and expand their
efforts, the panelists cited the need for additional grants
and engaging support from local elected officials like county
commissioners. In addition, Dietrich noted the need for
sustainable funding to comprehensively address the Homework
Gap in his district and statewide.
“
Panelists pictured from Left to Right, Beth Lancaster, Rob Dietrich, and Bruce Clark.
A grant is a short-term band aid solution to a long-term problem. Eventually, the
grants will run out. Eventually, it won’t serve what I need. I need long-term help
from organizations bigger than school systems like county commissioners, state
budgets, federal budgets that will give me the
ability to put devices in the hands
of the kids.
”ROB DIETRICH, DIRECTOR OF
TECHNOLOGY AND ACCOUNTABILITY,
LEE COUNTY SCHOOLS
Themes, ideas and recommendations for
stakeholders considering implementing
programs to close the Homework Gap from
local expert’s panel:
•• The importance of identifying service
providers with which to partner
•• Map broadband availability data to visualize
access availability and gaps
•• Consider implementing technologies to
help bypass a lack of access at home like
caching software
•• Negotiate with broadband service providers
to ensure affordability
•• Consider leveraging programs like E2D’s
ReImage CLT program where students
refurbish devices
•• Clearly articulate definition of access at
beginning of initiatives
•• Determine sustainability plans at beginning
of projects so initiatives can be sustained
beyond life of grant programs
•• Find advocates for additional funding from
local, state, and federal elected leaders
•• Release state surplus devices to nonprofit
technology refurbishers dedicated to
closing the digital divide.
21
In addressing the guiding question,
the Technology group’s conversation
centered around ideas for leveraging
existing technologies and creating
more efficient pathways to get those
technologies into the K-12 schools.
For example, much of the discussion
centered on the inability of state
government agencies to donate their
devices to non-profit refurbishers due
to barriers found in the state’s statutes
and administrative code. The group’s
discussion of this point, acknowledges
that much of the technology students
need to participate fully in and outside
the classroom already exists, but is not
always accessible to all populations. As
such, the Technology group identified
the following potential solutions:
•• Determine a way to “unlock” the state
surplus law (S.L. 2017-67) passed by the
NCGA in the 2017-2018 Session
•• Conduct a demand aggregation by school district to
gather data on the number of K-12 students who lack
devices at home
•• Create a clearinghouse for information, resources, and
best practices so each school district implementing device
programs are not recreating the wheel
Additional recommendations included to continue working
to ensure e-Rate modernizes and supports technology
expansion in the schools, and to design a state initiative to
fund the distribution of devices to students.
SUSTAINABILITY
The primary questions the Sustainability breakout group
was charged with addressing was, “What are some creative
financing models for closing the Homework Gap?” and
“What are the best ways to sustain those models?”
The group’s discussion centered around four types of
organizations that can all impact the sustainability of
Homework Gap solutions: State government, Local
SOLUTIONDESIGNBREAKOUTGROUP
SESSIONS
In the afternoon, participants divided into working groups
discussing four areas:
1 Technology, Infrastructure, and Devices
2 Sustainability
3 Policy
4 Research and Data
A facilitator guided each group through conversations
designed to both define the challenges associated with each
topical area and develop thoughtful recommendations for
practical next steps.
The concurrent sessions began with a brief introduction
of the participants in which they provided their name,
organizational affiliation, and their connection to or reason
for interest in the Homework Gap. Next, a guiding question
aligned to the session topic was posted to generate ideas.
Each participant was given small slips of paper to record their
answers. The responses were placed on the wall and grouped
by similarities. Each participant then received three stickers
to select the top three areas they would like to discuss.
Once the top three areas were identified, the group
discussed in more detail those areas and produced a
list of recommendations from each group discussion
(see Appendix G for a full summary). Summaries of the
discussions and recommendations from each group follow.
TECHNOLOGY,INFRASTRUCTUREAND
DEVICES
The primary question the Technology, Infrastructure and
Devices (Technology for short) breakout group was charged
with addressing was, “What technologies are needed to
bridge the Homework Gap?”
Convening attendees participate in
a brainstorming activity in their breakout session.
The Sustainability breakout group discuss
how to design sustainable solutions.
22
government, school districts, and private entities. Potential
solutions the Sustainability working group compiled based
on the discussion follow:
•• All levels of government
•• Develop public-private partnerships with entities
such as banks, churches, local governments, and state
government to address all the factors contributing to the
Homework Gap.
•• State government
•• Reduce costs of wireless service to mobile hotspots
to check out to students by using a state-level agency
contract to negotiate lower costs for all school districts,
just as DPI does for instructional resources (textbooks).
•• The NCGA should create line items that require funds
previously dedicated to funding textbooks be used to
provide devices or broadband connectivity for students
without home access.
•• Local government and
school districts
•• Engage in open conversations
with service carriers about
allowing them to put cell
towers on district properties on
a lease.
•• Consider making same
option available to nonprofit
organizations.
Additional suggestions included
encouraging teachers to not assign
homework that requires internet
access, and a suggestion that the
state dedicate funds garnered
from the North Carolina Education
Lottery to purchase devices and
hotspots or other forms of access
for students.
POLICY
Participants of the Policy breakout group focused on the
question, “What policy changes are needed at the local,
state, and federal level to bridge the Homework Gap?”
The group spent most of the allotted time discussing state-
level challenges and opportunities for modifying existing or
designing new state policies to address the primary causes
of the Homework Gap. Four potential solutions the group
discussed follow:
•• Modify existing federal and state laws to allow surplus
government computers to be donated to non-profit
computer refurbishers dedicated to ending the digital
divide. With the additional supply of computers from
state agencies, the non-profit refurbishers can scale their
current operations to deliver more low-cost computers to
households without computers across the state.
•• Compile best practices and provide examples of
opportunities municipal and county governments
can engage in to improve broadband access in their
communities within the confines of the current laws.
•• The NCGA should clarify S.L. 2011-84 to provide guidance
for municipalities who desire to engage in improving
broadband access in their communities but are unsure
how to do so within the confines of the current law.
•• The NCGA should fund and create a state grant program
designed to make high-cost rural areas more economical
for private providers to deploy service to unserved areas.
RESEARCH AND DATA
The Research and Data working group focused on the
guiding question, “How can we improve upon the pilot
research, data collection, and analysis?” The group spent
time considering the various challenges of issuing a statewide
survey. For instance, a member of the research team
described the inherent costs and challenges of distributing
and collecting paper versions of the survey. The group also
discussed various ways to improve the survey distribution and
collection process to increase the response rate and improve
the understanding of the Homework Gap. The potential
solutions the Research and Data group devised follow:
•• Improve the survey’s data collection to ensure there is a
wider response from more diverse participants.
•• Target distribution to rural and high-need poverty areas as
households in those areas are more likely to fall into the
Homework Gap.
•• Shorten the survey to prevent survey fatigue and increase
the full response rate.
•• Use data analytics of data from other sources to provide
supplemental data to form a more complete view of the
Homework Gap. For example, analysis of each student’s
use of school-purchased education software at home
after-school hours could both determine usage trends and
be used as a proxy for connectivity.
23
Due to the interconnected nature of the factors that
contribute to a lack of broadband access and adoption and
those that cause the Homework Gap, policies and programs
that increase broadband access, adoption and use will also
contribute to a sustainable solution for closing the Homework
Gap. Policies and programs directed towards improving both
the availability of broadband and its adoption should be
pursued. This includes policies and programs that address
the digital divide and digital equity issues.
For example, the North Carolina General Assembly’s recent
establishment of the Growing Rural Economies with Access
to Technology (GREAT) Program designed to facilitate the
increased deployment of broadband to unserved areas
will contribute to closing the Homework Gap if access is
expanded to areas in which K-12 households live where it
was previously unavailable (S.L.2018-5).
Other policies to consider are increasing access to affordable
devices by allowing state surplus computers to be donated
to non-profit refurbishers dedicated to ending the digital
divide, programs that increase digital literacy skill class
offerings across the state, and implementing dig-once
and one-touch policies. Additional policy and program
recommendations are found in the State Broadband Plan.
Closing the Gap:
Recommendations to
Close North Carolina’s
Homework Gap
When combined, the survey’s findings and the potential solutions supplied by the
convening’s breakout groups result in six recommendations for policymakers, state
leaders, and stakeholders to undertake to close the Homework Gap in North Carolina.
The recommendations follow:
The State should establish a one-year pilot grant program
with the intention of creating a five-year program, or until
state-wide universal access is established, to provide grant
funding for mobile hotspot devices or Wi-Fi for school
buses for students without internet service, due to access or
affordability, at home.
While further research is needed to understand the full
scope of North Carolina’s Homework Gap, action to close
the gap cannot be postponed for the K-12 students who
currently fall into the Homework Gap. To date, numerous
individual schools and school districts across the state and
nation have completed successful pilot programs to close
the Homework Gap in their districts. Given the urgency of
the need, North Carolina should dedicate funding to enact
a time-limited grant program through which LEAs can
leverage state funding to develop or scale Homework Gap
solutions in their districts.
The grant program should be managed by BIO with
expertise provided from partners like DPI and the Friday
Institute. The grant will enable LEAs to apply for grant funds
from NCDIT to purchase 1) mobile hotspots devices, 2) service
for the hotspots and, if eligible 3) equipment and mobile
service to provide Wi-Fi on school buses.
Given that homework requiring internet access is regularly
assigned across all grade levels in North Carolina (New
Teacher Center, 2018), the grant program should serve grades
3 through 12 at minimum. However, since more high school
students are assigned homework requiring internet access
than middle and elementary students, the grant program
should serve high school students the first year and expand
to serve lower grade levels in subsequent years.
The State should dedicate funding to
establish a grant program housed in NC
BIO to close the Homework Gap.
The State should pursue the
implementation of policies and
programs that increase the availability,
adoption, and use of broadband.
1 2
24
The Homework Gap is a multi-faceted challenge and
will require collaboration between a host of partners
and stakeholders to solve. Building upon the work of
the Convening, the State should engage and convene
stakeholders from both the public and private sector to
design and implement innovative, sustainable solutions.
Any measure addressing the Homework Gap should take
into consideration all its causes. The survey results confirm
that the cost of service, the cost and access to devices, and
access to the service itself can all inhibit K-12 households
from adopting broadband in their homes. In addition,
the lack of access at home is intricately bound with the
household’s ability to effectively utilize the technology to
participate in the online activities that define the 21st
century.
As such, Homework Gap solutions should be designed to
address each of these barriers and utilize the subject matter
expertise of a range of organizations and partners.
While the survey provided valuable information about
North Carolina’s Homework Gap, further study is required to
understand its full size, scope and the degree to which each
factor contributing to it affects North Carolinians. Thus, the
BIO and partners should continue collaborative efforts to
survey the K-12 population to measure the Homework Gap,
its causes, and its effects.
To continue studying the Homework Gap, dedicated,
sustainable funding and continued and expanded
partnerships with education-focused organizations, school
districts and individual schools will be required. Research
and data analysis support from partners like the Friday
Institute will also be necessary. The BIO and partners should
also investigate alternative and cost-effective ways through
which the survey can be administered. Incorporating the
survey into existing surveys administered to K-12 populations
could prove an effective method of continuing the research
in the future.
Many of the most innovative solutions to closing the
Homework Gap have been designed by those closest to
the population affected by the Homework Gap — local
governments and local school districts. As the experts on
the Local Solutions panel at the Homework Gap Convening
demonstrated, closing the Homework Gap requires
innovation and a unique understanding of the community’s
population. In addition, North Carolina’s local governments
and school districts understand the unique needs of their
constituents and citizens. They should continue innovating
and testing new solutions and partner with the State to
implement best practices.
Despite numerous rounds of edits and pre-testing the survey,
the survey deployment revealed flaws in the instrument
design. For example, the online version of the survey did
not allow respondents to answer why they did not have
broadband service at home if they had first selected that
they had mobile service. Given the intrinsic difference
and capabilities of mobile vs. wireline service, questions
investigating respondent’s subscription to these two types of
broadband service should be separated in the future.
In addition, the methods used to distribute the survey were
unable to capture a true representation of North Carolina’s
demographics. Future survey distributions should devise a
method by which to reach a more representative sample of
North Carolina’s population.
The State should foster cross-sector
collaborations and public-private
partnerships to implement and sustain
multi-faceted solutions.
The State should continue to study the
Homework Gap.
The survey instrument and its
distribution should be modified to
garner more reliable results.
North Carolina’s local governments
and LEAs should continue to innovate
and partner with the State to close the
Homework Gap.
3 5
6
4
25
Conclusion
The North Carolina’s State Board of Education has six primary goals stated on its website.
The first is that “every student in the NC Public School System graduates from high school
prepared for work, further education and citizenship.” Many factors may impact the State
education system’s ability to reach this goal, among them is an inequity of access to the
opportunities and resources the internet provides. Should the Homework Gap not be
addressed in a systematic, comprehensive way, it will continue to grow. If its growth
continues unhampered, an increasing number of students impacted by it will not be
prepared for the work of the 21st
century. Neither will they be adequately prepared to
thrive in continuing education environments, or contribute to the well-being of their local,
national, and global communities.
As previously noted, the Homework Gap is a solvable issue.
Both research and the implementation of innovative pilot
programs across the state have proven that if strategic,
holistic solutions are implemented, the Homework Gap
can be closed. North Carolina has a long history of solving
seemingly intractable issues. Through dedicated, strategic
partnerships between the General Assembly, multiple
Governors and subject matter experts like the Friday
Institute, North Carolina led the country in ensuring every
school house in North Carolina has access to high-speed
broadband. Should a similar partnership and dedicated
effort to close the Homework Gap be undertaken, North
Carolina could again make history and be the first state to
close the Homework Gap for all its citizens.
26
Act to Protect Jobs and Investment by Regulating Local Government Competition. North Carolina General Assembly.
(2011). S.L. 2011-84
Current Operations Appropriations Act of 2018. North Carolina General Assembly. S.L. 2018-5. Section 337.1 (a). (2018).
Develop and Implement Digital Teaching and Learning Standards Act. North Carolina General Assembly.
S.L. 2013-11. (2013).
Digital divide. (n.d.) in Oxford Dictionary online.
Retrieved from: https://en.oxforddictionaries.com/definition/digital_divide
Federal Communications Commission. Fixed broadband deployment data from FCC Form 477. 2017.
Retrieved from https://www.fcc.gov/general/broadband-deployment-data-fcc-form-477
Federal Communications Commission. Internet access services: status as of December 31, 2016. (2018). Industry Analysis
and Technology Division, Wireline Competition Bureau. Retrieved from https://apps.fcc.gov/edocs_public/
attachmatch/DOC-349074A1.pdf
Friday Institute for Educational Innovation. North Carolina digital learning plan. (2015). Raleigh, NC: NC State University
College of Education. Retrieved from http://dlplan.fincsu.wpengine.com/wp-content/uploads/sites/11/2015/09/NC-
Digital-Learning-Detailed-Plan-9-14-15.pdf
Horrigan, J. (2015). The numbers behind the homework gap. Pew Research Center.
Retrieved from http://www.pewresearch.org/fact-tank/2015/04/20/the-numbers-behind-the-broadband-
homework-gap/
KewalRamani, A., Zhang, J., Wang, X., Rathbun, A., Corcoran, L., Diliberti, M., and Zhang, J. (2018). Student access to digital
learning resources outside of the classroom (NCES 2017-098). U.S. Department of Education. Washington,
DC: National Center for Education Statistics. Retrieved [date] from https://nces.ed.gov/pubsearch/pubsinfo.
asp?pubid=2017098
New Teacher Center. North Carolina teacher working conditions survey 2018. (2018)
Retrieved from https://ncteachingconditions.org/results/239
North Carolina Department of Information Technology. (2016, June) Connecting North Carolina: state broadband plan.
Retrieved from https://www.ncbroadband.gov/wp-content/uploads/2017/02/NC-Broadband-Plan_2017_Online_
FINAL_PNGs3www.pdf
Surplus Computers for Low-Income Students. North Carolina General Assembly. (2017). S.L. 2017-67
The Consortium for School Networking. Supporting students & families in out-of-school learning. (2018).
Retrieved from https://cosn.org/sites/default/files/2018%20Digital%20Equity%20Toolkit%20FINAL_0.pdf
Transition to Digital Learning Act. North Carolina General Assembly. S.L. 2013-12. (2013).
U.S. Census Bureau. American Community Survey Data. (2015).
Retrieved from https://www.census.gov/programs-surveys/acs/
U.S. Census Bureau. American Community Survey Data. (2016).
Retrieved from https://www.census.gov/programs-surveys/acs/
Wilson, K & Powers, R. Digital technology and internet access trends in North Carolina: 1999-2013. (2014).
East Carolina University.
References
27
Appendices
28
Instructions: You may use this stock email to contact your participants. Insert your
organization’s information into highlighted sections.
Dear Parents,
Nationally, 7 in 10 teachers assign homework that requires internet access. But an estimated five million
households with school-age children do not have internet access at home. Students that fall into this
“homework gap”—households where internet access is limited or unavailable—lag behind in education and
are less competitive in the workforce.
But as a parent of children in North Carolina’s K-12 schools you already know what happens when your
children and/or their classmates can’t meaningfully access the internet.
Many of you spend hours each week driving your children to a nearby McDonalds or Starbucks to use their
Wi-Fi because internet is not available to your house or it’s too expensive. Or trek to the local library multiple
times a week so your kids can use the computers because your digital device is broken, being used by one of
your other children, or you don’t have one at home because buying one doesn’t fit in your budget.
The State of North Carolina wants to help ensure no child in the K-12 schools falls into the homework gap.
But to do so, the State needs to know how widespread the homework gap is and potential challenges
students face in accessing digital resources.
To identify this data, our partners, the Broadband Infrastructure Office and the Friday Institute, are
conducting a survey of North Carolina households with K-12 students. We would like to encourage you to
take the survey so policy makers and education stakeholders can design solutions to this issue.
The anonymous, short survey is available in English and Spanish and can be found here K-12 Internet Access
at Home Survey (Encuesta de Accesso a Internet K-12 en el Hogar) or at below link. It remains open until
April 30, 2017.
Should you have any questions, concerns, or feedback, you can reach out to the Broadband Infrastructure
Office directly at: broadband@nc.gov or (919) 754-6695.
Thank you for your continued support of [INSERT YOUR ORGANIZATION’S NAME HERE], we appreciate all
you do.
	Sincerely,
	 [INSERT YOUR NAME HERE]
Survey Link: http://bit.ly/k12hwgap
APPENDIX A
Letter Accompanying
Survey for Parents
Form Email to Parents Asking Them to Participate in the Homework Gap Survey
29
APPENDIX B
Sample Homework Gap Blog or
Newsletter Post
Nationally, 7 in 10 teachers assign homework that
requires internet access. But an estimated five million
households with school-age children do not have internet
access at home. Students that fall into this “homework
gap”—households where internet access is limited
or unavailable—lag behind in education and are less
competitive in the workforce.
But if you’re a parent with children in North Carolina’s
K-12 schools you already know what happens when your
children and/or their classmates can’t meaningfully access
the internet.
Many of you spend hours each week driving your children
to a nearby McDonalds or Starbucks to use their Wi-Fi
because internet is not available to your house or it’s too
expensive. Or trek to the local library multiple times a
week so your kids can use the computers because your
digital device is broken, being used by one of your other
children, or you don’t have one at home because buying
one doesn’t fit in your budget.
The State of North Carolina wants to help ensure no child
in the K-12 schools falls into the homework gap. But to
do so, the State needs to know how widespread the
homework gap is and potential challenges students face
in accessing digital resources.
To identify this data, our partners, the Broadband
Infrastructure Office and the Friday Institute, are
conducting a survey of North Carolina households with
K-12 students. We would like to encourage you to take the
survey so policy makers and education stakeholders can
design solutions to this issue.
The anonymous, short survey is available in English and
Spanish and can be found here K-12 Internet Access at
Home Survey (Encuesta de Accesso a Internet K-12 en el
Hogar) (or at below link). It remains open until April 30, 2017.
Should you have any questions, concerns, or feedback,
you can reach out to the Broadband Infrastructure Office
directly at: broadband@nc.gov or (919) 754-6695.
Survey Link: http://bit.ly/k12hwgap
30
APPENDIX C
K-12 Internet Access At Home Survey
K-12 INTERNET ACCESS AT HOME SURVEY
This survey is for North Carolina parents/guardians of students in grades K-12.
The purpose of the survey is to determine how access to the internet
outside of school impacts NC’s K-12 students’ ability to complete homework.
Results will be used to inform further research and policy suggestions for assisting
households and communities where internet access is unavailable or inadequate.
Your responses are anonymous and you are free to decline participation at any time.
The survey will take 5–10 minutes to complete.
Thank you in advance for your participation. Your input will help inform
the State as we work to increase internet access throughout the state.
Should you have any questions or concerns please contact the Broadband Infrastructure Office:
email: broadband@nc.gov | phone: (919) 754-6695.
Broadband Infrastructure Office, North Carolina Department of Information Technology
broadband@nc.gov | 919 754 6695
31
APPENDIX C
Accesso A Internet K-12 En El Hogar
ACCESO A INTERNET K-12 EN EL HOGAR
Esta encuesta es para los padres/guardianes de estudiantes en los grados
K-12 de Carolina del Norte. El propósito de la encuesta es determinar cómo el
acceso a Internet fuera de la escuela que afecta la habilidad de los estudiantes
de K-12 de NC para completar la tarea.
Los resultados se utilizarán para informar más investigaciones y sugerencias
de políticas para ayudar a hogares y comunidades donde el acceso a Internet no está
disponible o es inadecuado.
Sus respuestas son anónimas y usted es libre de rechazar la participación en cualquier
momento. La encuesta tomará 5-10 minutos para completar.
Gracias por tu participación por adelantado. Su contribución ayudará a informar al Estado
como mientras trabajamos para aumentar el acceso a Internet en todo el estado.
Si tiene algunas preguntas o inquietudes, comuníquese con la oficina de la Oficina de
Infraestructura de Banda Ancha:
Correo electrónico: broadband@nc.gov | teléfono: (919) 754-6695
Broadband Infrastructure Office, North Carolina Department of Information Technology
broadband@nc.gov | 919 754 6695
32
PREGUNTA 1
¿Ud tiene acceso a internet en su hogar?
)) Sí, pago una suscripción mensual por internet.
)) Sí, tengo acceso pero no pago una suscripción.
)) No, no tengo acceso.
Si respondió “No” a la pregunta 1, pase a la pregunta 3.
PREGUNTA 2
¿Cómo accede Ud. a Internet en su hogar?
Marque todas las que apliquen.
)) Plan de datos móviles para un teléfono o dispositivo móvil
(e.g., Verizon, Sprint, etc.)
)) Línea de abonado digital (DSL) (e.g., CenturyLink, Frontier,
etc.)
)) Módem de cable (e.g., Time Warner. etc.)
)) Fibra óptica (e.g., AT&T U-verse, etc.)
)) Servicio de Internet por Satélite (HughesNet, etc.)
)) Dial-up
)) No estoy seguro
PREGUNTA 3
¿Cuál es la razón principal por la que actualmente no
TIENE ACCESO a Internet en su casa?
)) No le interesa
)) Acceso a Internet no es disponible en mi área
)) Internet es muy lento
)) Mi dispositivo digital no se conecta al Internet
)) Acceso a Internet en hogar es muy caro
)) Yo uso el Internet en otros lugares
)) Tengo preocupaciones sobre de la privacidad en línea
)) Otros (por favor especificar) ____________________
QUESTION 1
Do you currently have internet access at home?
)) Yes, I pay a monthly subscription for internet.
)) Yes, I have access but do not pay for a subscription.
)) No, I do not have access.
If you answered “No” to question 1, please proceed to
question 3.
QUESTION 2
How do you access the internet at home?
Check all that apply.
)) Cellular data plan (e.g., Verizon, Sprint, etc.)
)) Digital Subscriber Line (DSL) (e.g., CenturyLink, Frontier,
etc.)
)) Cable modem (e.g., Time Warner, etc.)
)) Fiber-Optic (e.g., AT&T U-verse, etc.)
)) Satellite Internet Service (HughesNet, etc.)
)) Dial-up
)) Not Sure
QUESTION 3
What is the main reason you DO NOT CURRENTLY HAVE
internet access in your home?
)) Don’t see the need for it
)) Not available in my area
)) Internet too slow
)) My device does not connect
)) Too expensive
)) I use the internet somewhere else
)) Concerns about online privacy
Other (please specify) ____________________
33
DIGITAL DEVICE DEFINITION
A digital device is an electronic tool that can receive, store,
process, or send digital information. The picture below
provides examples of digital devices.
DEFINICIÓN DE DISPOSITIVO DIGITAL
Un dispositivo digital es un dispositivo electrónico que puede
recibir, almacenar, procesar o enviar información digital. La
siguiente imagen muestra ejemplos de dispositivos digitales.
QUESTION 4
How many of the following digital devices do you use in
your home?
0 1 2 3 4+
Smart phone ) ) ) ) )
Desktop ) ) ) ) )
Laptop ) ) ) ) )
Tablet/e-reader (e.g., Kindle,
Ipad, etc.)
) ) ) ) )
Smart TV (e.g., Android TV,
Samsung Smart Hub, etc.)
) ) ) ) )
Streaming Device (e.g.,
Chromecast, Apple TV, etc.)
) ) ) ) )
Gaming System (e.g., XBOX,
Playstation, Wii, etc.)
) ) ) ) )
Other ) ) ) ) )
If you DID NOT answer “0” for all of the items in question 4,
please proceed to question 6.
PREGUNTA 4
¿Cuántos de los siguientes dispositivos digitales usa en
su hogar?
0 1 2 3 4+
Teléfono inteligente ) ) ) ) )
Computadora de escritorio ) ) ) ) )
Laptop ) ) ) ) )
Tableta/lector digital (e.g.,
Kindle, Ipad, etc.)
) ) ) ) )
Televisión inteligente/Smart
TV (e.g., Android TV, Samsung
Smart Hub, etc.)
) ) ) ) )
Dispositivo de streaming (e.g.,
Chromecast, Apple TV, etc.)
) ) ) ) )
Videojuegos y Consolas (e.g.,
XBOX, Playstation, Wii, etc.)
) ) ) ) )
Otros ) ) ) ) )
Si NO respondió “0” para todos los elementos en pregunta
4, pase a pregunta 6.
34
QUESTION 5
What is the main reason you DO NOT CURRENTLY HAVE
a digital device in your home?
)) Don’t see the need for it
)) My current device(s) don’t work
)) Too expensive
)) I use computer/devices somewhere else
)) Too difficult to use
)) Concerns about online privacy
)) Other (Please Specify) ____________________
QUESTION 6
Thinking about your own use of digital devices, HOW
COMFORTABLE ARE YOU with using them to do the
following tasks:
VERY
UNCOMFORTABLE
SOMEWHAT
UNCOMFORTABLE
NOTSURE
SOMEWHAT
COMFORTABLE
VERY
COMFORTABLE
Help my children with
homework
) ) ) ) )
To pay bills ) ) ) ) )
Online banking ) ) ) ) )
For work ) ) ) ) )
To shop online ) ) ) ) )
To access personal
information (e.g., medical
records, taxes, etc.)
) ) ) ) )
Job search ) ) ) ) )
Entertainment (e.g.,
watching movies, videos,
listening to music, etc.)
) ) ) ) )
QUESTION 7
Overall, HOW COMFORTABLE ARE YOUR CHILDREN with
using a digital device for homework?
VERY
UNCOMFORTABLE
SOMEWHAT
UNCOMFORTABLE
NOTSURE
SOMEWHAT
COMFORTABLE
VERY
COMFORTABLE
) ) ) ) )
PREGUNTA 5
¿Cuál es la razón principal por la que Ud. ACTUALMENTE
NO TIENE un dispositivo digital en
su hogar?
)) No le interesa
)) Mis dispositivos actuales no funcionan
)) Las computadoras y otros dispositivos digitales son
muy caros
)) Yo uso dispositivos digitales en otros lugares
)) Son muy difíciles de usar
)) Tengo preocupaciones sobre de la privacidad en línea
)) Otro (Por favor especificar) ____________________
PREGUNTA 6
Pensando en su propio uso de dispositivos digitales, ¿QUÉ
TAN FACIL CREE UD. que es usar un dispositivo digital al:
TANDIFICIL
ALGO
DIFICIL
NOESTOY
SEGURO
ALGOFÁCIL
TANFÁCIL
Ayudar a sus hijos con la
tarea
) ) ) ) )
Pagar cuentas ) ) ) ) )
Banca en línea ) ) ) ) )
Para trabajo ) ) ) ) )
Comprar de productos en
línea
) ) ) ) )
Accesar a información
personal (por ejemplo,
registros médicos,
impuestos, etc.)
) ) ) ) )
Buscando trabajo ) ) ) ) )
Actividades sociales (por
ejemplo, ver películas o
videos, escuchar música, etc.)
) ) ) ) )
PREGUNTA 7
En general, ¿QUÉ TAN FACIL SON PARA SUS HIJOS el uso
de un dispositivo digital para la tarea?
TANDIFICIL
ALGO
DIFICIL
NOESTOY
SEGURO
ALGOFÁCIL
TANFÁCIL
) ) ) ) )
35
QUESTION 8
How often do YOUR CHILDREN use their digital device
for homework?
DAILY
2-3
TIMES
PER
WEEK
ONCE
A
WEEK
1-2
TIMES
PER
MONTH
DOES
NOT
ACCESS
NOT
SURE
) ) ) ) ) )
QUESTION 9
How often do YOUR CHILDREN use the following
places in your community to access free internet for
completing homework? DAILY
2-3TIMESPERWEEK
ONCEAWEEK
1-2TIMESPERMONTH
DOESNOTACCESS
NOTSURE
Public Library (e.g., County,
College/University)
) ) ) ) ) )
Restaurants (e.g., Starbucks,
McDonalds, etc.)
) ) ) ) ) )
Retailers (e.g., Apple Store,
Barnes & Noble, etc.)
) ) ) ) ) )
Other Public Institutions
(e.g., community center,
park, museum, etc.)
) ) ) ) ) )
Someone else's home (e.g.,
classmate, friend, family
member, etc.)
) ) ) ) ) )
Other: _________________
(please specify)
) ) ) ) ) )
PREGUNTA 8
¿Con qué frecuencia SUS HIJOS usan un dispositivo
digital para la tarea?
DAILY
2-3
TIMES
PER
WEEK
ONCE
A
WEEK
1-2
TIMES
PER
MONTH
DOES
NOT
ACCESS
NOT
SURE
) ) ) ) ) )
PREGUNTA 9
¿Con qué frecuencia usan SUS HIJOS los siguientes
lugares en su comunidad para acceder a Internet gratis
para completar la tarea?
DIARIAMENTE
2-3VECESPORSEMANA
UNAVEZPORSEMANA
1-2VECESPORMES
NOTIENEACCESO
NOESTOYSEGURO
Biblioteca Pública (por
ejemplo, Condado, Colegio/
Universidad)
) ) ) ) ) )
Restaurantes (e.g., Starbucks,
McDonalds, etc.)
) ) ) ) ) )
Minoristas (e.g., Apple Store,
Barnes & Noble, etc.)
) ) ) ) ) )
Otrasinstitucionespúblicas(por
ejemplo, centro comunitario,
parque, museo, etc.)
) ) ) ) ) )
El hogar de otra persona
(por ejemplo, compañero,
amigo, familiar, etc.)
) ) ) ) ) )
Otro: __________________
(por favor especificar)
) ) ) ) ) )
36
QUESTION 10
Some schools provide specific programs to support
digital learning for students. These programs include
digital device rentals from the school for students to
use at home; or extended computer lab hours that
allow students to use the computer lab before and after
the school’s regular hours. Do YOUR CHILDREN take
advantage of any of the following resources?
YES
NO
NOTSURE
NOTAVAILABLE
ATSCHOOL
School-Provided Rental
Digital Device (e.g., laptop,
tablet, hotspot, etc.)
) ) ) )
Extended-Day Computer
Lab Internet Access (e.g.,
before or after school
programs)
) ) ) )
Other: _________________
(please specify)
) ) ) )
QUESTION 11
Please identify the number of children in K-12 that reside
in your home:
0 1 2 3 4+
Elementary School
(K-5th
grade) or (K-6th
grade)
) ) ) ) )
Middle School/ Jr High
(6-8th
grade) or (7-9th
grade)
) ) ) ) )
High School
(9-12th
grade) or (10-12th
grade)
) ) ) ) )
QUESTION 12
What type of school(s) are your children currently
enrolled in?
Check all that apply.
)) Public School (Including Traditional, Charter, Early
College, Magnet. etc.)
)) Private School
)) Other (Please Specify) ____________________
PREGUNTA 10
Algunas escuelas ofrecen programas específicos para
apoyar el aprendizaje digital para los estudiantes. Estos
programas incluyen dispositivos digitales de la escuela
para que los estudiantes los usen su hogar; O horas
extendidas del laboratorio de computadora que permiten
a estudiantes utilizar el laboratorio de computadora antes
y después de las horas regulares de la escuela. ¿Aprovechan
SUS HIJOS de cualquiera de los siguientes recursos?
SÍ
NO
NOESTOY
SEGURO
INDISPONIBLE
ENLAESCUELA
Dispositivo digital de
alquiler proporcionado
por la escuela (e.g.,
laptop, tableta, punto de
acceso, etc.)
) ) ) )
Laboratorio computación
de día extendido Acceso
a Internet (por ejemplo,
antes o después de los
programas escolares)
) ) ) )
Otro: __________________
(por favor especificar)
) ) ) )
PREGUNTA 11
Por favor, identifique el número de hijos en K-12 que
residen en su hogar:
0 1 2 3 4+
Escuela Primaria
(grado K-5) o (grado K-6)
) ) ) ) )
Escuela Intermedia/ Jr High
(grado 6-8) o (grado 7-9)
) ) ) ) )
Escuela Secundaria
(grado 9-12) o (grado 10-12)
) ) ) ) )
PREGUNTA 11
¿En qué tipo de escuela están sus hijos actualmente
matriculados?
Marque todas las que apliquen.
)) Escuela Pública (Incluyendo tradicional, Carta, Colegio
Temprano, Magnet. Etc.)
)) Escuela privada
)) Otros (Por favor especificar) ____________________
37
QUESTION 13
Please select your county and write your zip
code below.
Zip: __ __ __ __ __
QUESTION 14
What is your sex?
)) Female
)) Male
)) Other
QUESTION 15
What is your race/ethnicity?
select all that apply
)) Asian/Pacific Islander
)) Black/African American
)) Hispanic/Latino
)) Native American/American Indian
)) White
)) Other
PREGUNTA 12
Por favor seleccione su condado y escriba su código
postal abajo.
Código Postal: __ __ __ __ __
PREGUNTA 14
¿Cuál es su sexo?
)) Femenino
)) Masculino
)) Otros
PREGUNTA 15
Por favor especifique su origen étnico(raza):
seleccione todas las que apliquen
)) Asia/Islas del Pacífico
)) Negro/Afroamericano
)) Hispano/Latino
)) Nativo Americano/Indio Americano
)) Blanco
)) Otros
Alamance Chowan Guilford Mitchell Rutherford
Alexander Clay Halifax Montgomery Sampson
Alleghany Cleveland Harnett Moore Scotland
Anson Columbus Haywood Nash Stanly
Ashe Craven Henderson New Hanover Stokes
Avery Cumberland Hertford Northampton Surry
Beaufort Currituck Hoke Onslow Swain
Bertie Dare Hyde Orange Transylvania
Bladen Davidson Iredell Pamlico Tyrrell
Brunswick Davie Jackson Pasquotank Union
Buncombe Duplin Johnston Pender Vance
Burke Durham Jones Perquimans Wake
Cabarrus Edgecombe Lee Person Warren
Caldwell Forsyth Lenoir Pitt Washington
Camden Franklin Lincoln Polk Watauga
Carteret Gaston Macon Randolph Wayne
Caswell Gates Madison Richmond Wilkes
Catawba Graham Martin Robeson Wilson
Chatham Granville McDowell Rockingham Yadkin
Cherokee Greene Mecklenburg Rowan Yancey
38
QUESTION 16
What is your household income?
)) Less than $10,000
)) $10,000 to $14,999
)) $15,000 to $24,999
)) $25,000 to $34,999
)) $35,000 to $49,999
)) $50,000 to $74,999
)) $75,000 to $99,999
)) $100,000 to $149,999
)) $150,000 to $199,999
)) $200,000 or more
QUESTION 17
What is your highest degree or level of school
completed?
)) Less than high school
)) High school diploma (or GED)
)) Some college
)) Associate’s degree (e.g., AA, AS)
)) Bachelor’s degree (e.g., BA, BS)
)) Master’s degree (e.g., MA, MS, MBA, MEd)
)) Professional degree beyond a bachelor’s degree
(e.g., MD, DDS, LLB, JD)
)) Doctorate degree (e.g., PhD, EdD)
PREGUNTA 16
Por favor, seleccione su rango de ingresos:
)) Menos de $10,000
)) $10,000 to $14,999
)) $15,000 to $24,999
)) $25,000 to $34,999
)) $35,000 to $49,999
)) $50,000 to $74,999
)) $75,000 to $99,999
)) $100,000 to $149,999
)) $150,000 to $199,999
)) $200,000 o más
PREGUNTA 17
¿Cuál es su grado más alto o nivel de escuela
completado?
)) Menos que escuela secundaria
)) Diploma de escuela secundaria (o GED)
)) Alguna colegio
)) Grado de asociado (e.g., AA, AS)
)) Licenciatura (e.g., BA, BS)
)) Máster (e.g., MA, MS, MBA, MEd)
)) Título profesional más allá de una licenciatura
(e.g., MD, DDS, LLB, JD)
)) Doctorado (e.g., PhD, EdD)
39
APPENDIX D
Research Questions and Analysis
NOTE: research questions are numbered and in bold,
analysis is labeled “Analysis”
RESEARCH QUESTION 1
Are the respondents representative of the NC K-12
school population as a whole (i.e., can we assume
any lessons learned from the data apply to the state as
a whole?)
No. For Demographic analysis see tables 65-67.
RESEARCH QUESTION 2
Was there statistically significant:
a. Difference in completed survey on paper vs. online	
	 and checked “No” to Question 1?
ANALYSIS
Dichotomized Question 1 into two groups, those with and
those without internet access at home. Built a frequency
table illustrating the extent to which people who completed
the survey online differed from those who completed the
survey on paper, with regard to their internet access at home.
TABLE 1
Online v. Paper Survey Internet Access
INTERNET
ACCESS
NO INTERNET
ACCESS
Online 89.3% 10.6%
Paper 89.1% 10.9%
χ2 (1, N = 9064) = .032, p = .86. With Yates’ continuity correction
χ2 (1, N = 9064) = .058, p = .81. Uncorrected
People who completed the survey online as opposed to on
paper did not differ in the extent to which they reported
having internet access or not in their homes.
b. Relationship between how people answered 		
	 Question 1 and how they answered Question 4?
i. Internet access – number of each device (e.g, 		
	 smart phone, desktop, laptop etc.) used in home. 	
	 Question 4 scale: 0,1,2,3,4+
ANALYSIS
TABLE 2
Relationship Between Access at Home and Ownership of
Smart Phone Devices; N=8,653
0 1 2 3 4+
Paid Access 1.8 % 10.4 % 34.7 % 27 % 26.2 %
Free Access 4.7 % 23 % 26.7 % 19.3 % 26.4 %
No Access 9 % 29.2 % 33.6 % 15.4 % 12.8 %
Kruskal-Wallis H test demonstrated that there was a
statistically significant difference in the number of smart
phones individuals reported owning based on their internet
access at home χ2 (2, N=8653) = 326.91, p<.001. A Dunn’s
post hoc analysis with a Bonferroni correction demonstrated
that these differences were statistically significant at each
pairwise comparison (p<.001).
TABLE 3
Relationship Between Access at Home and Ownership of
Desktop Devices; N=7,501
0 1 2 3 4+
Paid Access 47.5 % 42.1 % 7.2 % 1.9 % 1.3 %
Free Access 56 % 33.7 % 4.8 % 4 % 1.6 %
No Access 78.9 % 19.1 % 0.7 % 0.7 % 0.7 %
Kruskal-Wallis H test demonstrated that there was a
statistically significant difference in the number of desktops
individuals reported owning based on their internet access
at home χ2 (2, N = 7501) = 256.95, p<.001. A Dunn’s post hoc
analysis with a Bonferroni correction demonstrated that
these differences were statistically significant in the free
access-no access and paid access and no access comparisons
(p<.001), and they were statistically significant in the free
access-paid access comparison (p<.05).
40
TABLE 4
Relationship between Access at Home and Ownership of
Laptop Devices; N=8,289
0 1 2 3 4+
Paid Access 9.3 % 38.7 % 29.2 % 14.3 % 8.4 %
Free Access 19.8 % 41.8 % 20.5 % 9.9 % 8.1 %
No Access 51.4 % 35.4 % 8.7 % 3.2 % 1.3 %
Kruskal-Wallis H test demonstrated that there was a
statistically significant difference in the number of laptops
individuals reported owning based on their internet access
at home χ2 (2, N = 8289) = 727.59, p<.001. A Dunn’s post
hoc analysis with a Bonferroni correction demonstrated
that these differences were statistically significant at each
pairwise comparison (p<.001).
TABLE 5
Relationship Between Access at Home and Ownership
of Tablet Devices; N=8,257
0 1 2 3 4+
Paid Access 9.5 % 30.2 % 28.9 % 16.7 % 14.6 %
Free Access 28.3 % 33.5 % 19.9 % 7.7 % 10.7 %
No Access 42.9 % 30.6 % 16.1 % 6.6 % 3.8 %
Kruskal-Wallis H test demonstrated that there was a
statistically significant difference in the number of tablets
individuals reported owning based on their internet access
at home χ2 (2, N = 8257) = 527.38, p<.001. A Dunn’s post
hoc analysis with a Bonferroni correction demonstrated
that these differences were statistically significant at each
pairwise comparison (p<.001).
TABLE 6
Relationship Between Access at Home and Ownership of
Smart TV Devices; N=7,675
0 1 2 3 4+
Paid Access 37.2 % 34.2 % 16.7 % 6.6 % 5.3 %
Free Access 44.8 % 27.6 % 10.3 % 9.2 % 8 %
No Access 66.9 % 20.2 % 6.8 % 3.5 % 2.6 %
Kruskal-Wallis H test demonstrated that there was a
statistically significant difference in the number of smart TVs
individuals reported owning based on their internet access
at home χ2 (2, N= 7675) = 218.20, p<.001. A Dunn’s post hoc
analysis with a Bonferroni correction demonstrated that
these differences were statistically significant in the free
access-no access comparison and the paid access-no access
comparison (p<.001). However, there was not a significant
difference in the number of smart TVs owned by individuals
with paid internet access as opposed to individuals with free
internet access (p=.28).
TABLE 7
Relationship Between Access at Home and Ownership of
Streaming Device; N=7,218
0 1 2 3 4+
Paid Access 48.1 % 30.5 % 13.1 % 4.5 % 3.7 %
Free Access 65.4 % 17.9 % 11 % 2 % 3.7 %
No Access 91.5 % 6.1 % 1.3 % 0.6 % 0.6 %
Kruskal-Wallis H test demonstrated that there was a
statistically significant difference in the number of streaming
devices individuals reported owning based on their internet
access at home χ2 (2, N = 7218) = 461.94, p<.001. A Dunn’s
post hoc analysis with a Bonferroni correction demonstrated
that these differences were statistically significant at each
pairwise comparison (p<.001).
TABLE 8
Relationship Between Access at Home and Ownership of
Gaming Systems; N=7,974
0 1 2 3 4+
Paid Access 22.5 % 44.4 % 20.7 % 7.4 % 4.9 %
Free Access 23.8 % 37.2 % 19.3 % 10 % 9.7 %
No Access 43.8 % 38.8 % 9.6 % 3.4 % 4.4 %
Kruskal-Wallis H test demonstrated that there was a statistically
significant difference in the number of gaming systems
individuals reported owning based on their internet access
at home χ2 (2, N = 7974) = 165.77, p<.001. A Dunn’s post hoc
analysis with a Bonferroni correction demonstrated that these
differences were statistically significant in the free access-no
access comparison and the paid access-no access comparison
(p<.001). However, there was not a significant difference in the
number of smart TVs owned by individuals with paid internet
access as opposed to individuals with free internet access (p=.17).
TABLE 9
Relationship Between Access At Home and Ownership
of ‘Other’ Types of Devices; N=2,182
0 1 2 3 4+
Paid Access 89.3 % 5.7 % 2.8 % 1 % 1.1 %
Free Access 83.1 % 9 % 2.2 % 1.1 % 4.5 %
No Access 94 % 2.8 % 1.9 % 0 % 1.3 %
Kruskal-Wallis H test demonstrated that there was a
statistically significant difference in the number of other
devices individuals reported owning based on their internet
access at home χ2 (2, N= 2182) = 10.82, p<.01. A Dunn’s post
hoc analysis with a Bonferroni correction demonstrated that
these differences were statistically significant in the free
access-no access comparison (p<.01) and the paid access-
no access comparison (p<.001). However, there was not a
significant difference in the number of smart TVs owned
by individuals with paid internet access as opposed to
individuals with free internet access (p=.09).
41
c. Relationship between how people answered 		
	 Question 1 and how they answered Question 5?
i. Internet access – Main reason for NOT having a 		
	 digital device in home
TABLE 10
Relationship Between Access at Home and Reason for
Not Owning a Digital Device; N=36
PAIDACCESS
FREEACCESS
NOACCESS
Don’t see the need for it 33.3% 0.0% 66.7%
My current device(s)
don’t work
100.0% 0.0% 0.0%
Too expensive 8.0% 8.0% 84.0%
I use computer/devices
somewhere else
0.0% 0.0% 100.0%
Too difficult to use 0.0% 0.0% 0.0%
Concerns about online
privacy
0.0% 0.0% 100.0%
Other 0.0% 0.0% 100.0%
Note: Sample sizes were not large enough to conduct statistical tests.
d. Relationship between how people answered 		
	 Question 1 and how they answered Question 6?
i. Internet access – comfort using digital devices for	
	 various tasks
ANALYSIS
TABLE 11
Relationship Between At Home Access and
Comfortability with Using Digital Devices to Help
Children with Schoolwork; N=7,995
VERY
UNCOMFORTABLE
SOMEWHAT
UNCOMFORTABLE
SOMEWHAT
COMFORTABLE
VERY
COMFORTABLE
Paid Access 9 % 6.1 % 22.3 % 62.6 %
Free Access 13.9 % 7.4 % 29.2 % 49.5 %
No Access 16.5 % 11.3 % 28.1 % 44.1 %
Kruskal-Wallis H test demonstrated that there was a
statistically significant difference in the level of comfort
individuals felt with regard to using their devices to help
their children with schoolwork based on their internet
access at home χ2 (2, N = 7995) = 124.13, p<.001. A Dunn’s
post hoc analysis with a Bonferroni correction demonstrated
that these differences were statistically significant in the
free access-paid access comparison and the no access-
paid access comparison (p<.001). However, there was not a
significant difference between individuals with no internet
access at home and individuals with free internet access at
home with regard to the level of comfort they had using their
devices to help their children with schoolwork (p=.11).
NOTE ABOUT ANALYSIS
For each of these tables and analyses within research questions
D and E, the researcher re-scaled the measure to only include
response options 1,2, 4, and 5. 4 and 5 are represented by 3 and
4 in the tables displayed here.
In other words, the tables are scaled as follows, 1=”very
uncomfortable”, 2=”somewhat uncomfortable”, 3=”somewhat
comfortable”, 4=”very comfortable”.
42
TABLE 12
Relationship Between At Home Access and Comfortability
with Using Digital Devices to Pay Bills; N=8,012
VERY
UNCOMFORTABLE
SOMEWHAT
UNCOMFORTABLE
SOMEWHAT
COMFORTABLE
VERY
COMFORTABLE
Paid Access 11 % 4.9 % 18.1 % 65.9 %
Free Access 24.9 % 8.1 % 25.9 % 41.1 %
No Access 25.4 % 12 % 29.3 % 33.3 %
Kruskal-Wallis H test demonstrated that there was a
statistically significant difference in the level of comfort
individuals felt with regard to using their devices to pay
their bills based on their internet access at home χ2 (2, N
= 8012) = 369.75, p<.001. A Dunn’s post hoc analysis with a
Bonferroni correction demonstrated that these differences
were statistically significant in the free access-paid access
comparison and the no access-paid access comparison
(p<.001). However, there was not a significant difference
between individuals with no internet access at home and
individuals with free internet access at home with regard to
the level of comfort they had using their devices to help their
children with schoolwork (p=.10).
TABLE 13
Relationship Between At Home Access and
Comfortability with Using Digital Devices to Conduct
Online Banking; N=7,887
VERY
UNCOMFORTABLE
SOMEWHAT
UNCOMFORTABLE
SOMEWHAT
COMFORTABLE
VERY
COMFORTABLE
Paid Access 12.1 % 4.8 % 17.9 % 65.2 %
Free Access 27.7 % 10.7 % 21.5 % 40.1 %
No Access 30.7 % 12.1 % 25.5 % 31.7 %
Kruskal-Wallis H test demonstrated that there was a
statistically significant difference in the level of comfort
individuals felt with regard to using their devices for online
banking based on their internet access at home χ2 (2, N =
7887) = 399.40, p<.001. A Dunn’s post hoc analysis with a
Bonferroni correction demonstrated that these differences
were statistically significant in the free access-paid access
comparison and the no access-paid access comparison
(p<.001). However, there was not a significant difference
between individuals with no internet access at home and
individuals with free internet access at home with regard to
the level of comfort they had using their devices for online
banking (p=.07).
TABLE 14
Relationship Between At Home Access and Comfortability
with Using Digital Devices for Work; N=7,761
VERY
UNCOMFORTABLE
SOMEWHAT
UNCOMFORTABLE
SOMEWHAT
COMFORTABLE
VERY
COMFORTABLE
Paid Access 9 % 2.5 % 13.7 % 74.7 %
Free Access 14.7 % 5.6 % 23.4 % 56.3 %
No Access 17.7 % 8.3 % 27.4 % 46.7 %
Kruskal-Wallis H test demonstrated that there was a
statistically significant difference in the level of comfort
individuals felt with regard to using their devices for work
based on their internet access at home χ2 (2, N=7761) =
263.65, p<.001. A Dunn’s post hoc analysis with a Bonferroni
correction demonstrated that these differences were
statistically significant in the free access-paid access
comparison and the no access-paid access comparison
(p<.001), and they were significant in the free access-no
access comparison (p<.05).
TABLE 15
Relationship Between At Home Access and
Comfortability with Using Digital Devices to Shop;
N=8,065
VERY
UNCOMFORTABLE
SOMEWHAT
UNCOMFORTABLE
SOMEWHAT
COMFORTABLE
VERY
COMFORTABLE
Paid Access 9 % 4.5 % 19.3 % 67.2 %
Free Access 15.2 % 10.3 % 29.9 % 44.6 %
No Access 24.5 % 13.3 % 31.6 % 30.6 %
Kruskal-Wallis H test demonstrated that there was a
statistically significant difference in the level of comfort
individuals felt with regard to using their devices for online
shopping based on their internet access at home χ2 (2, N
= 8065) = 461.05, p<.001. A Dunn’s post hoc analysis with a
Bonferroni correction demonstrated that these differences
were statistically significant at each pairwise comparison
(p<.001).
43
TABLE 16
Relationship Between At Home Access and
Comfortability with Using Digital Devices to Access
Personal Information; N=7,712
VERY
UNCOMFORTABLE
SOMEWHAT
UNCOMFORTABLE
SOMEWHAT
COMFORTABLE
VERY
COMFORTABLE
Paid Access 11.2 % 8.4 % 26.2 % 54.2 %
Free Access 19.1 % 15.7 % 28.7 % 36.5 %
No Access 32.3 % 18.6 % 23.9 % 25.2 %
Kruskal-Wallis H test demonstrated that there was a
statistically significant difference in the level of comfort
individuals felt with regard to using their devices to access
personal information (e.g., medical records, taxes, etc.)
based on their internet access at home χ2 (2, N = 7712) =
353.38, p<.001. A Dunn’s post hoc analysis with a Bonferroni
correction demonstrated that these differences were
statistically significant at each pairwise comparison (p<.001).
TABLE 17
Relationship Between At Home Access and
Comfortability with Using Digital Devices for Job
Searching; N=7,549
VERY
UNCOMFORTABLE
SOMEWHAT
UNCOMFORTABLE
SOMEWHAT
COMFORTABLE
VERY
COMFORTABLE
Paid Access 8.6 % 3.4 % 20.9 % 67.1 %
Free Access 11.1 % 9.1 % 24.2 % 55.6 %
No Access 14.7 % 8.8 % 32.5 % 44 %
Kruskal-Wallis H test demonstrated that there was a
statistically significant difference in the level of comfort
individuals felt with regard to using their devices for job
searching based on their internet access at home χ2 (2, N
= 7549) = 162.45, p<.001. A Dunn’s post hoc analysis with a
Bonferroni correction demonstrated that these differences
were statistically significant in the free access-paid access
comparison and the no access-paid access comparison
(p<.001), and they were significant in the free access-no
access comparison (p<.01).
TABLE 18
Relationship Between At Home Access and
Comfortability with Using Digital Devices for
Entertainment; N=8,014
VERY
UNCOMFORTABLE
SOMEWHAT
UNCOMFORTABLE
SOMEWHAT
COMFORTABLE
VERY
COMFORTABLE
Paid Access 8.1 % 3.3 % 18.4 % 70.3 %
Free Access 10.2 % 5.1 % 17.4 % 67.2 %
No Access 13.9 % 11 % 28.8 % 46.3 %
Kruskal-Wallis H test demonstrated that there was a
statistically significant difference in the level of comfort
individuals felt with regard to using their devices for
entertainment (e.g., watching movies, videos, listening to
music, etc.) based on their internet access at home χ2 (2, N
= 8014) = 181.83, p<.001. A Dunn’s post hoc analysis with a
Bonferroni correction demonstrated that these differences
were statistically significant in the free access-no access
comparison and the no access-paid access comparison
(p<.001). However, there was not a significant difference
between individuals with free internet access at home and
individuals with paid internet access at home with regard
to the level of comfort they had using their devices for
entertainment (p=.34).
e. Relationship between how people answered 		
	 Question 1 and how they answered Question 7?
TABLE 19
Relationship Between at Home Access and
Respondents’ Children’s Comfort Using Digital Device
for Homework; N=7,798
VERY
UNCOMFORTABLE
SOMEWHAT
UNCOMFORTABLE
SOMEWHAT
COMFORTABLE
VERY
COMFORTABLE
Paid Access 7.2 % 5.8 % 27.4 % 59.6 %
Free Access 10 % 9.1 % 27.4 % 53.5 %
No Access 12.1 % 8.7 % 30.8 % 48.4 %
Kruskal-Wallis H test demonstrated that there was a
statistically significant difference in the level of comfort
individuals reported that their children felt with using a
digital device for homework based on their internet access
at home χ2 (2, N = 7798) = 46.36, p<.001. A Dunn’s post hoc
analysis with a Bonferroni correction demonstrated that
44
these differences were statistically significant in the free
access-paid access comparison (p<.05) and the no access-
paid access comparison (p<.001). However, there was not a
significant difference between individuals with free internet
access at home and individuals with no internet access at
home with regard to the level of comfort they reported that
their children felt with using a digital device for homework
(p=.27).
f. Relationship between how people answered 		
	 Question 1 and how they answered Question 8?
i. Internet access – frequency of using places 		
	 in community to access free internet for 			
	 completing homework
TABLE 20
Relationship Between At Home Access and Frequency
of Use of Digital Device for Completing Homework;
N=8,400
DAILY
2-3TIMESPERWEEK
ONCEAWEEK
1-2TIMESPERMONTH
DOESNOTACCESS
NOTSURE
Paid Access 37.8% 24.7% 10.2% 10.7% 11.2% 5.3%
Free Access 34.5% 21.5% 12.3% 6.9% 13.8% 11.1%
No Access 20.9% 18.9% 8.5% 7.6% 34.4% 9.8%
Kruskal-Wallis H test demonstrated that there was a
statistically significant difference in the frequency in which
individuals reported that their children used a digital device
for homework based on their internet access at home, χ2
(2, N = 7898) = 210.07, p<.001. A Dunn’s post hoc analysis
with a Bonferroni correction demonstrated that these
differences were statistically significant in the free access-no
access comparison (p<.001) and the no access-paid access
comparison (p<.001). However, there was not a significant
difference between individuals with free internet access at
home and individuals with paid internet access at home
with regard to the frequency in which individuals reported
that their children used a digital device for homework (p=.67).
g. Relationship between how people answered 		
	 Question 1 and how they answered Question 9?
ANALYSIS
TABLE 21
Relationship Between At Home Access and Frequency
of Use of Libraries to Access the Internet for Completing
Homework; N=8,135
DAILY
2-3TIMESPERWEEK
ONCEAWEEK
1-2TIMESPERMONTH
DOESNOTACCESS
NOTSURE
Paid Access 2.1% 2.4% 2.3% 8.2% 79% 5.9%
Free Access 5.3% 3.7% 9.4 % 15.5% 52.2% 13.9%
No Access 7.1% 12.6% 9 % 15.5% 47.1% 8.7%
Kruskal-Wallis H test demonstrated that there was a
statistically significant difference in the frequency in which
individuals reported that their children used a public library
(e.g., county, college/university) in their community to access
free internet for completing their homework based on their
internet access at home, χ2 (2, N = 7612) = 525.70, p<.001.
A Dunn’s post hoc analysis with a Bonferroni correction
demonstrated that these differences were statistically
significant at each pairwise comparison (p<.001).
Note: Recognize that there is a different N for the statistical test than
there is for the table above
NOTE ABOUT ANALYSIS
The following tables all include values for the “Not Sure”
response option. However, for statistical testing, the researcher
excluded this response option from the analyses in order to
withhold the ordinal nature of the scale.
45
TABLE 22
Relationship Between At Home Access and Frequency
of Use of Restaurants to Access the Internet for
Completing Homework; N=8,085
DAILY
2-3TIMESPERWEEK
ONCEAWEEK
1-2TIMESPERMONTH
DOESNOTACCESS
NOTSURE
Paid Access 1.1% 3.4% 5.7% 12.4% 71.6% 5.8%
Free Access 3.8% 7.1% 7.9% 14.6% 51.7% 15%
No Access 3.7% 13.8% 9% 14.3% 49.8% 9.4%
Kruskal-Wallis H test demonstrated that there was a
statistically significant difference in the frequency in which
individuals reported that their children used a restaurant
(e.g., Starbucks, McDonalds, etc.) in their community
to access free internet for completing their homework
based on their internet access at home, χ2 (2, N = 7564)
= 525.70, p<.001. A Dunn’s post hoc analysis with a
Bonferroni correction demonstrated that these differences
were statistically significant in the free access-paid access
comparison and the no access-paid access comparison
(p<.001). However, there was not a significant difference
between individuals with free internet access at home
and individuals with no internet access at home with
regard to the frequency in which individuals reported that
their children used a restaurant to access free internet for
completing their homework (p=.06).
TABLE 23
Relationship Between at Home Access and Frequency of
Use of Retailers to Access the Internet for Completing
Homework; N=8,029
DAILY
2-3TIMESPERWEEK
ONCEAWEEK
1-2TIMESPERMONTH
DOESNOTACCESS
NOTSURE
Paid Access 0.5% 1.5% 2.4% 6.6% 82.1% 7%
Free Access 4.2% 3.4% 3% 9.3% 63.6% 16.5%
No Access 1.4% 3% 2.2% 7.9% 72.8% 12.7%
Kruskal-Wallis H test demonstrated that there was a
statistically significant difference in the frequency in which
individuals reported that their children used a retailer (e.g.,
Apple Store, Barnes & noble, etc.) in their community to
access free internet for completing their homework based on
their internet access at home χ2 (2, N = 7401) = 40.65, p<.001.
A Dunn’s post hoc analysis with a Bonferroni correction
demonstrated that these differences were statistically
significant in the free access-paid access comparison and the
no access-paid access comparison (p<.001), and they were
significant in the free access-no access comparison (p<.01).
TABLE 24
Relationship Between at Home Access and Frequency of
Use of Other Public Institutions to Access Internet for
Completing Homework; N=8,035
DAILY
2-3TIMESPERWEEK
ONCEAWEEK
1-2TIMESPERMONTH
DOESNOTACCESS
NOTSURE
Paid Access 1.1% 1.8% 2.4% 7.1% 80.1% 7.5%
Free Access 4.6% 4.6% 3.4% 11.4% 58.2% 17.7%
No Access 3.8% 6.4% 6.1% 8.7% 62.9% 12.1%
Kruskal-Wallis H test demonstrated that there was a
statistically significant difference in the frequency in which
individuals reported that their children used other public
institutions (e.g., community center, park, museum, etc.) in
their community to access free internet for completing their
homework based on their internet access at home χ2 (2, N
= 7369) = 157.04, p<.001. A Dunn’s post hoc analysis with a
Bonferroni correction demonstrated that these differences
were statistically significant in the free access-paid access
comparison and the no access-paid access comparison
(p<.001). However, there was not a significant difference
between individuals with free internet access at home and
individuals with no internet access at home with regard
to the frequency in which individuals reported that their
children used other public institutions to access free internet
for completing their homework (p>.99).
46
TABLE 25
Relationship Between at Home Access and Frequency
of Use of Someone Else’s Home to Access Internet for
Completing Homework; N=8,106
DAILY
2-3TIMESPERWEEK
ONCEAWEEK
1-2TIMESPERMONTH
DOESNOTACCESS
NOTSURE
Paid Access 2.1% 6.5% 8.6% 20.1% 55.6% 7.1%
Free Access 10.5% 8.4% 12.1% 18% 36.4% 14.6%
No Access 11.7% 17.8% 11.8% 19.2% 30.7% 8.8%
Kruskal-Wallis H test demonstrated that there was a
statistically significant difference in the frequency in which
individuals reported that their children used someone else’s
home (e.g., classmate, friend, family member, etc.) in their
community to access free internet for completing their
homework based on their internet access at home, χ2 (2, N
= 7499) = 319.09, p<.001. A Dunn’s post hoc analysis with a
Bonferroni correction demonstrated that these differences
were statistically significant in the free access-paid access
comparison and the no access-paid access comparison
(p<.001), and they were significant in the free access-no
access comparison (p<.01).
TABLE 26
Relationship Between at Home Access and Frequency
of Use of ‘Other’ Location to Access Internet for
Completing Homework; N=3,787
DAILY
2-3TIMESPERWEEK
ONCEAWEEK
1-2TIMESPERMONTH
DOESNOTACCESS
NOTSURE
Paid Access 3.2% 1.6% 1% 1% 72.2% 20.9%
Free Access 4.1% 2.5% 1.6% 3.3% 50.8% 37.7%
No Access 5.2% 1.9% 3.3% 2.4% 55.2% 31.9%
Kruskal-Wallis H test demonstrated that there was a
statistically significant difference in the frequency in which
individuals reported that their children used other locations
in their community to access free internet for completing
their homework based on their internet access at home, χ2
(2, N = 2929) = 34.63, p<.001. A Dunn’s post hoc analysis with
a Bonferroni correction demonstrated that these differences
were statistically significant in the free access-paid
access comparison (p<.05) and the no access-paid access
comparison (p<.001). However, there was not a significant
difference between individuals with free internet access at
home and individuals with no internet access at home with
regard to the frequency in which individuals reported that
their children used other locations in their community to
access free internet for completing their homework (p>.99).
h. Relationship between respondents’ responses to 		
	 Question 1 and the TYPE of device they own?
ANALYSIS
Dichotomized the number of each particular device owned
into owned or does not own this particular device. Created
a contingency table of device ownership by internet access
group (i.e., paid, free, no access).
Note: Treated the ownership as ordinal to better understand how
ownership differed across groups.
TABLE 27
Relationship Between At Home Access and Ownership
of Smart Phone; N=8,653
DOES NOT
OWN
OWNS
Paid Access 1.8 % 98.2 %
Free Access 4.7 % 95.3 %
No Access 9 % 91 %
Kruskal-Wallis H test demonstrated that there was a
statistically significant difference in whether individuals
reported owning a smart phone based on their internet
access at home, χ2 (2, N = 8653) = 171.03, p<.001. A Dunn’s
post hoc analysis with a Bonferroni correction demonstrated
that these differences were statistically significant in the free
access-no access comparison and the no access-paid access
comparison (p<.001), and they were significant in the free
access-paid access comparison (p<.01).
TABLE 28
Relationship Between At Home Access and Ownership
of Desktop Computers; N=7,501
DOES NOT
OWN
OWNS
Paid Access 47.5 % 52.5 %
Free Access 56 % 44 %
No Access 78.9 % 21.1 %
Kruskal7-Wallis H test demonstrated that there was a
statistically significant difference in whether individuals
reported owning a desktop based on their internet access
at home, χ2 (2, N = 7501) = 260.43, p<.001. A Dunn’s post hoc
analysis with a Bonferroni correction demonstrated that
these differences were statistically significant in the free
access-no access comparison and the no access-paid access
comparison (p<.001), and they were significant in the free
access-paid access comparison (p<.05).
47
TABLE 29
Relationship Between At Home Access and Ownership
of Laptop Computer; N=8,289
DOES NOT
OWN
OWNS
Paid Access 9.3 % 90.7 %
Free Access 19.8 % 80.2 %
No Access 51.4 % 48.6 %
Kruskal-Wallis H test demonstrated that there was a
statistically significant difference in whether individuals
reported owning a laptop based on their internet access
at home, χ2 (2, N = 8289) = 1061.28, p<.001. A Dunn’s post
hoc analysis with a Bonferroni correction demonstrated
that these differences were statistically significant at each
pairwise comparison (p<.001).
TABLE 30
Relationship Between At Home Access and Ownership
of Tablet; N=8,257
DOES NOT
OWN
OWNS
Paid Access 9.5 % 90.5 %
Free Access 28.3 % 71.7 %
No Access 42.9 % 57.1 %
Kruskal-Wallis H test demonstrated that there was a
statistically significant difference in whether individuals
reported owning a tablet based on their internet access
at home, χ2 (2, N = 8257) = 740.05, p<.001. A Dunn’s post
hoc analysis with a Bonferroni correction demonstrated
that these differences were statistically significant at each
pairwise comparison (p<.001).
TABLE 31
Relationship Between at Home Access and Ownership of
Smart TV; N=7,675
DOES NOT
OWN
OWNS
Paid Access 37.2 % 62.8 %
Free Access 44.8 % 55.2 %
No Access 66.9 % 33.1 %
Kruskal-Wallis H test demonstrated that there was a
statistically significant difference in whether individuals
reported owning a smart tv based on their internet access
at home, χ2 (2, N = 7675) = 253.05, p<.001. A Dunn’s post hoc
analysis with a Bonferroni correction demonstrated that
these differences were statistically significant in the free
access-no access comparison and the no access-paid access
comparison (p<.001), and they were significant in the free
access-paid access comparison (p<.05).
TABLE 32
Relationship Between at Home Access and Ownership of
Streaming Device; N=7,218
DOES NOT
OWN
OWNS
Paid Access 48.1 % 51.9 %
Free Access 65.4 % 34.6 %
No Access 91.5 % 8.5 %
Kruskal-Wallis H test demonstrated that there was a
statistically significant difference in whether individuals
reported owning a streaming device based on their internet
access at home, χ2 (2, N = 7218) = 503.22, p<.001. A Dunn’s
post hoc analysis with a Bonferroni correction demonstrated
that these differences were statistically significant at each
pairwise comparison (p<.001).
TABLE 32
Relationship Between at Home Access and Ownership of
Gaming System; N=7,974
DOES NOT
OWN
OWNS
Paid Access 22.5 % 77.5 %
Free Access 23.8 % 76.2 %
No Access 43.8 % 56.2 %
Kruskal-Wallis H test demonstrated that there was a
statistically significant difference in whether individuals
reported owning a gaming system based on their internet
access at home, χ2 (2, N = 7974) = 175.11, p<.001. A Dunn’s
post hoc analysis with a Bonferroni correction demonstrated
that these differences were statistically significant in the free
access-no access comparison and the no access-paid access
comparison (p<.001). However, there was not a significant
difference between individuals with free internet access at
home and individuals with paid internet access at home
with regard to whether individuals reported owning a
gaming system (p=.95).
TABLE 32
Relationship Between at Home Access and Ownership of
‘Other’ Device; N=2,182
DOES NOT
OWN
OWNS
Paid Access 89.3 % 10.7 %
Free Access 83.1 % 16.9 %
No Access 94 % 6 %
Kruskal-Wallis H test demonstrated that there was a
statistically significant difference in whether individuals
reported owning other digital devices based on their internet
access at home, χ2 (2, N = 2182) = 10.83, p<.01. A Dunn’s post
hoc analysis with a Bonferroni correction demonstrated
that these differences were statistically significant in the
48
TABLE 34
Relationship Between Frequency of Use of Restaurants
to Access Internet to Complete Homework and Grade
Level; N=4,951
DAILY
2-3TIMESPERWEEK
ONCEAWEEK
1-2TIMESPERMONTH
DOESNOTACCESS
NOTSURE
Elementary
School
0.4% 1.8% 3.2% 8.9% 83.1% 2.5%
Middle
School
1.2% 4% 7.3% 13.2% 69.3% 5%
High School 2.6% 7.5% 7.5% 16% 56.4% 10.1%
Kruskal-Wallis H test demonstrated that there was a
statistically significant difference in the frequency in which
individuals reported that their children used a restaurant
in their community to access free internet for completing
their homework based on their school level (i.e., elementary,
middle, high school), χ2 (2, N = 4706) = 281.04, p<.001. A
Dunn’s post hoc analysis with a Bonferroni correction
demonstrated that these differences were statistically
significant at each pairwise comparison (p<.001).
TABLE 35
Relationship Between Frequency of Use of Retailers to
Access Internet to Complete Homework and Grade Level;
N=4,922
DAILY
2-3TIMESPERWEEK
ONCEAWEEK
1-2TIMESPERMONTH
DOESNOTACCESS
NOTSURE
Elementary
School
0.2% 0.9% 1.4% 3.9% 90.6% 2.9%
Middle
School
0.3% 1.8% 2.2% 7.5% 81.7% 6.5%
High School 1% 2.8% 2.5% 9.4% 72.7% 11.6%
Kruskal-Wallis H test demonstrated that there was a
statistically significant difference in the frequency in which
individuals reported that their children used a retailer in
their community to access free internet for completing
their homework based on their school level (i.e., elementary,
middle, high school), χ2 (2, N = 4635) = 116.63, p<.001. A
Dunn’s post hoc analysis with a Bonferroni correction
demonstrated that these differences were statistically
significant at each pairwise comparison (p<.001).
free access-no access comparison (p<.01) and the no access-
paid access comparison (p<.05). However, there was not a
significant difference between individuals with free internet
access at home and individuals with paid internet access at
home with regard to whether individuals reported owning
other digital devices (p=.09).
i. Relationship between Question 9 and grade 		
	 level of children (i.e. elementary, middle, high) 		
	 from Question 16?
ANALYSIS
Dichotomized number of children at each grade level
to indicate whether the respondent reported having a
child at a particular grade level or not, regardless of the
number. Then, I removed any respondent who reported
having a child at more than one school level. Therefore,
each respondent in the following analyses was only
responding with regard to their child at a single grade
level. Said differently, the responses across school levels are
independent of one another.
TABLE 33
Relationship Between Frequency of Use of Library to
Access Internet to Complete Homework and Grade Level;
N=4,986
DAILY
2-3TIMESPERWEEK
ONCEAWEEK
1-2TIMESPERMONTH
DOESNOTACCESS
NOTSURE
Elementary
School
1% 1.7% 2.6% 8.2% 83% 3.6%
Middle
School
2.7% 4.4% 2.7% 9.2% 75.9% 5%
High School 5.4% 4.6 % 3.4% 8.8% 69.4% 8.3%
Kruskal-Wallis H test demonstrated that there was a
statistically significant difference in the frequency in which
individuals reported that their children used a public library
(e.g., county, college/university) in their community to access
free internet for completing their homework based on their
school level (i.e., elementary, middle, high school), χ2 (2, N
= 47390) = 81.21, p<.001. A Dunn’s post hoc analysis with a
Bonferroni correction demonstrated that these differences
were statistically significant in the elementary school-high
school comparison and the elementary school-middle
school comparison (p<.001), and they were significant in the
high school-middle school comparison (p<.05).
49
TABLE 36
Relationship Between Frequency of Use of ‘Other
Public Institutions’ to Access Internet to Complete
Homework and Grade Level; N=4,927
DAILY
2-3TIMESPERWEEK
ONCEAWEEK
1-2TIMESPERMONTH
DOESNOTACCESS
NOTSURE
Elementary
School
0.6% 1.2% 1.6% 4.9% 88.7% 3.1%
Middle
School
0.9% 2% 4.4% 8.1% 77.5% 7.2%
High School 2.4% 2.5% 2.8% 8.9% 70.1% 13.3%
Kruskal-Wallis H test demonstrated that there was a
statistically significant difference in the frequency in which
individuals reported that their children used other public
institutions in their community to access free internet for
completing their homework based on their school level
(i.e., elementary, middle, high school), χ2 (2, N = 4607) =
101.29, p<.001. A Dunn’s post hoc analysis with a Bonferroni
correction demonstrated that these differences were
statistically significant in the elementary school-high school
comparison and the elementary school-middle school
comparison (p<.001). However, there was not a significant
difference between high school students and middle school
students with regard to the frequency in which they use
other public institutions in their community to access free
internet for completing their homework, as reported by their
parent(s) (p=.15).
TABLE 37
Relationship Between Frequency of Use of Library to
Access Internet to Complete Homework and Grade
Level; N=4,967
DAILY
2-3TIMESPERWEEK
ONCEAWEEK
1-2TIMESPERMONTH
DOESNOTACCESS
NOTSURE
Elementary
School
1.7% 4.7% 7% 14.6% 68.6% 3.5%
Middle
School
3.5% 6.2% 10.6% 22.9% 50.8% 5.9%
High School 4.2% 10.5% 10% 24.4% 40.7% 10.2%
Kruskal-Wallis H test demonstrated that there was a
statistically significant difference in the frequency in which
individuals reported that their children used someone
else’s home in their community to access free internet for
completing their homework based on their school level
(i.e., elementary, middle, high school), χ2 (2, N = 4684) =
262.28, p<.001. A Dunn’s post hoc analysis with a Bonferroni
correction demonstrated that these differences were
statistically significant at each pairwise comparison (p<.001).
TABLE 38
Relationship Between Frequency of Use of ‘Other’ to
Access Internet to Complete Homework and Grade
Level; N=2,384
DAILY
2-3TIMESPERWEEK
ONCEAWEEK
1-2TIMESPERMONTH
DOESNOTACCESS
NOTSURE
Elementary
School
1.2% 1.6% 1 % 1.1% 81.8% 13.3%
Middle
School
2.7% 1% 2.1 % 0.3% 68.8% 25%
High School 6.8% 1.3% 1.1% 0.6% 58.1% 32.1%
Kruskal-Wallis H test demonstrated that there was a
statistically significant difference in the frequency in which
individuals reported that their children used other locations
in their community to access free internet for completing
their homework based on their school level (i.e., elementary,
middle, high school), χ2 (2, N = 1933) = 34.59, p<.001. A Dunn’s
post hoc analysis with a Bonferroni correction demonstrated
that these differences were statistically significant in the
elementary school-high school comparison (p<.001) and
the high school-middle school comparison (p<.01). However,
there was not a significant difference between elementary
school students and middle school students with regard
to the frequency in which they use other locations in their
community to access free internet for completing their
homework, as reported by their parent(s) (p=.24).
50
j. Relationship between school type from
	 Question 19 (i.e., public, private, other) and 		
	 response to Question 1?
ANALYSIS:
Due to the sample sizes within cells (e.g., Free access by
private school, free access by other, etc.) statistical testing
could not be conducted.
TABLE 39
Relationship Between at Home Access and School Type;
N=7,922
PUBLIC
PRIVATE
OTHER
Paid Access 96.9 % 0.8 % 2.4 %
Free Access 97.1 % 0.8 % 2.1 %
No Access 98 % 0.5 % 1.5 %
k. Relationship to response for Question 3 and 		
	 income level (Question 15)
i. Income level – Main reason for NOT having 		
	 internet access
ANALYSIS:
For income, rather than reporting the results from 10
different income categories, we condensed the categories
down to 3, low, medium, and high-income categories. Low
consists of categories ranging from less than 10k-34.99k.
Medium ranges from 35k-74.99k. High ranges from
75k-200k+.
Collapsed the ten income categories into three categories
(1-4 = Low income, 5-7 = medium income, 8-10 = high
income). This should make for more interpretable and
practical results. Again, I treated the dependent variable,
“yes/no” responses as ordinal. Essentially treated it as “More
of a reason” vs. “less of a reason”. This allowed for better
interpretation across groups, rather than just determining
whether the proportion of Yes vs. No was statistically
significant within each income group. Kruskal Wallis analyses
were used throughout.
TABLE 40
Relationship Between Income Level and ‘No Need’ as
Main Reason Respondent Does Not Have Broadband
Home Access; N=777
IS NOT
A MAIN
REASON
IS A MAIN
REASON
Low (Less Than $10,000 -
$34,999)
98.2 % 1.8 %
Medium ($35,000 - $74,999) 98 % 2 %
High ($75,000 - $200,000+) 100 % 0 %
Participants provided whether or no several potential reasons
for not having internet access in their homes was relevant to
their situation. Kruskal-Wallis H test demonstrated that there
was not a statistically significant difference in the extent to
which participants said they did not have a need for internet
access based on income level, χ2 (2, N = 777) = .67, p=.72.
TABLE 41
Relationship Between Income Level and ‘Not Available’
as Main Reason Respondent Does Not Have Broadband
Home Access; N=777
IS NOT
A MAIN
REASON
IS A MAIN
REASON
Low (Less Than $10,000 -
$34,999)
87.4 % 12.6 %
Medium ($35,000 - $74,999) 59.8 % 40.2 %
High ($75,000 - $200,000+) 28.1 % 71.9 %
Participants provided whether or no several potential reasons
for not having internet access in their homes was relevant
to their situation. Kruskal-Wallis H test demonstrated that
there was a statistically significant difference in the extent
to which participants said that internet was not available
to them in their area access based on income level, χ2 (2,
N = 777) = 111.85, p<.001. A Dunn’s post hoc analysis with a
Bonferroni correction demonstrated that these differences
were statistically significant at each pairwise comparison of
income levels (p<.001).
51
TABLE 42
Relationship Between Income Level and ‘Too Slow’ as
Main Reason Respondent Does Not Have Broadband
Home Access; N=777
IS NOT
A MAIN
REASON
IS A MAIN
REASON
Low (Less Than $10,000 -
$34,999)
93.8 % 6.2 %
Medium ($35,000 - $74,999) 89.8 % 10.2 %
High ($75,000 - $200,000+) 87.5 % 12.5 %
Participants provided whether or no several potential reasons
for not having internet access in their homes was relevant to
their situation. Kruskal-Wallis H test demonstrated that there
was not a statistically significant difference in the extent to
which participants said their internet connection was too
slow based on income level, χ2 (2, N = 777) = 4.86, p=.09.
TABLE 43
Relationship Between Income Level and ‘Device will
not Connect’ as Main Reason Respondent Does Not
Have Broadband Home Access; N=777
IS NOT
A MAIN
REASON
IS A MAIN
REASON
Low (Less Than $10,000 -
$34,999)
98 % 2 %
Medium ($35,000 - $74,999) 97.5 % 2.5 %
High ($75,000 - $200,000+) 100 % 0 %
Participants provided whether or no several potential reasons
for not having internet access in their homes was relevant to
their situation. Kruskal-Wallis H test demonstrated that there
was not a statistically significant difference in the extent to
which participants said their devices would not connect
based on income level, χ2 (2, N = 777) = 4.86, p=.09.
TABLE 44
Relationship Between Income Level and ‘Too
Expensive’ as Main Reason Respondent Does Not Have
Broadband Home Access; N=777
IS NOT
A MAIN
REASON
IS A MAIN
REASON
Low (Less Than $10,000 -
$34,999)
23.8 % 76.2 %
Medium ($35,000 - $74,999) 43.4 % 56.6 %
High ($75,000 - $200,000+) 81.2 % 18.8 %
Participants provided whether or no several potential reasons
for not having internet access in their homes was relevant to
their situation. Kruskal-Wallis H test demonstrated that there
was a statistically significant difference in the extent to which
participants said that internet was too expensive based on
income level, χ2 (2, N = 777) = 65.57, p<.001. A Dunn’s post
hoc analysis with a Bonferroni correction demonstrated
that these differences were statistically significant at each
pairwise comparison of income levels (p<.001).
TABLE 45
Relationship Between Income Level and ‘Use Internet
Elsewhere’ as Main Reason Respondent Does Not Have
Broadband Home Access; N=777
IS NOT
A MAIN
REASON
IS A MAIN
REASON
Low (Less Than $10,000 -
$34,999)
93.2 % 6.8 %
Medium ($35,000 - $74,999) 92.2 % 7.8 %
High ($75,000 - $200,000+) 96.9 % 3.1 %
Participants provided whether or no several potential reasons
for not having internet access in their homes was relevant to
their situation. Kruskal-Wallis H test demonstrated that there
was not a statistically significant difference in the extent to
which participants said they access the internet elsewhere
based on income level, χ2 (2, N = 777) = 1.01, p=.60.
TABLE 46
Relationship Between Income Level and ‘Privacy
Concerns’ as Main Reason Respondent Does Not Have
Broadband Home Access; N=777
IS NOT
A MAIN
REASON
IS A MAIN
REASON
Low (Less Than $10,000 -
$34,999)
98.2 % 1.8 %
Medium ($35,000 - $74,999) 97.5 % 2.5 %
High ($75,000 - $200,000+) 100 % 0 %
Participants provided whether or no several potential reasons
for not having internet access in their homes was relevant to
their situation. Kruskal-Wallis H test demonstrated that there
was not a statistically significant difference in the extent to
which participants said they had privacy concerns based on
income level, χ2 (2, N = 777) = 1.04, p=.60.
52
TABLE 47
Relationship Between Income Level and ‘Other’ as Main
Reason Respondent Does Not Have Broadband Home
Access; N=777
IS NOT
A MAIN
REASON
IS A MAIN
REASON
Low (Less Than $10,000 -
$34,999)
88.8 % 11.2 %
Medium ($35,000 - $74,999) 91.8 % 8.2 %
High ($75,000 - $200,000+) 81.2 % 18.8 %
Participants provided whether or no several potential reasons
for not having internet access in their homes was relevant to
their situation. Kruskal-Wallis H test demonstrated that there
was not a statistically significant difference in the extent to
which participants said they did not have internet access for
other reasons based on income level, χ2 (2, N = 777) = 3.92,
p=.14.
3. What was the most common answer to Question 		
	 3 for those who checked “No” to Question 1?
ANALYSIS
Includes only responses from people who checked “NO” to
Question 1.
TABLE 48
Relationship between Respondents Without Access
and Main Reason for Not Having Internet in their Home;
N=937
RESPONSE OPTION
NOT FOR
THIS
REASON
FOR THIS
REASON
Don’t see the need for it 96.37 % 3.63 %
Not available in my area 76.73 % 23.27 %
Internet too slow 91.36 % 8.64 %
My device does not
connect
97.65 % 2.35 %
Too expensive 34.04 % 65.96 %
I use the internet
somewhere else
92.85 % 7.15 %
Concerns about online
privacy
97.23 % 2.77 %
Other 89.01 % 10.99 %
4. Breakdown with descriptive stats of the responses	
	 to each question (i.e., how many people selected 		
	 each option, what percentage that was of total 		
	 response rate, etc.)
ANALYSIS
TABLE 49
Descriptive Stats to Question 1, “Do you currently have
internet access at home?”
RESPONSE N RAW % VALID %
Yes, I pay a monthly
subscription for internet
7774 81.92 85.77
Yes, I have access but do
not pay for a subscription
321 3.38 3.54
No, I do not have access 969 10.21 10.69
Missings 426 4.49
TABLE 50
Descriptive Stats to Question 2, “How do you access the
internet at home?”; N=8,005
NOT USING USING
Cellular data plan 55.94 % 44.06 %
Digital Subscriber 83.1 % 16.9 %
Line (DSL) 77.75 % 22.25 %
Cable modem 43.30 % 56.70 %
Fiber-Optic 88.21 % 11.79 %
Satellite internet service 96.59 % 3.41 %
Dial-up 99.56 % 0.44 %
Not sure 97.73 % 2.27 %
53
TABLE 51
Descriptive Stats to Question 3, “What is the main
reason you do not currently have internet access in your
home?”; N=937
RESPONSE OPTION
NOT FOR
THIS
REASON
FOR THIS
REASON
Don’t see the need for it 96.37 % 3.63 %
Not available in my area 76.73 % 23.27 %
Internet too slow 91.36 % 8.64 %
My device does not
connect
97.65 % 2.35 %
Too expensive 34.04 % 65.96 %
I use the internet
somewhere else
92.85 % 7.15 %
Concerns about online
privacy
97.23 % 2.77 %
Other 89.01 % 10.99 %
TABLE 52
Descriptive Stats to Question 4, “How many of the
following digital devices do you use in your home?”
N 0 1 2 3 4+
Smart
Phone
8653 2.61% 12.78% 34.27% 25.51%
24.84
%
Desktop 7501 50.86% 39.54% 6.49% 1.84% 1.27%
Laptop 8289 13.60% 38.53% 27.00% 13.10% 7.77%
Tablet/
e-Reader
8257 13.35% 30.39% 27.39% 15.44% 13.43%
Smart TV 7675 40.46% 32.55% 15.45% 6.40% 5.15%
Streaming
Device
7218 53.03% 27.65% 11.89% 4.05% 3.38%
Gaming
System
7974 24.71% 43.59% 19.54% 7.12% 5.04%
Other 2182 89.73% 5.45% 2.66% 0.87% 1.28%
TABLE 53
Descriptive Stats to Question 5, “What is the main reason
you do not currently have a digital device in your home?”
RESPONSE N RAW % VALID %
Don’t see the need for it 3 0.03 8.33
Too expensive 25 0.26 69.44
I use computer/devices
somewhere else
1 0.01 2.78
Concerns about
online privacy
1 0.01 2.78
My current devices don’t work 1 0.01 2.78
Other 5 0.05 13.89
Missings 9454 99.62
TABLE 54
Descriptive Stats to Question 5, “How comfortable are
you with using the digital devices you own to do the
following tasks?” N=8,457
VERY
UNCOMFORTABLE
SOMEWHAT
UNCOMFORTABLE
NOTSURE
SOMEWHAT
COMFORTABLE
VERY
COMFORTABLE
Help my
children with
schoolwork
9.33% 6.26% 5.34% 21.80% 57.27%
To pay bills 12.10% 5.40% 4.62% 18.49% 59.39%
Online
banking
13.30% 5.25% 5.89% 17.61% 57.94%
For work 9.27% 2.92% 6.81% 14.16% 66.85%
To shop online 10.19% 5.27% 3.79% 19.95% 60.80%
To access
personal
information
(e.g., medical
records,
taxes,etc.
12.30% 8.76% 8.00% 23.93% 47.01%
Job search 8.36% 3.70% 9.20% 20.04% 58.70%
Entertainment
(e.g., watching
movies,videos,
listening to
music, etc.
8.30% 3.85% 4.52% 18.43% 64.90%
TABLE 55
Descriptive Stats to Question 7, “Overall, how
comfortable are your children with using a digital
device for homework?”
RESPONSE N RAW % VALID %
Very Uncomfortable 602 6.34 7.12
Somewhat Uncomfortable 481 5.07 5.69
Not Sure 659 6.94 7.79
Somewhat Comfortable 2160 22.76 25.54
Very Comfortable 4555 48.00 53.86
Missings 1033 10.89
54
TABLE 56
Descriptive Stats to Question 8, “How often do your children use the following places in your community to access
free internet for completing homework?”
N
DAILY
2-3TIMESPERWEEK
ONCEAWEEK
1-2TIMESPERMONTH
NOACCESS
NOTSURE
Public Library (e.g., County, College/University) 8135 2.72% 3.50% 3.18% 9.18% 74.98% 6.43%
Restaurants (e.g., Starbucks, McDonalds, etc.) 8085 1.43% 4.55% 6.06% 12.63% 68.88% 6.44%
Retailers (e.g., Apple Store, Barnes & Noble, etc.) 8029 0.71% 1.69% 2.35% 6.76% 80.66% 7.82%
Other Public Institutions (e.g., community
center, park, museum, etc.)
8035 1.43% 2.33% 2.83% 7.36% 77.77% 8.29%
Someone else’s home (e.g., classmate, friend,
family member, etc.)
8106 3.33% 7.67% 9.02% 19.91% 52.58% 7.49%
Other 3787 3.49% 1.66% 1.27% 1.27% 69.66% 22.66%
TABLE 57
Descriptive Stats to Question 8, “How often do your
children use a digital device for homework?”
RESPONSE N RAW % VALID %
Daily 3021 31.83 38.25
2-3 week 2019 21.28 25.56
Once per week 848 8.94 10.74
1-2 month 863 9.09 10.93
No access 1147 12.09 14.52
Missings 1592 16.78
TABLE 58
Descriptive Stats to Question 10, “Do your children take
advantage of any of the following resources?”
YES
NO
NOTSURE
NOTAVAILABLE
ATSCHOOL
School-Provided
Rental Digital
Device (e.g.,
laptop, tablet,
hotspot, etc.)
8068 28.21% 38.82% 9.58% 23.39%
Extended-Day
Computer Lab
Internet access
(e.g., before or
after school
programs)
7992 10.55% 50.75% 16.70% 22.00%
Other 2759 3.73% 49.29% 26.35% 20.62%
55
TABLE 59
Descriptive Stats to Question 11, “Please identify the
number of children in K-12 that reside in your home”
N 0 1 2 3 4+
Elementary
School
(K-5th
grade or 6th
grade)
6929 27.88% 48.25% 19.18% 3.58% 1.11%
Middle
School/Jr
High(6th
-8th
gradeor7th
-
9th
grade)
6099 55.24% 39.15% 4.64% 0.52% 0.44%
High
School (9th
-
12th
grade
or 10th
-12th
grade)
6246 48.64% 40.38% 9.35% 0.88% 0.75%
TABLE 60
Descriptive Stats to Question 12, “What type of school(s)
are your children currently enrolled in?”
RESPONSE N RAW % VALID %
Public School (Including
Traditional, Charter, Early
College, Magnet, etc.)
7751 81.68 96.98
Private School 60 0.63 0.75
Other 181 1.91 2.26
Missings 1498 15.79
TABLE 61
Descriptive Stats to Question 14, “What is your sex?”
RESPONSE N RAW % VALID %
Male 1334 14.06 16.67
Female 6629 69.85 82.85
Other 38 0.40 0.47
Missings 1489 15.69
TABLE 62
Descriptive Stats to Question 15, “What is your race/
ethnicity?”
RESPONSE N RAW % VALID %
Asian/Pacific Islander 112 1.18 1.41
Black/African American 761 8.02 9.61
Hispanic/Latino 411 4.33 5.19
Native American/American
Indian
152 1.60 1.92
White 6324 66.64 79.88
Other 157 1.65 1.98
Missings 1573 16.58
TABLE 63
Descriptive Stats to Question 16, “What is your household
income?”
RESPONSE N RAW % VALID %
Less than $10,000 371 3.91 4.92
$10,000 to $14,999 281 2.96 3.73
$15,000 to $24,999 512 5.40 6.79
$25,000 to $34,999 618 6.51 8.20
$35,000 to $49,999 892 9.40 11.83
$50,000 to $74,999 1470 15.49 19.49
$75,000 to $99,999 1337 14.09 17.73
$100,000 to $149,999 1278 13.47 16.95
$150,000 to $199,999 441 4.65 5.85
$200,000 or more 341 3.59 4.52
Missings 1949 20.54
56
TABLE 64
Descriptive Stats to Question 17, “What is your highest
degree or level of school completed?”
RESPONSE N RAW % VALID %
Less than high school 356 3.75 4.51
High school diploma (or
GED)
877 9.24 11.11
Some college 1387 14.62 17.57
Associate’s degree (e.g., AA,
AS)
1062 11.19 13.45
Bachelor’s degree (e.g.,
BA,BS)
2350 24.76 29.76
Master’s degree (e.g., MA,
MS, MBA, MEd)
1489 15.69 18.86
Professionaldegreebeyond
a bachelor’s degree (e.g.,
MD,DDS, LB, JD)
196 2.07 2.48
Doctorate degree (e.g.,
PhD, EdD)
179 1.89 2.27
Missings 1594 16.80
5. Profile of the type of person who checked “No”
	 to Question 1 (i.e., do demographics tend to be 		
	 similar or different).
TABLE 65
Percent of Respondents With and Without Broadband
by Race/Ethnicity
BLACK HISPANIC WHITE OTHER
Paid Access 8.4% 4.6% 82.1% 4.9%
Free Access 25.9% 12.5% 54.3% 7.3%
No Access 15.8% 8.3% 68.0% 8.0%
TABLE 66
Percent of Respondents With and Without Broadband
by Income Level
LOW MEDIUM HIGH
Paid Access 17.6% 51.8% 30.5%
Free Access 56.7% 29.5% 13.8%
No Access 64.7% 31.2% 4.1%
TABLE 67
Percent of Respondents With and Without Broadband
by Education Level
LESSTHANHIGH
SCHOOL
HIGHSCHOOL
DIPLOMA
SOMECOLLEGE
ASSOCIATES
BACHELOR’S
MASTER’S
PROFESSIONAL
DEGREE
DOCTORATE
Paid
Access
3.1% 9.2% 16.5% 13.2% 32.2% 20.7% 2.7% 2.4%
Free
Access
28.3% 21.2% 14.2% 10.2% 15.0% 8.0% 1.3% 1.8%
No
Access
10.3% 24.7% 27.8% 16.8% 13.0% 6.0% 0.6% 0.9%
57
ZIP CODE ANALYSIS – AGGREGATED
TO THE REGIONAL LEVEL
For this analysis, I first acquired NC populations by county
from the NC office of State Budget and Management (osbm.
nc.gov/demog/county-estimates). Next, I paired regions to
counties and the summed the population from each county
within each region together to attain a regional population
value. I then divided this value over the total state population
in order to acquire the regional population proportion.
For the survey proportions, I summed up the total number of
valid responses to the zip code question (note: this excludes
around 2,000 responses from the total survey N). I then
paired zip codes to their corresponding regions and totaled
up the number of responses we had from each region. These
regional totals were then divided over the sum of all valid
responses to the zip code question.
By acquiring proportions for both the NC population by
region, and survey responses by region, we can observe the
distribution of our respondents by region in comparison to
the actual population by region. Ideally, survey proportions
are similar to regional population proportions.
TABLE 68
Zip Code Analysis
REGION
REGIONAL
POPULATION
PROPORTION
REGIONAL
SURVEY
RESPONSE
PROPORTION
DIFFERENCE
(IN ABSOLUTE
VALUES)
1 5.3% 4.6% 0.7%
2 10.5% 11.7% 1.2%
3 23.4% 12.7% 10.7%
4 8.6% 14.0% 5.4%
5 16.5% 10.2% 6.3%
6 22.4% 10.9% 11.5%
7 6.2% 22.6% 16.4%
8 7.1% 13.3% 6.2%
Overall, many of the regions appear to have been
proportionately well represented, especially regions 1 and
2. Region 3 and 6 were the most underrepresented regions
proportionately, in the survey. Region 3 and 6 are the
most populated regions of the NC regions; however, their
representation in the survey was roughly equal to most
other regions, as opposed to being much larger. In contrast,
region 7 was overrepresented in the survey, accounting for
22.6% of the survey responses. More respondents resided in
this region than any other region; however, in the context of
the NC population, region 7 accounts for the second lowest
proportion of the total population.
Because there were respondents who were excluded from
the zip code analysis due to missing data and complications
with the survey, there is error present in the table above.
Although missing data may have occurred randomly, with
regard to the survey complications, certain respondents who
took the survey before a specific time point were excluded
from this analysis. Therefore, it is likely that the proportions in
the table were affected by this systematic error.
58
APPENDIX E
Survey Distribution Partners
Catawba County Schools
Creekside Elementary School
Digital Charlotte
E2D
Durham Digital Equity
Partnership
Imhotep Academy, NCSU
Kajeet
Kramden Institute
Lee County Schools
North Carolina Department
of Public Instruction
North Carolina League of
Municipalities
North Carolina PTA
State Library of North Carolina
59
APPENDIX F
Homework Gap Convening Notes
The schedule for the day was intentional. Each component
of the agenda included opportunities for the participants to
network and engage in meaningful discussion. Each session
addressed eliminating the the homework gap. The following
sections of this paper will provide an overview of the day
including participants’ feedback during working groups and
recommendations for addressing digital inequities in NC.
SOLUTIONDESIGNBREAKOUTGROUP
SESSIONS
Participants spent part of the afternoon working in group
sessions discussing four areas (1. Technology, Infrastructure,
and Devices; 2. Sustainability; 3. Policy; and 4. Research and
Data). A facilitator guided each group through conversations
designed to both define the challenges associated with each
topical area and develop thoughtful recommendations for
practical next steps.
The concurrent sessions began with a brief introduction
of the participants in which they provided their name,
organizational affiliation, and their connection to or reason
for interest in the homework gap. Next, a guiding question
aligned to the session topic was posted to generate ideas.
Each participant was given small slips of paper to record their
answers. The responses were placed on the wall and grouped
by similarities. Each participant then received three stickers to
select the top three areas they would like to discuss.
BREAKOUT SESSION 1
Sustainability Solution Design (n=9)
Guiding Questions:
•• What are some creative financing models for closing the
homework gap?
•• What are the best ways to sustain those models?
•• How would the addition of this/these solutions be useful in
your district or area?
•• Why would they be impractical?
•• What are the best short-term solutions?
•• What are the best long-term solutions?
•• Which solution is most feasible?
•• What barriers do you foresee?
Representatives from city/state government, institutes of higher education, private
business, public organizations, and schools/districts assembled to engage in productive
conversations about eradicating the Homework Gap. The convening set three main
priorities: 1) Continue the conversations held during the 2016 Digital Equity Convening; 2)
Discuss new data on the scope and breadth of the homework gap in NC; and 3) Engage
stakeholders and subject matter experts in designing solutions to close the gap.
OPENING SESSION
Glenn Kleiman, Friday Institute Executive
Director
Welcome
Geoff Coltrane, NC Education Advisor
Remarks
Eric Boyett, NC CIO
Remarks
HOMEWORK GAP SURVEY
DATA PRESENTATION
Jessica Rosenworcel, Federal Communication
Commissioner (FCC)
Keynote Address
HOMEWORK GAP SOLUTIONS PANEL
Bruce Clark, Executive Director Digital Charlotte
Rob Dietrich, Director of Accountability and
Technology Lee County School
Beth Lancaster, Director of Project ACCESS
Montgomery County Schools
HOMEWORK GAP SOLUTIONS
BREAKOUT SESSIONS
Policy
Research and Data
Sustainability
Technology, Infrastructure, and Devices
60
DISCUSSION SUMMARY
General Assembly
•• What is the General Assembly planning to do with the textbooks line
item? With the digital resources line item? Can these somehow be
reallocated to provide greater access?
•• Use lottery funds to purchase laptops, devices, access, etc., by ADM.
Local Government
•• Allow local communities to build their own networks, which lowers
the costs for the communities.
•• Co-ops for building local networks with infrastructure grants
•• Libraries that do not take e-rate funding can extend their network
beyond their facilities to the community; however, not all libraries are
connected by a fiber line.
•• Local networks will have ongoing sustainability issues (built by local
governments).
•• Subsidizing access requires continuous funding from the state or
local government, or from private entities, or both.
•• Ask local agencies (churches, banks, etc.) to help fund internet access
for disadvantaged students.
•• Cumberland County model (mapping out places with Wifi and
labeling them) helps students find locations to get access. Safety can
be a concern for students having to go somewhere outside of the
home to use wifi.
•• Ask local governments to allocate some of the money they get from leasing space for wireless carrier towers
to schools
•• Verizon, AT&T, Sprint, T-Mobile = major wireless carriers – should rely on existing carriers for their networks
rather than creating their own.
School Districts
•• Local corporate partners to assist with providing access by funding on an ongoing basis
•• Sustainability for school districts = devices, connectivity, training
•• Get corporate sponsorships for hot spot creation, with splashpads, so students can get access. The ad
revenue to districts could support purchasing devices and access.
•• Have teachers stop assigning homework
Private Entities
•• Educational publishers need to understand that instructional resources can only be purchased for one to two
years at a time.
•• The point of getting more access for students is to provide them an equal footing for education to everyone
else, who has access. Once the students have the access at home, even though it’s limited, many
parents see the value and purchase wireless access for the home.
•• School districts purchase for the school year, not monthly.
POTENTIAL SOLUTIONS
•• Develop public-private
partnerships.
•• Shift school funds from
textbooks to technology
•• Reduce costs of wireless
access; use a state-level
agency to negotiate
lower costs for all school
districts, just as DPI does
for instructional resources
(textbooks).
•• The General Assembly
should create line items that
require funds be used for
connectivity.
•• Open conversations with
service carriers about
allowing them to put cell
towers on district properties
on a lease available to
nonprofit organizations.
61
DISCUSSION SUMMARY
•• Clean up the surplus laws that make it easier for distribute the
devices. Currently, there is a concern from the state will lose surplus
revenue from device sales to other nonprofits, public auction, and for-
profit recycling. They want to be sure they can keep some similar level
of revenue that they would be losing. If you take care of that part of it
which is a big weight on families, then you focus on access.
•• HB-129- Law passed at the state level that does not allow local
government to provide infrastructure for internet access. Supported
by the telecom industry. If you’re looking at getting broadband
access, it is hard for cities to help. A counterpoint, the cities and
municipalities are forced to play on the same level as telecom
providers. The outlying areas, such as in western NC, mountaintops
or valleys, that are far from the nearest municipality, if a municipality
could lay the groundwork, it would free up the municipality to
focus others. HB 129 puts limits on the municipalities ability to lay
groundwork outside their boundaries. City of Wilson has their own
WIFI network and they can go anywhere in the County of Wilson, but
they choose not to go to those areas because it isn’t cost effective.
Does HB 129 limit the creative problem solution for difficult areas?
NC Rural Center has researched this a lot. Wilson is a great example of a success but not every municipality
should try to copy that model. There are examples of remote areas such as Alleghany that has great fiber
access. Educating the municipalities on the variety of options that are available to municipalities. There are
grey areas that laws don’t allow municipalities to do some things. We could get a common understanding/
best practices list to clarify some of these grey areas and get municipalities on the right track. County folks
have the impression that they can’t really do much of anything. Municipalities can provide free services.
•• A grant program would have the most immediate impact to communities. The state has taken on grant
funding to reach the 7% of households that don’t have access. Back of the hand calculations to get all of
the rural areas access would be $300-400 million. There is no way the General Assembly will appropriate
taxpayer dollars to finish that. If you focus on underserved, you will never get to unserved. It is cheaper
to speed up locations with access already than to get access to places without any at all. Adoption is the
biggest issue. That would dramatically change the business model to make the profitability to go into rural
areas much greater.
BREAKOUT SESSION 2
Policy Solution Design (n=19)
Guiding Questions:
•• What policy changes are needed at the local, state, and
federal level to bridge the homework gap?
POTENTIAL SOLUTIONS
•• Federal law to encourage
the re-use of surplus devices/
make them available to
nonprofit organizations
•• Repeal HB 129- Municipal
government cannot provide
internet access
•• Local understanding and
overcoming regulatory and
communication barriers to
pave the way for a wider
variety of service providers.
•• Grant funding to make
high cost rural areas more
economical for private
providers to deploy service to
unserved areas.
•• How would this policy change be useful in your district
or area?
•• Why would it be impractical or cause hardship?
•• What are the best solutions (short-term and long-term)?
•• Which solution is most feasible?
•• What barriers do you foresee?
62
DISCUSSION SUMMARY
•• Look at existing data we have and try to fill in gaps where there was
no response; that’s foundational first-step approach of improving it, is
to get as many responses as possible especially in geographic areas
where we got low responses, so every zip code in the state would have
some type of response.
•• One of the staff members shared the difficulty and expense of moving
of deploying the paper survey. “I think the hardest part was getting
people thinking about the paper aspect of it -- we knew that was
such a big deal but the money to fund getting the paper; then if you
got the paper, do we mail it in or send someone to pick it up, so the
logistics of doing a massive paper survey gave us hesitation, which is
why Catawba County agreed to have their own and then we sent some people to pick them up, and we
printed on both sides but they still ended up being 4-5 pages stapled, so that’s heavy; the online one is easy
to send” Offering an online survey to people without internet is problematic. It was suggested that the survey
be given through community centers, churches and schools during school events such as open houses.
•• In affluent areas, you’re gonna get your responses either way because they’ll have easier access to surveys;
if you want to see where the true gap lies, target the more rural or high need poverty areas; in my opinion
as a teacher, those are the areas that need the access the most -- i have kids who live right near downtown
Winston-Salem, they don’t have internet access and don’t even have a device, so that gap would still be there.
Can you dig deeper into that, do they see the need to have that device, digging into the root cause of it?
•• Those of us on the outside, this expectation that people want to take the survey – the hardest part for us was
getting people to finish the survey; more people had access to it but they never finished it; and maybe it’s
time or survey fatigue, but how can we get what we need to get in the shortest amount of time or questions
without it being cumbersome. You can’t give them anything more than a page and they’re done, they’re
busy and working and you have to think about the language we’re using, writing these questions in -- i have
parents who struggle with reading and now you’re encountering this frustration piece, so that’ something
else to consider
•• Wake has a lower percentage of lack of access homework gap students than Montgomery or rural areas but
in terms of absolute number of students, the number could actually be higher, so the impact of that -- the
mixed methods is smart, but one of the things I’d suggest is thinking about tech proxies, so we have a tool
that integrates with Google to help districts understand how tech is being used/access across the district
and you can check the timing (between 4pm and 7am) and see to what extent that’s occurring, so that’s
another method of getting data; it’s data acquisition opportunity, it’s not direct but could yield interesting
data. 40,000 in CMS don’t have it in their home, but i guarantee they have access to 2 or 3 providers at home,
so providers can tell you where we don’t have service, it’s when it’s available, why aren’t you subscribing? If
we’re the only provider, we’re thrilled 60% of people subscribe, so if we fixed this adoption issue, more people
would buy the services and it’d be more economic. You think you’d see more providers doing that with the
return on investment.
BREAKOUT SESSION 3
Research and Data Solution Design (n=8)
Guiding Questions:
•• How can we improve upon the pilot research, data
collection, and analysis?
•• What partnerships are needed to distribute the survey
directly through the schools to K-12 households?
•• What are other ways homework gap data can be collected
to bolster the survey results?
•• Why would they be impractical?
•• Which solution is most feasible?
•• What barriers do you foresee?
POTENTIAL SOLUTIONS
•• Improve the data collection
to ensure there is a wider
response from more diverse
participants
•• Target rural and high need
poverty areas
•• Shorten the survey
•• Use data analytics to
determine usage trends
63
Technology, Infrastructure, and Devices (n=15)
Guiding Questions:
•• What technologies are needed to bridge the homework gap?
•• How would the addition of this/these technologies be
useful in your district or area?
DISCUSSION SUMMARY
•• Explore state surplus law and how to maneuver through state
agencies to get access to devices
•• State initiative to fund devices (long term)
•• Advocate for legal/policy changes for surplus of devices/computers
due to this being a revenue source for State Surplus would need to
reviewed and possibly changed
•• Inventory the number of students and aggregate demand of the
school systems that need devices
•• Secure devices with a “keyboard” would be more beneficial
(i.e. Chromebook)
•• Take into account quality of device for grade level being served
•• (Short) Tech companies and data centers and providing devices - Inquire where this starts
•• (Long) e-Rate and law changes - State continue to support be modernized
POTENTIAL SOLUTIONS
•• Determine a way to “unlock”
the State Surplus law passed
this year
•• Demand aggregation for
procurement/contracting/
purchasing of devices
•• Create a clearinghouse for
information/resources so
locals are not starting from
the ground
•• Why would they be impractical?
•• What are the best short-term solutions?
•• What are the best long-term solutions?
•• Which solution is most feasible?
•• What barriers do you foresee?
64
APPENDIX G
Convening Attendees
FIRST NAME LAST NAME ORGANIZATION
Aimee Meacham National Telecommunications and Information Administration
Allen Lee Tyrrell County Schools
Amber Harris North Carolina Association of County Commissioners
Amy Huffman The Broadband Infrastructure Office, NC Department of Information Technology
Angie Bailey ECC Technologies
Beth Lancaster Montgomery County Schools
Bill Holmes NC Department of Information Technology
Brad Rhew Winston-Salem/Forsyth County Schools
Brett Brenton The Research Triangle Park
Bruce Clark Digital Charlotte
Cal Shepard State Librarian's Office of North Carolina
Candace Salmon-Hosey Rowan-Salisbury Schools
Casey Jones Moore County Schools
Cecilia Holden State Board of Education
Chris Wasko Wake County Public Schools
Cindy Johnson E-Rate Services, LLC
Darren Bell Chapel Hill-Carrboro City Schools
Dave Furiness MCNC
Dean Russell Country Cablevision, Inc.
Derek Kelly CenturyLink, Inc.
Donna Malloy Wilson County Schools
Dr. S. Janine Parker NC A&T University
Elaine Batten Durham Public Schools
Eric Boyette NC Department of Information Technology
Eric Cramer Wilkes Telecommunications
Erin Wynia North Carolina League of Municipalities
Gene Ballard Kajeet
George Collier The Broadband Infrastructure Office, NC Department of Information Technology
Jane Smith Patterson Broadband Catalysts
Jeff Sural The Broadband Infrastructure Office, NC Department of Information Technology
Jeffrey Hamilton State Librarian's Office
Jeni Corn Friday Institute
Jennifer Hererra Project Ed
Jenny Myers E2D
Johanna Reese North Carolina Association of County Commissioners
John Coggin North Carolina Rural Economic Development Center
65
J'Tanya Adams EveryoneOn
Karl Rectanus LearnPlatform
Kendt Eklund Moore County Schools
Linda Jones City of Raleigh
Lindsay Saunders NC Department of Information Technology
Mark Johnson MCNC
Mary Furtado Catawba County Manager's Office
MaryAlice Warren NC Department of Information Technology
Melissa Thibault North Carolina School of Science and Mathematics
Mia Bailey Charter
Michael Abensour Kramden
Michael Flood Kajeet
Michael Maher North Carolina State University
Monica Belford Durham County Library
Phil Emer Friday Institute
Ray Zeisz Friday Institute
Richard Bostic North Carolina School Board Association
Rick Pilato Catawba County Manager's Office
Robert Dietrich Lee County Schools
Sammy Roberson Charter
Samuel Wicks Durham Housing Authority
Sara Weiss Friday Institute
Stephanie Jane Edwards MCNC
Steve Brewer CenturyLink
Susan Miller Frontier Communications
Tia Bethea Google Fiber
Todd Brantley NC Rural Economic Development Center
Trey Rabon AT&T
Tricia Townsend Friday Institute
Veronica Creech EveryoneOn
Wes King The Broadband Infrastructure Office, NC Department of Information Technology
William Seiz Final Mile Communications
66
Acknowledgements
PROJECT DIRECTOR, LEAD RESEARCHER
AND AUTHOR
Amy Huffman, Research and Policy Specialist
Broadband Infrastructure Office, NC
Department of Information Technology
LEAD RESEARCHERS
Emily A. Antoszyk, Research Associate
Friday Institute for Educational Innovation,
North Carolina State University
Avril Smart Goggans, Ph.D., Research and
Engagement Manager
Alliance for Excellent Education
Janine Parker, Ph.D., Director
NC AgrAbility, North Carolina Agricultural
and Technical State University
LaTricia W. Townsend, Ed.D.,
Senior Research Scholar
Friday Institute for Educational Innovation,
North Carolina State University
Andrew Weedfall, Graduate Research Assistant
Friday Institute for Educational Innovation,
North Carolina State University
PROJECT SUPPORT AND DIRECTION
Jeffrey Sural, Director
Broadband Infrastructure Office, NC
Department of Information Technology
CONTRIBUTING RESEARCHER
Jeni Corn, Ph.D., Director of Evaluation Programs
Friday Institute for Educational Innovation,
North Carolina State University
CONTRIBUTING AUTHOR
LaTricia W. Townsend, Ed.D.,
Senior Research Scholar
Friday Institute for Educational Innovation,
North Carolina State University
EDITORS
William Holmes, Director of Legislative and
Public Affairs
NC Department of Information Technology
Wesley King, Director of Communications
Broadband Infrastructure Office, NC
Department of Information Technology
GRAPHIC DESIGN
Laura Murray, Graphic Designer
NC Department of Commerce
67
ncbroadband.gov | broadband@nc.gov
The North Carolina Department of Information
Technology’s Broadband Infrastructure Office (BIO)
was established by the State Chief Information Officer
(SCIO) in 2014 as a statewide resource for broadband
access, first responder communication and student
connectivity initiatives led by the State of North
Carolina. BIO provides policy and strategy guidance
and recommendations to community and state
leaders on ways to enhance high-speed internet
access for global competitiveness, education, public
safety, healthcare, and government efficiency.
About the
Authors fi.ncsu.edu | 919 513 8500
The Friday Institute Research and Evaluation (FIRE)
Group, a unit of North Carolina State University’s
College of Education, provides a unique and
comprehensive understanding of innovations
in K-12 public education in North Carolina and
nationally, including special expertise in developing
systemic evaluations for comprehensive, innovative
initiatives. Most recently, the Friday Institute lead the
development and current implementation of the
NC Digital Learning Plan which highlights the digital
learning needs of the state to include out of school
access. In addition, the FIRE Group is actively pursuing
partnerships with community stakeholders to
investigate the digital equity challenges in NC districts
and schools. By combining exemplary practices,
diverse professional backgrounds, and strong working
relationships with education stakeholders, the FIRE
Group contributes to effective, data-driven
decision-making for the continuous improvement of
teaching and learning.
ncbroadband.gov | broadband@nc.gov fi.ncsu.edu | 919 513 8500

Broadband

  • 1.
    1 THE HOMEWORK GAP INNORTH CAROLINA A Pilot Study of K-12 Households
  • 2.
    THE HOMEWORK GAP INNORTH CAROLINA A Pilot Study of K-12 Households Presented by the Broadband Infrastructure Office and the William Ida Friday Institute for Educational Innovation Executive Summary............................................................................................................................ 3 Introduction............................................................................................................................................ 5 Understanding the Big Picture: Context for the Homework Gap.................................7 Developing the Pilot Survey.......................................................................................................... 10 Survey Analysis..................................................................................................................................... 11 Major Findings......................................................................................................................................12 The Homework Gap Convening Summary..............................................................................17 Closing the Gap: Recommendations to Close North Carolina’s Homework Gap.23 Conclusion.............................................................................................................................................25 References.............................................................................................................................................26 Appendices...........................................................................................................................................27 Acknowledgements......................................................................................................................... 66 About the Authors.............................................................................................................................67 Photos courtesy of the NC Department of Information Technology.
  • 3.
    3 Data from the2018 Teacher Working Conditions survey issued biannually by the North Carolina Department of Public Instruction (DPI) shows that 70 percent of high school teachers, 60 percent of middle school teachers, and 43 percent of elementary school teachers in North Carolina regularly assign homework that requires internet access to complete (NC Teacher Working Condition Survey Results, 2018). Meanwhile, at least 259,000 North Carolinian households do not have access to adequate broadband in their homes (FCC, 2018). In addition, half of North Carolina’s households do not have broadband because they cannot afford it, do not have the skills to use it, do not have a device at home to use it with, or do not see its relevance to their lives (FCC, 2018). Beyond these figures, the true state of the Homework Gap, its impacts, and specific causes in North Carolina were unknown. Without granular data about the number of North Carolina’s school children affected by the Homework Gap, the primary cause for their lack of access, the location and geographic disbursement of these families, and the impact of socioeconomic and demographic factors, targeted, strategic solutions could not be designed. To gather this data to inform strategic policy design, the Broadband Infrastructure Office (BIO), a division of the North Carolina Department of Information Technology (DIT), partnered with the Friday Institute Research and Evaluation (FIRE) Group at North Carolina State University to issue a survey and host a convening of subject matter experts on the topic of the Homework Gap. Understanding the common reasons for and implications of the Homework Gap provides stakeholders who seek to close the gap with the information needed to design effective programs and policies. The survey results, while not representative of all North Carolinians due to the survey’s pilot nature, offer more detail and color to paint a more focused picture of the Homework Gap in North Carolina. Of the nearly 8,500 K-12 households that responded to the survey, 10 percent lack broadband access at home. For those without service, cost of the service was the most cited reason for not having home access. Lack of access often extended to the ownership of a computer, laptop or tablet. Those without access were less comfortable completing common tasks online in addition to being less comfortable assisting their children with their online homework. Finally, the Homework Gap impacted low-income households and households with lower educational levels more frequently. Since the partners began studying the issue in 2017, the topic of the Homework Gap has attracted an increasing amount of attention. Just this year, the Department of Education released a report examining the Homework Gap nationwide, the Consortium for School Networking (CoSN) released an updated toolkit designed to assist districts as they address the Homework Gap locally, and in North Carolina, Governor Cooper proposed a $2.5 million grant program to improve home access for students. This report contributes to the growing body of research and strategic policy recommendations designed to address the Homework Gap. The goal of this report is to equip policymakers at the local and state level as well as educators, school districts, and other key stakeholders with the necessary information to understand the Homework Gap and strategies for addressing it. After careful analysis of the Executive Summary “It truly is the cruelest part of the digital divide,” FCC Commissioner Jessica Rosenworcel said when describing what she termed the Homework Gap at the Homework Gap Convening hosted by the North Carolina Broadband Infrastructure Office and the William Ida Friday Institute for Educational Innovation at North Carolina State University. The Homework Gap, a specific subset of the digital divide, occurs when students are assigned homework requiring access to the internet but do not have home access.
  • 4.
    4 survey results anda compilation of recommendations made by subject matter experts at The Homework Gap Convening, this report outlines six key recommendations to close the Homework Gap in North Carolina. RECOMMENDATIONS The State should dedicate funding to establish a grant program housed in NC BIO to close the Homework Gap. The Homework Gap will not be closed unless it is directly addressed. To directly address it, funding is necessary. The survey data shows that no one school district is immune from the Homework Gap. Instead, students across the state are affected by it. The State should establish a time-limited, flexible grant program through which the school districts can leverage state resources to address the Homework Gap in their districts. Grants would fund solutions such as deploying Wi-Fi enabled hotspot devices to students without access at home or equipping school buses with Wi-Fi. By equipping districts with dediced funds, expertise, and support the State can make significant progress towards closing the state’s Homework Gap. The State should pursue the implementation of policies and programs that increase the availability, adoption, and use of broadband. As the Homework Gap is the result of the broader issues contributing to the lack of broadband access, adoption, and meaningful use—to close the Homework Gap with finality, policies and programs addressing the broader availability of the technology and promoting digital inclusion should be implemented. Programs such as the just established Growing Rural Economies with Access to Technology (GREAT) Program designed to facilitate the deployment of broadband to unserved areas of the State will contribute to increasing broadband availability and closing the Homework Gap (S.L. 2018-5, 2018). The State should continue the support of this program and implement other proposals found in the 2016 State Broadband Plan designed to lower barriers to broadband deployment and implement programs and policies that close the digital divide (DIT, 2016). The State should foster cross-sector collaborations and public-private partnerships to implement and sustain multi-faceted solutions. The Homework Gap has far-reaching impacts beyond hampering school children in their educational pursuits. It limits the types of jobs they will be qualified for once they enter the workforce. Failing to equip students with the necessary tools to thrive in a digital society also limits their ability to contribute to their community’s future. In addition, the issue is a result of the intersection of multiple factors. Thus, intentional and innovative partnerships between an array of the State’s organizations is required to implement the multi-faceted solutions required to close the Homework Gap. The State should foster and lead these innovative partnerships, gathering stakeholders from the business community, local governments, education systems, workforce development organizations and nonprofit organizations to develop solutions that address the primary causes of the Homework Gap. The State should continue to study the Homework Gap. In CoSN’s recently updated “Digital Equity Action Toolkit,” the first recommendation for any community seeking to address the Homework Gap is to survey the population to determine the “scope of the problem (CoSN, 2018). BIO’s pilot survey provided useful data for understanding North Carolina’s Homework Gap. It also provided useful experience in best practices for deploying the survey to K-12 households. However, further study is needed to provide even more granular information and data by which progress can be benchmarked and measured. The state should plan to survey the K-12 population annually or biannually through a single, dedicated survey or through an existing survey to which Homework Gap questions can be added. North Carolina’s local governments and LEAs should continue to innovate and partner with the state to close the Homework Gap. Like many innovations, the two most well-known and tested methods of closing the Homework Gap — distributing hotspots and equipping school buses with Wi-Fi — were first designed and tested in local school districts. Several districts in North Carolina are using both methods. These and other districts should continue to explore and design innovative solutions like these. In addition, they should partner with the state to expand these solutions and share best practices so that the state can equip other communities with the knowledge and ability to close the Homework Gap in their communities. The survey instrument and its distribution should be modified to garner more reliable results. During the data collection and analysis process, areas in which the questions could be improved were identified. To improve the accuracy and utility of the data, the survey instrument itself should be edited. In addition, the method of distribution should be modified so that the surveyed population accurately reflects the state’s population. Unlike other intractable issues that impact educational outcomes such as hunger, homelessness, or generational poverty, the Homework Gap is a solvable issue. If implemented, these recommendations, further expounded upon in the remainder of this report, will begin to shrink the Homework Gap in North Carolina, thus increasing a generation of North Carolinians’ ability to fully participate and thrive in today’s society. Implementation of these recommendations requires dedicated leadership, passion, and subject-matter expertise. It also requires the establishment of sustained partnerships across the State. 5 41 2 3 6
  • 5.
    5 And yet, untilthe U.S. Department of Education released a report in April 2018 compiling data from multiple sources to provide a more robust analysis of the impacts a lack of access to broadband at home has on K-12 households, little was known about the size and scope of the Homework Gap beyond rough national estimates. Even with an increase in data available to measure the national Homework Gap, state, county, and municipal-level data on the Homework Gap are non-existent and are not collected by the federal agencies that measure broadband availability and adoption. However, before targeted policies and programs to bridge the Homework Gap can be designed and implemented, its size, scope, and regional distribution must be determined. This need for granular data, coupled with the desire to address the Homework Gap holistically and systemically led the BIO and The FIRE Group to partner to conduct a pilot research study on the topic. The two organizations designed and piloted a survey to collect information on the Homework Gap, who it affects, and its primary causes for North Carolina households. Both organizations have a long history of advancing research, policies and programs designed to bridge the digital divide in North Carolina’s public schools and communities. The FIRE Group leads the development and current implementation of the “North Carolina Digital Learning Plan,” which highlights the digital learning needs of the state to include out of Introduction home · work · gap /ʼhŌmˌwərk/ʼgap/ noun The ‘Homework Gap’ occurs when students are assigned homework requiring access to the internet, but don’t have home access. Nationally, seven in ten teachers assign homework that requires internet access, but an estimated 5 million households with school-age children do not have internet access at home, according to research from the Pew Research Center (Pew Research Center, 2015). From difficulty in completing homework to diminished educational outcomes, the consequences of the Homework Gap are vast and combine to hinder future career and economic opportunities for both the students and their communities. The Homework Gap is the cruelest problem we have, but I think it is in our power to fix.” JESSICA ROSENWORCEL, FCC COMMISSIONER “
  • 6.
    6 school access (TheFriday Institute, 2015). In 2016, the BIO released Connecting North Carolina State Broadband Plan with nearly 80 policy recommendations to ensure all North Carolinians who seek to adopt broadband have access to it by 2021 (DIT, 2016). Given the importance of ensuring the state’s youth are adequately prepared to participate in a 21st century economy, closing the Homework Gap became one of the primary topics the plan addressed. Among the four recommendations focusing specifically on the Homework Gap, the plan recommended conducting statewide research on out-of-school internet access to fully articulate the breadth of Homework Gap challenges for NC students. More specifically the plan reads: HG2.1 The state should distribute a survey in the schools for parents to complete and return to obtain more granular data on where the Homework Gap exists. This could be a telephone, internet, or paper survey (or all the above) targeted at parents. The Friday Institute at North Carolina State University is regarded nationally for developing and evaluating these types of surveys. To this end, the BIO partnered with the FIRE group to 1) develop and administer a pilot Homework Gap survey, and 2) hold a convening of educational technology leaders to brainstorm solutions to eradicate the Homework Gap. This report details these activities.
  • 7.
    7 Causes for theHomework Gap mirror those that prevent households from adopting broadband in their homes. Research shows that the four major obstacles to broadband adoption are: 1 a lack of digital literacy knowledge 2 the unaffordability of either the internet service or the digital device necessary for utilizing the internet 3 a lack of access to broadband service 4 the lack of understanding how the internet is relevant to a person’s life. In the 2015 study, The Numbers Behind the Broadband ‘Homework Gap’, the Pew Research Center found that households with K-12 students are more likely to adopt broadband than households without them. The study found that 82.5 percent of surveyed households with K-12 students adopt broadband, while roughly 73.5 percent of households without K-12 students adopt. But among households with K-12 students, low-income households fall about 20 percentage points behind average income households, and Pew found they make up a disproportionate portion of the 5,000,000 households in the Homework Gap. In addition, the Homework Gap disproportionately impacts low- income black and Hispanic households, which are about 10 percentage points more likely to fall into the Homework Gap than white households. Data from previous North Carolina reports mirror these findings. In a 2013 survey, 86 percent of respondents with children in the household reported having home internet service while 81 percent of respondents overall reported having internet service (Wilson, 2014). Meanwhile, school districts, schools, and teachers increasingly use digital resources and tools in and outside the classroom to supplement or replace their traditional teaching methods. For those without home access or digital devices, the Homework Gap results in digital inequities that prevent those students from participating at the same levels as their peers. Two 2013 statutes passed by North Carolina’s General Assembly encourage a transition from a reliance on physical textbooks to a comprehensive digital learning ecosystem in North Carolina’s K-12 schools (S.L. 2013-11 and S.L.2013-12). The FIRE Group developed a digital learning plan for the State Board of Education and DPI to guide the statute’s implementation. The plan identified five major components of the education system to address and support to successfully implement a digital learning environment: 1) leadership, 2) professional learning, 3) digital-age content and instruction, 4) technology infrastructure and devices, and 5) effective use of data and assessment (The Friday Institute, 2015). FIGURE 1 Digital Learning Progress Rubric Categories Understanding the Big Picture: Context for the Homework Gap The Homework Gap is a subset of the digital divide or “the gulf between those who have access to computers and internet and those who do not,” (Oxford Dictionary, 2018). Both the Homework Gap and the digital divide can be studied through the lens of broadband adoption or households who subscribe to broadband service.
  • 8.
    8 All five componentsof the plan rely upon a robust broadband infrastructure in the schools and their surrounding communities to effectively implement and realize the full benefits from the plan. In addition, the plan indicates that equity of access to all schools and students cannot be achieved without reliable, consistent access to digital resources. Building from this plan, the Friday Institute hosted the “Equity for Digital-Age Learning Convening” in 2016 where attendees learned from subject matter experts the necessity of promoting digital equity practices and programs within and outside of the schoolhouse. Attendees also brainstormed solutions for solutions to five key topic areas, all of which impact the Homework Gap in some way: 1) out of school internet access, 2) professional development and preparation for educators, 3) personalized learning in high-need classrooms, 4) building parent and community support, and 5) planning for sustainability for devices, networks and resources (The Friday Institute, 2016). The convening accentuated BIO’s finding from the State Broadband Plan — that further study of the Homework Gap at the state level would be necessary to inform the creation of policies and programs to address the Homework Gap (DIT, 2016). THE CURRENT STATE OF BROADBAND IN NORTH CAROLINA To understand the Homework Gap, it is necessary to understand the broadband availability and adoption landscape in North Carolina. Broadband availability — also sometimes referred to as access or deployment — measures the supply of broadband while broadband adoption measures its demand. Broadband availability and subscription data are provided by the Federal Communications Commission (FCC). According to its latest data release, 93.7 percent of North Carolinians have access to broadband at the FCC recommended speed threshold of 25 Mbps download/3 Mbps upload (2018). Due to the FCC’s method of data collection and analysis, the data are overstated, thus the estimates reported underestimate the number of North Carolina residents without broadband access. The state’s rural areas are particularly affected by the lack of access with 95 percent of those without service in rural communities. As previously discussed, households cannot adopt broadband if access is unavailable at their locations. For 259,000 households in North Carolina, a lack of access is their primary barrier to adoption as broadband service is not available at their home (FCC, 2018). Within North Carolina, 43 of the 100 counties have a household broadband deployment rate at the FCC recommended speed threshold, equal to or above North Carolina’s average of 93.7 percent (FCC, 2018). See Figure 2, opposite page North Carolina’s subscription rate at 25/3 is 49.8 percent, and ranks 18th in the country (FCC, 2018). This indicates that just under half of North Carolina’s households purchase broadband at this speed threshold in their homes, according to data from the FCC’s Internet Access Services 2016 report (FCC, 2018). See Figure 3, opposite page As speeds decrease, subscriptions increase. When considering all speeds, North Carolina’s adoption rate of 81 percent outranks the United States average of 80 percent (American Community Survey, 2015). See Figure 4, opposite page Data on the availability and adoption of broadband form part of the picture of where the Homework Gap exists, who it impacts, and what causes it. However, because broadband availability data are overstated, adoption data are only granular to the county level, and neither dataset systematically studies how households with school-age children are impacted, the partners determined a systematic study of the Homework Gap in North Carolina was needed.
  • 9.
    9 FIGURE 2 Broadband Availability:Advertised Speeds of at least 25 MBPS Download/3 MBPs Upload FIGURE 3 Broadband Adoption: Broadband Adoption Rates at all Speeds, 2015 FIGURE 4 Broadband Adoption Rate: North Carolina v. United States, 2016 Data derived from U.S. Federal Communications Commission Form 477 Data Release, December 2016 A provider that reports deployment of a particular technology and bandwidth in a census block may not necessarily offer that service everywhere in the block.
  • 10.
    10 Developing the Pilot Survey Withoutnational or state datasets to measure the Homework Gap quantitatively, the researchers developed a mixed-method survey to measure its size, scope, causes, and impacts. The researchers identified two primary purposes: 1 To understand the scope of the Homework Gap in North Carolina’s Legislative Education Authorities (LEAs) 2 To better understand the barriers to students’ access to internet and their use of it for homework and school activities Given the Homework Gap’s close relation to broadband adoption, the researchers began the survey development process by compiling a list of relevant questions from surveys previously administered by broadband and education researchers such as BIO (and its predecessors, NC Broadband and eNC Authority) the Pew Research Center, CoSN, the Census Bureau and SpeakUp!. From this list, the researchers selected the questions that best matched the research’s purpose. The researchers then modified and adapted the questions from previous research to ensure each question served the research goals. Additional questions were added to achieve the research goals. The researchers also consulted with subject matter experts on final format and design. The final survey was a mix of 17 quantitative and qualitative questions, including demographic questions. It was also translated into Spanish to reach more households. The survey was primarily administered online, however some districts and partners distributed and collected printed copies of the survey. The target survey population for the survey was all North Carolina households with school-age children (K-12). Given the pilot nature of the study, the time restraints, and the limited budget, researchers were unable to survey the entire target population. Instead, the researchers employed a nonprobability volunteer sample strategy. This strategy consisted of partnering with several organizations that interact with K-12 households to highlight the survey in their communication with them or to distribute the survey to them directly (see Appendix F for full list of partners). Online and paper versions of both the English and Spanish versions of the survey were provided. The primary mode of distribution was online; however, partners were provided with a printable version to print and distribute if they chose. The researchers provided partners with a packet of prepared and customizable information to use to distribute the survey (see Appendices B-D). Most partners distributed online, however, several individual schools and at least one entire district printed the survey to distribute to students. Through DPI, the researchers asked North Carolina’s 115 school districts to distribute the survey to their student population. Similarly, the State Librarian’s Office informed all the state’s libraries of the survey, some of whom printed the survey for patrons to complete while visiting the library. To test the process of distributing paper surveys, BIO printed and distributed paper copies of the survey to one elementary school in Durham. All print surveys from the test school and all other locations were delivered to BIO who recorded the data for analysis. Data from the paper surveys was flagged when entered to allow for comparative analysis to surveys completed online. The survey was open for nearly two months. Initially slated to be open for six weeks, from March 15, 2017, to May 1, 2017. The researchers extended the time to May 12, 2017 to allow for the collection of paper versions of the survey from partners. LIMITATIONS Methodological limitations include the unforeseen limitations of the survey logic in the online version, the structure of responses provided for one or two survey questions, and the inherent limitations of reaching an accurate population sample when the primary distribution method is online. Due to the limitations resulting from the distribution methodology, the sampled population did not represent the average North Carolinian. As such, the survey results are not generalizable, nor can they be used to estimate a definitive number of North Carolinian households impacted by the Homework Gap. However, given the results’ similarity to previous adoption studies, the results reliably report the barriers to internet access that impact K-12 households and how a lack of access impacts their and their children’s usage of the internet as well as their own comfort using the internet. The pilot study, and lessons learned in its distribution, will inform future research efforts. RESEARCH PURPOSES: 1 To understand the scope of the Homework Gap in North Carolina’s Legislative Education Authorities (LEA’s) 2 To better understand the barriers to students’ access to internet and their use of it for homework and school activities
  • 11.
    11 ABOUT THE RESPONDENTS Thesurvey was completed by 9,490 participants. Of the total participants, 8,485 completed the survey in full and were included in analysis. Of the 8,485, 752 participants completed a paper version of the survey while 7,733 participants completed the survey online. The number of responses (N) varies from question to question, but for most questions at least 7,000 respondents completed the question and are included in the analysis. Mothers or female guardians primarily completed the survey on behalf of their households — 82.85 percent of respondents were female, and 16.67 percent were male. Respondent’s children overwhelmingly attended North Carolina’s public schools — 96.98 percent reported that their children attend public schools. The respondent’s household size varied — 38 percent of respondents had one child, 44 percent of respondents had 2 children, and 18 percent had three. Most respondents were white, with 79.88 percent of respondents selecting “white” as their race/ethnicity. As table 1 (below) shows, respondents who reporting being Black/African American made up 9.61 percent of the responses and were the second-largest population represented. TABLE 01 Respondents by Race/Ethnicity RESPONSE # % Asian/Pacific Islander 112 1.41 Black/African American 761 9.61 Hispanic/Latino 411 5.19 Native American/American Indian 152 1.92 White 6,324 79.88 Other 157 1.98 On average, respondents reported a higher level of household income than the average household in North Carolina. The median income level for respondents was $74,999, whereas the state’s median income level is $49,999. Respondents also reported higher levels of educational attainment than the average North Carolinian. The average survey respondent’s educational attainment level was ‘Bachelor’s Degree’ while the average North Carolinian has completed “some college” according to data from the American Community Survey (ACS, 2017). At least one household participated from 99 of North Carolina’s 100 counties. Some school districts and schools promoted the survey more heavily than others, so some regions were disproportionately represented in the sample population. Of the 9,490 total respondents who completed the survey, 110 completed the Spanish version of the survey. See Figure 5, page 16 RESPONDENTS BY THE NUMBERS Total Survey Participants 9,490 Usable Results 8,485 Completed Online 7,733 Completed on Paper 752 Survey Analysis From the primary research questions, the researchers compiled a list of questions designed to provide a framework for analysis and a deeper understanding of the responses. In addition to summary statistics compiled for each survey question, statistical tests were performed. The following section contains the major findings from the analysis. The full analysis is found in Appendix E.
  • 12.
    12 FINDING 1 10 percentof respondents reported not having broadband access at home. Contrary to the researcher’s hypothesis, people who completed the survey online as opposed to the paper version did not differ in the extent to which they reported having internet access in their homes as seen in Table 1. However, due to the survey’s limitations caused by sampling method, this figure of 10 percent is not generalizable to the state as whole. Meaning, the statewide percent of K-12 households who lack access to broadband is still unknown. However, this finding does not significantly differ from national and previous state estimates. Pew Internet estimated the Homework Gap affected roughly 17.5 percent of K-12 households in 2015. 2013 data from the North Carolina’s Citizen’s Survey indicated roughly 14 percent of North Carolina’s K-12 households did not have broadband at home (Wilson, 2014). Thus, while further study is needed to determine the actual percent of North Carolina’s K-12 households impacted by the Homework Gap, the difference between the survey’s finding and the actual figure is likely not greater than 5 to 15 percentage points. TABLE 02 Online v. Paper Survey Internet Access INTERNET ACCESS NO INTERNET ACCESS Online 89.3% 10.6% Paper 89.1% 10.9% The lack of access was dispersed relatively evenly across the state, and was present in both rural and urban areas. See Figure 6, page 16 FINDING 2 Cost was the primary barrier to broadband access for respondents. Of the 10 percent of respondents without access, 65.96 percent (n=799—or the majority of those without access) cited cost as the primary reason for not having internet in their homes. This is like national data which show that cost and relevancy (a lack of understanding of how the internet impacts one’s life) were the two primary reasons households with school-age children cited for not having access in 2015 (U.S. Department of Education, 2018). This was particularly true for those with low incomes (those making less than $34,999) — 76.2 percent of whom indicated cost was the primary barrier. TABLE 03 Relationship Between Income Level and ‘Too Expensive’ as Main Reason Respondent Does Not Have Broadband Home Access; N=777 INTERNET ACCESS NO INTERNET ACCESS Low (Less Than $10,000 - $34,999) 23.8 % 76.2 % Medium ($35,000 - $74,999) 43.4 % 56.6 % High ($75,000 - $200,000+) 81.2 % 18.8 % Lack of access to the service itself was the second most-frequent response with 23.27 percent of respondents citing “it is not available in my area” as a reason for not having access in their home. Respondents could choose multiple reasons. Major Findings The survey analysis unearthed seven major findings that address the primary research purposes: to better understand the scope of the Homework Gap in North Carolina’s 115 school districts, and to better understand the barriers to students’ access to the internet and their use of it for homework and school activities.
  • 13.
    13 Cost was alsothe primary barrier to device ownership. While just 36 respondents reported not owning a single digital device, 69.44 percent of them cited cost as the primary reason for not owning a device. However, for high-income respondents without broadband access (those with annual incomes greater than $75,000), the primary reason they lacked broadband at home was because it was not available at their household. 71.9 percent of those without access who also had high incomes indicated that it was the main reason they lacked access. TABLE 04 Relationship Between Income Level and ‘Not Available’ as Main Reason Respondent Does Not Have Broadband Home Access; N=777 IS NOT A MAIN REASON IS A MAIN REASON Low (Less Than $10,000 - $34,999) 87.4 % 12.6 % Medium ($35,000 - $74,999) 59.8 % 40.2 % High ($75,000 - $200,000+) 28.1 % 71.9 % The response option, “Internet Too Slow” was the third-most frequent selection as a reason for not having home broadband access. However, as with the availability of the service itself, this response was more frequent among households with high incomes. 12.5 percent of high-income respondents indicated the speed of the service was their primary barrier, whereas 6.2 percent of low-income households selected the same option. Other response options — ‘’Don’t see the need for it,” “My device does not connect,” “I use the internet somewhere else,” and “Concerns about online privacy,” — did not significantly impact respondents access to broadband in their home. TABLE 05 Relationship Between Respondents Without Access and Main Reason for Not Having Internet in their Home; N=937 RESPONSE OPTION NOT FOR THIS REASON FOR THIS REASON Don't see the need for it 96.37 % 3.63 % Not available in my area 76.73 % 23.27 % Internet too slow 91.36 % 8.64 % My device does not connect 97.65 % 2.35 % Too expensive 34.04 % 65.96 % I use the internet somewhere else 92.85 % 7.15 % Concerns about online privacy 97.23 % 2.77 % Other 89.01 % 10.99 % Mobile devices and smart phones were included as possible response options for the question that gauged device ownership. As such, many respondents had access to a mobile or smartphone only. However, the survey was constructed in such a way to prevent a calculation of the number of households with a mobile or smart phone only. Future research should separate mobile phone ownership from computer ownership to better understand the true nature of device ownership. FINDING 3 The lower the respondent’s income and education levels, the less likely they were to have broadband access at home. The data show that the higher a household’s income, the more likely it was to have access to broadband, even free broadband. And the higher a person’s income, the more likely they were to have broadband access. The median income bracket for respondents without access was $25,000-34,999 — 65 percent of those without access reported household incomes of $34,999 or less. The same is true for educational attainment. The lower the household’s educational level, the less likely it was to have access at home. Of those without access at home, 64 percent responded as having completed “Some College” or less. Those with access were more likely to have a bachelor’s degree or higher than those without access.
  • 14.
    14 The relationship betweenrace and/or ethnicity and broadband access was less clear. This is primarily due to the make-up of the respondents, which was predominantly white with 79.8 percent. However, national research shows that higher percentages of minority-led households lack access when compared to their white peers (Pew Research Center, 2015). To better understand the relationship between race/ethnicity and broadband access in North Carolina, further research is needed. FINDING 4 Most respondents without broadband access also do not own a desktop, laptop, or tablet. 78.9 percent of respondents without internet access do not own a desktop computer and 51.4 do not own a laptop computer. Meanwhile, only 9.3 percent of respondents with a paid subscription do not own a laptop computer. The ownership difference between those with and without broadband access is statistically significant for all three digital device types. However, of the three device types, respondents without broadband access were most likely to own a tablet. 57.1 percent of respondents without access reported owning a tablet, while 48.6 percent reported owning laptops and 21.1 percent indicated they owned a desktop computer. TABLE 06 Relationship Between at Home Access and Ownership of Tablet; N=8,257 DOES NOT OWN OWNS Paid Access 9.5 % 90.5 % Free Access 28.3 % 71.7 % No Access 42.9 % 57.1 % Ownership of other types of internet-enabled devices such as smart TVs, streaming devices, and gaming systems was less frequent than desktop, laptop and tablet ownership among those with broadband access and without. However, those with access continued to own these devices at a greater rate than those without broadband access. FINDING 5 Smart phone device ownership was nearly universal among respondents, but those without home broadband access were more likely to not own a smart phone. The most popular device for accessing the internet among respondents was the smart phone. 98% (n=7,691) of households reported owning at least one smart phone. TABLE 07 Relationship between Access at Home and Ownership of Smart Phone Devices; N=8,653 0 1 2 3 4 Paid Access 1.8 % 10.4 % 34.7 % 27 % 26.2 % Free Access 4.7 % 23 % 26.7 % 19.3 % 26.4 % No Access 9 % 29.2 % 33.6 % 15.4 % 12.8 % However, analysis demonstrated a statistically significant difference in the number of smart phones individuals reported owning based on their internet access at home. Those with home broadband access were more likely to own more smart phones. Those without access were more likely to own fewer smart phones or no smart phone at all. For instance, 9 percent of those without broadband access reported not owning a smart phone, while for those with access, just 1.8 percent reported not owning a smart phone.
  • 15.
    15 FINDING 7 Students withoutbroadband access at home use the internet most frequently in someone else’s home. To better understand where K-12 students complete homework that requires internet access, the survey asked parents to rate the frequency at which their children visited a variety of locations to complete homework requiring the internet. ‘Someone Else’s Home’ was the most frequent response from all respondents and those without access. Of those without access, 45 percent reported accessing the internet in someone else’s home at least once a week while 20 percent of the total respondents reported the same. Restaurants and libraries were equally popular (at 31 percent) among those without access while for the entire survey population restaurants (at 12 percent) outranked libraries (at 9 percent). These results mirror national data which also identified “someone else’s home” as the most popular place to access the internet outside of school (U.S. Department of Education, 2018). Public libraries outrank restaurants by 13 percentage points in the national data, however, indicating further study of North Carolina’s most popular destinations is needed. FINDING 6 Households without broadband access were less comfortable in helping their children with schoolwork and completing other online tasks themselves. The difference in levels of comfort in assisting their children with online schoolwork between respondents with access and those without was statistically significant. In addition, there was a statistical difference between those with and without access and their level of comfort in using digital devices and the internet to complete each of the categories surveyed: online banking, completing work, online shopping, accessing personal information, job searching, and accessing entertainment. Meaning respondents with broadband access were more comfortable navigating and using digital devices than those without access at home. TABLE 08 Level of Parent’s Comfortability in Helping Children with Schoolwork by Access Level; N=7,995 VERY UNCOMFORTABLE SOMEWHAT UNCOMFORTABLE SOMEWHAT COMFORTABLE VERY COMFORTABLE Paid Access 9 % 6.1 % 22.3 % 62.6 % Free Access 13.9 % 7.4 % 29.2 % 49.5 % No Access 16.5 % 11.3 % 28.1 % 44.1 %
  • 16.
    16 FIGURE 6 Count ofHouseholds Reporting They Do Not Have Home Access by Zip Code FIGURE 5 Count of Survey Participants by Zip Code
  • 17.
    17 The Homework Gap ConveningSummary To continue conversations held during the 2016 “Digital Equity Convening,” reveal and discuss the preliminary data and findings from the survey, and engage stakeholders and subject matter experts in designing solutions to close the Homework Gap, the partner organizations hosted a convening called “The Homework Gap Convening” on September 13, 2017 at the Friday Institute. Representatives from local and state governments, institutes of higher education, private business, public organizations, and schools/districts assembled to engage in productive conversations about eradicating the Homework Gap. The schedule for the day was intentional. Each session addressed eliminating the Homework Gap and provided opportunities for the participants to engage in meaningful discussion. The following sections of this paper will provide an overview of the day, including participants’ feedback during working groups and recommendations for addressing digital inequities in NC. OPENING SESSION The Convening featured speakers from the partner organizations as well as Governor Roy Cooper’s Senior Education Advisor Geoff Coltrane, Department of Information Technology’s Secretary Eric Boyette, and a keynote address from FCC Commissioner Jessica Rosenworcel. Dr. Glenn Kleiman set the tone for the day with a welcome and a brief explanation of the importance of addressing digital inequities in North Carolina’s schools.
  • 18.
    18 Throughout all thiswork which dates back 10 years, we’ve made great progress, but this issue of equity has been a critically important one – equity of access, equity of opportunity for all students across the state. We’ve made great progress in the schools themselves but still this issue of what’s called the Homework Gap…is enormous. ”DR. GLENN KLEIMAN, FORMER DIRECTOR, FRIDAY INSTITUTE If we are not able to bridge this Homework Gap, our state’s children, our future workforce, will not be adequately prepared for the jobs of the 21st century. In addition, expanding broadband access, especially in our rural communities, will help to expand economic opportunities for families across North Carolina. ”GEOFF COLTRANE, SENIOR EDUCATION ADVISOR, OFFICE OF THE GOVERNOR Jeff Sural, BIO’s Director, provided an overview of BIO and its interest in solving the Homework Gap. In addition, he provided a working definition for the Homework Gap that would be used throughout the day, “students who are assigned homework requiring access to the internet, but don’t have home access.” “ “Kleiman then invited attendees to settle in for a day filled with the promise of making a difference in the lives of students. He closed by mentioning that the very solution to the Homework Gap could reside in the minds of the diverse crowd assembled for the convening. “This is a working session in which we plan to put you to work to get your best ideas.” Sural was followed by Coltrane, who brought remarks from the governor’s office. Coltrane discussed Governor Cooper’s Common Ground Solutions budget, which included $20 million to improve internet access and service to households and businesses in underserved areas of North Carolina. In conclusion, he shared the words of Governor Cooper:
  • 19.
    19 HOMEWORK GAP SURVEY DATA PRESENTATION Representativesfrom the BIO and the FIRE Group led the following session in which they reaffirmed the definition of the Homework Gap, provided context about the broadband challenges facing North Carolina, and provided an overview of the survey development process, survey administration, the analysis procedures, and the results. The presenters explained the impetus for the survey, the primary findings from the data, and lessons learned in conducting the survey. The data was provided to each participant in a visual report to refer to and use during the brainstorming sessions in the afternoon. KEYNOTE ADDRESS: JESSICA ROSENWORCEL, FEDERAL COMMUNICATION COMMISSIONER Federal Communication Commissioner Jessica Rosenworcel delivered an inspiring keynote address highlighting both the need for closing the Homework Gap and innovative solutions she’s witnessed across the country. She began by recounting how she first encountered the Homework Gap while visiting Department of Information Technology Secretary Eric Boyette began his remarks by thanking the convening participants for their attendance and encouraged them to actively engage contacts in their sphere of influence to help reduce the Homework Gap. He lauded the progress made to connect North Carolina’s schools, but pointed to limited levels of access to devices and broadband connectivity as barriers to some students. He ended his remarks by asking participants to dig deep and help move the work forward in a meaningful manner. a middle school, and subsequently coined the term to describe the condition she witnessed when K-12 students are assigned homework that requires internet access, but don’t have access at home. She continued by sharing stories from across the country of how students “cobble together” access by using restaurants, late-night school access, and appealing to family and friends. She complemented the progress North Carolina has made toward narrowing the divide thus far and charged the state to continue refining existing programs and designing new mechanisms to support digital age learning and sustainable, comprehensive solutions for closing the Homework Gap. Federal Communication Commissioner Jessica Rosenworcel addresses a room of stakeholders at the Homework Gap Convening. “The good news is that our K-12 schools are all connected. That’s a big plus. We are a model state. We have had other states ask how have you done this, which is a good thing for North Carolina. Still we have a growing divide and too many of our state’s children lack the means for broadband access and the tools that they need to be successful and to build our workforce for the future. ”ERIC BOYETTE, SECRETARY AND STATE CHIEF INFORMATION OFFICER, NORTH CAROLINA DEPARTMENT OF INFORMATION TECHNOLOGY
  • 20.
    20 HOMEWORK GAP SOLUTIONS PANEL Apanel of local leaders from Charlotte, Lee County, and Montgomery County moderated by Phil Emer of the Friday Institute described their efforts to close the Homework Gap. With a mix of rural and urban participants, the panel presented strategies for addressing the Homework Gap for both types of communities. Bruce Clark, Executive Director of Digital Charlotte, shared information about the implementation of a Sprint 1Million program in Charlotte-Mecklenburg schools that will provide 2,500 hotspots to high school students over five years. Rob Dietrich of Lee County described the partnership with UR Cast and U.S. Cellular to provide low-bandwidth hotspots and caching software through which students can download pages and information from the internet for the completion of homework before leaving school and upload it when they return. And Beth Lancaster of Montgomery County detailed their initiative to install Wi-Fi equipment on school buses with long commutes for students to complete homework while traveling to and from school. When asked about how they could sustain and expand their efforts, the panelists cited the need for additional grants and engaging support from local elected officials like county commissioners. In addition, Dietrich noted the need for sustainable funding to comprehensively address the Homework Gap in his district and statewide. “ Panelists pictured from Left to Right, Beth Lancaster, Rob Dietrich, and Bruce Clark. A grant is a short-term band aid solution to a long-term problem. Eventually, the grants will run out. Eventually, it won’t serve what I need. I need long-term help from organizations bigger than school systems like county commissioners, state budgets, federal budgets that will give me the ability to put devices in the hands of the kids. ”ROB DIETRICH, DIRECTOR OF TECHNOLOGY AND ACCOUNTABILITY, LEE COUNTY SCHOOLS Themes, ideas and recommendations for stakeholders considering implementing programs to close the Homework Gap from local expert’s panel: •• The importance of identifying service providers with which to partner •• Map broadband availability data to visualize access availability and gaps •• Consider implementing technologies to help bypass a lack of access at home like caching software •• Negotiate with broadband service providers to ensure affordability •• Consider leveraging programs like E2D’s ReImage CLT program where students refurbish devices •• Clearly articulate definition of access at beginning of initiatives •• Determine sustainability plans at beginning of projects so initiatives can be sustained beyond life of grant programs •• Find advocates for additional funding from local, state, and federal elected leaders •• Release state surplus devices to nonprofit technology refurbishers dedicated to closing the digital divide.
  • 21.
    21 In addressing theguiding question, the Technology group’s conversation centered around ideas for leveraging existing technologies and creating more efficient pathways to get those technologies into the K-12 schools. For example, much of the discussion centered on the inability of state government agencies to donate their devices to non-profit refurbishers due to barriers found in the state’s statutes and administrative code. The group’s discussion of this point, acknowledges that much of the technology students need to participate fully in and outside the classroom already exists, but is not always accessible to all populations. As such, the Technology group identified the following potential solutions: •• Determine a way to “unlock” the state surplus law (S.L. 2017-67) passed by the NCGA in the 2017-2018 Session •• Conduct a demand aggregation by school district to gather data on the number of K-12 students who lack devices at home •• Create a clearinghouse for information, resources, and best practices so each school district implementing device programs are not recreating the wheel Additional recommendations included to continue working to ensure e-Rate modernizes and supports technology expansion in the schools, and to design a state initiative to fund the distribution of devices to students. SUSTAINABILITY The primary questions the Sustainability breakout group was charged with addressing was, “What are some creative financing models for closing the Homework Gap?” and “What are the best ways to sustain those models?” The group’s discussion centered around four types of organizations that can all impact the sustainability of Homework Gap solutions: State government, Local SOLUTIONDESIGNBREAKOUTGROUP SESSIONS In the afternoon, participants divided into working groups discussing four areas: 1 Technology, Infrastructure, and Devices 2 Sustainability 3 Policy 4 Research and Data A facilitator guided each group through conversations designed to both define the challenges associated with each topical area and develop thoughtful recommendations for practical next steps. The concurrent sessions began with a brief introduction of the participants in which they provided their name, organizational affiliation, and their connection to or reason for interest in the Homework Gap. Next, a guiding question aligned to the session topic was posted to generate ideas. Each participant was given small slips of paper to record their answers. The responses were placed on the wall and grouped by similarities. Each participant then received three stickers to select the top three areas they would like to discuss. Once the top three areas were identified, the group discussed in more detail those areas and produced a list of recommendations from each group discussion (see Appendix G for a full summary). Summaries of the discussions and recommendations from each group follow. TECHNOLOGY,INFRASTRUCTUREAND DEVICES The primary question the Technology, Infrastructure and Devices (Technology for short) breakout group was charged with addressing was, “What technologies are needed to bridge the Homework Gap?” Convening attendees participate in a brainstorming activity in their breakout session. The Sustainability breakout group discuss how to design sustainable solutions.
  • 22.
    22 government, school districts,and private entities. Potential solutions the Sustainability working group compiled based on the discussion follow: •• All levels of government •• Develop public-private partnerships with entities such as banks, churches, local governments, and state government to address all the factors contributing to the Homework Gap. •• State government •• Reduce costs of wireless service to mobile hotspots to check out to students by using a state-level agency contract to negotiate lower costs for all school districts, just as DPI does for instructional resources (textbooks). •• The NCGA should create line items that require funds previously dedicated to funding textbooks be used to provide devices or broadband connectivity for students without home access. •• Local government and school districts •• Engage in open conversations with service carriers about allowing them to put cell towers on district properties on a lease. •• Consider making same option available to nonprofit organizations. Additional suggestions included encouraging teachers to not assign homework that requires internet access, and a suggestion that the state dedicate funds garnered from the North Carolina Education Lottery to purchase devices and hotspots or other forms of access for students. POLICY Participants of the Policy breakout group focused on the question, “What policy changes are needed at the local, state, and federal level to bridge the Homework Gap?” The group spent most of the allotted time discussing state- level challenges and opportunities for modifying existing or designing new state policies to address the primary causes of the Homework Gap. Four potential solutions the group discussed follow: •• Modify existing federal and state laws to allow surplus government computers to be donated to non-profit computer refurbishers dedicated to ending the digital divide. With the additional supply of computers from state agencies, the non-profit refurbishers can scale their current operations to deliver more low-cost computers to households without computers across the state. •• Compile best practices and provide examples of opportunities municipal and county governments can engage in to improve broadband access in their communities within the confines of the current laws. •• The NCGA should clarify S.L. 2011-84 to provide guidance for municipalities who desire to engage in improving broadband access in their communities but are unsure how to do so within the confines of the current law. •• The NCGA should fund and create a state grant program designed to make high-cost rural areas more economical for private providers to deploy service to unserved areas. RESEARCH AND DATA The Research and Data working group focused on the guiding question, “How can we improve upon the pilot research, data collection, and analysis?” The group spent time considering the various challenges of issuing a statewide survey. For instance, a member of the research team described the inherent costs and challenges of distributing and collecting paper versions of the survey. The group also discussed various ways to improve the survey distribution and collection process to increase the response rate and improve the understanding of the Homework Gap. The potential solutions the Research and Data group devised follow: •• Improve the survey’s data collection to ensure there is a wider response from more diverse participants. •• Target distribution to rural and high-need poverty areas as households in those areas are more likely to fall into the Homework Gap. •• Shorten the survey to prevent survey fatigue and increase the full response rate. •• Use data analytics of data from other sources to provide supplemental data to form a more complete view of the Homework Gap. For example, analysis of each student’s use of school-purchased education software at home after-school hours could both determine usage trends and be used as a proxy for connectivity.
  • 23.
    23 Due to theinterconnected nature of the factors that contribute to a lack of broadband access and adoption and those that cause the Homework Gap, policies and programs that increase broadband access, adoption and use will also contribute to a sustainable solution for closing the Homework Gap. Policies and programs directed towards improving both the availability of broadband and its adoption should be pursued. This includes policies and programs that address the digital divide and digital equity issues. For example, the North Carolina General Assembly’s recent establishment of the Growing Rural Economies with Access to Technology (GREAT) Program designed to facilitate the increased deployment of broadband to unserved areas will contribute to closing the Homework Gap if access is expanded to areas in which K-12 households live where it was previously unavailable (S.L.2018-5). Other policies to consider are increasing access to affordable devices by allowing state surplus computers to be donated to non-profit refurbishers dedicated to ending the digital divide, programs that increase digital literacy skill class offerings across the state, and implementing dig-once and one-touch policies. Additional policy and program recommendations are found in the State Broadband Plan. Closing the Gap: Recommendations to Close North Carolina’s Homework Gap When combined, the survey’s findings and the potential solutions supplied by the convening’s breakout groups result in six recommendations for policymakers, state leaders, and stakeholders to undertake to close the Homework Gap in North Carolina. The recommendations follow: The State should establish a one-year pilot grant program with the intention of creating a five-year program, or until state-wide universal access is established, to provide grant funding for mobile hotspot devices or Wi-Fi for school buses for students without internet service, due to access or affordability, at home. While further research is needed to understand the full scope of North Carolina’s Homework Gap, action to close the gap cannot be postponed for the K-12 students who currently fall into the Homework Gap. To date, numerous individual schools and school districts across the state and nation have completed successful pilot programs to close the Homework Gap in their districts. Given the urgency of the need, North Carolina should dedicate funding to enact a time-limited grant program through which LEAs can leverage state funding to develop or scale Homework Gap solutions in their districts. The grant program should be managed by BIO with expertise provided from partners like DPI and the Friday Institute. The grant will enable LEAs to apply for grant funds from NCDIT to purchase 1) mobile hotspots devices, 2) service for the hotspots and, if eligible 3) equipment and mobile service to provide Wi-Fi on school buses. Given that homework requiring internet access is regularly assigned across all grade levels in North Carolina (New Teacher Center, 2018), the grant program should serve grades 3 through 12 at minimum. However, since more high school students are assigned homework requiring internet access than middle and elementary students, the grant program should serve high school students the first year and expand to serve lower grade levels in subsequent years. The State should dedicate funding to establish a grant program housed in NC BIO to close the Homework Gap. The State should pursue the implementation of policies and programs that increase the availability, adoption, and use of broadband. 1 2
  • 24.
    24 The Homework Gapis a multi-faceted challenge and will require collaboration between a host of partners and stakeholders to solve. Building upon the work of the Convening, the State should engage and convene stakeholders from both the public and private sector to design and implement innovative, sustainable solutions. Any measure addressing the Homework Gap should take into consideration all its causes. The survey results confirm that the cost of service, the cost and access to devices, and access to the service itself can all inhibit K-12 households from adopting broadband in their homes. In addition, the lack of access at home is intricately bound with the household’s ability to effectively utilize the technology to participate in the online activities that define the 21st century. As such, Homework Gap solutions should be designed to address each of these barriers and utilize the subject matter expertise of a range of organizations and partners. While the survey provided valuable information about North Carolina’s Homework Gap, further study is required to understand its full size, scope and the degree to which each factor contributing to it affects North Carolinians. Thus, the BIO and partners should continue collaborative efforts to survey the K-12 population to measure the Homework Gap, its causes, and its effects. To continue studying the Homework Gap, dedicated, sustainable funding and continued and expanded partnerships with education-focused organizations, school districts and individual schools will be required. Research and data analysis support from partners like the Friday Institute will also be necessary. The BIO and partners should also investigate alternative and cost-effective ways through which the survey can be administered. Incorporating the survey into existing surveys administered to K-12 populations could prove an effective method of continuing the research in the future. Many of the most innovative solutions to closing the Homework Gap have been designed by those closest to the population affected by the Homework Gap — local governments and local school districts. As the experts on the Local Solutions panel at the Homework Gap Convening demonstrated, closing the Homework Gap requires innovation and a unique understanding of the community’s population. In addition, North Carolina’s local governments and school districts understand the unique needs of their constituents and citizens. They should continue innovating and testing new solutions and partner with the State to implement best practices. Despite numerous rounds of edits and pre-testing the survey, the survey deployment revealed flaws in the instrument design. For example, the online version of the survey did not allow respondents to answer why they did not have broadband service at home if they had first selected that they had mobile service. Given the intrinsic difference and capabilities of mobile vs. wireline service, questions investigating respondent’s subscription to these two types of broadband service should be separated in the future. In addition, the methods used to distribute the survey were unable to capture a true representation of North Carolina’s demographics. Future survey distributions should devise a method by which to reach a more representative sample of North Carolina’s population. The State should foster cross-sector collaborations and public-private partnerships to implement and sustain multi-faceted solutions. The State should continue to study the Homework Gap. The survey instrument and its distribution should be modified to garner more reliable results. North Carolina’s local governments and LEAs should continue to innovate and partner with the State to close the Homework Gap. 3 5 6 4
  • 25.
    25 Conclusion The North Carolina’sState Board of Education has six primary goals stated on its website. The first is that “every student in the NC Public School System graduates from high school prepared for work, further education and citizenship.” Many factors may impact the State education system’s ability to reach this goal, among them is an inequity of access to the opportunities and resources the internet provides. Should the Homework Gap not be addressed in a systematic, comprehensive way, it will continue to grow. If its growth continues unhampered, an increasing number of students impacted by it will not be prepared for the work of the 21st century. Neither will they be adequately prepared to thrive in continuing education environments, or contribute to the well-being of their local, national, and global communities. As previously noted, the Homework Gap is a solvable issue. Both research and the implementation of innovative pilot programs across the state have proven that if strategic, holistic solutions are implemented, the Homework Gap can be closed. North Carolina has a long history of solving seemingly intractable issues. Through dedicated, strategic partnerships between the General Assembly, multiple Governors and subject matter experts like the Friday Institute, North Carolina led the country in ensuring every school house in North Carolina has access to high-speed broadband. Should a similar partnership and dedicated effort to close the Homework Gap be undertaken, North Carolina could again make history and be the first state to close the Homework Gap for all its citizens.
  • 26.
    26 Act to ProtectJobs and Investment by Regulating Local Government Competition. North Carolina General Assembly. (2011). S.L. 2011-84 Current Operations Appropriations Act of 2018. North Carolina General Assembly. S.L. 2018-5. Section 337.1 (a). (2018). Develop and Implement Digital Teaching and Learning Standards Act. North Carolina General Assembly. S.L. 2013-11. (2013). Digital divide. (n.d.) in Oxford Dictionary online. Retrieved from: https://en.oxforddictionaries.com/definition/digital_divide Federal Communications Commission. Fixed broadband deployment data from FCC Form 477. 2017. Retrieved from https://www.fcc.gov/general/broadband-deployment-data-fcc-form-477 Federal Communications Commission. Internet access services: status as of December 31, 2016. (2018). Industry Analysis and Technology Division, Wireline Competition Bureau. Retrieved from https://apps.fcc.gov/edocs_public/ attachmatch/DOC-349074A1.pdf Friday Institute for Educational Innovation. North Carolina digital learning plan. (2015). Raleigh, NC: NC State University College of Education. Retrieved from http://dlplan.fincsu.wpengine.com/wp-content/uploads/sites/11/2015/09/NC- Digital-Learning-Detailed-Plan-9-14-15.pdf Horrigan, J. (2015). The numbers behind the homework gap. Pew Research Center. Retrieved from http://www.pewresearch.org/fact-tank/2015/04/20/the-numbers-behind-the-broadband- homework-gap/ KewalRamani, A., Zhang, J., Wang, X., Rathbun, A., Corcoran, L., Diliberti, M., and Zhang, J. (2018). Student access to digital learning resources outside of the classroom (NCES 2017-098). U.S. Department of Education. Washington, DC: National Center for Education Statistics. Retrieved [date] from https://nces.ed.gov/pubsearch/pubsinfo. asp?pubid=2017098 New Teacher Center. North Carolina teacher working conditions survey 2018. (2018) Retrieved from https://ncteachingconditions.org/results/239 North Carolina Department of Information Technology. (2016, June) Connecting North Carolina: state broadband plan. Retrieved from https://www.ncbroadband.gov/wp-content/uploads/2017/02/NC-Broadband-Plan_2017_Online_ FINAL_PNGs3www.pdf Surplus Computers for Low-Income Students. North Carolina General Assembly. (2017). S.L. 2017-67 The Consortium for School Networking. Supporting students & families in out-of-school learning. (2018). Retrieved from https://cosn.org/sites/default/files/2018%20Digital%20Equity%20Toolkit%20FINAL_0.pdf Transition to Digital Learning Act. North Carolina General Assembly. S.L. 2013-12. (2013). U.S. Census Bureau. American Community Survey Data. (2015). Retrieved from https://www.census.gov/programs-surveys/acs/ U.S. Census Bureau. American Community Survey Data. (2016). Retrieved from https://www.census.gov/programs-surveys/acs/ Wilson, K & Powers, R. Digital technology and internet access trends in North Carolina: 1999-2013. (2014). East Carolina University. References
  • 27.
  • 28.
    28 Instructions: You mayuse this stock email to contact your participants. Insert your organization’s information into highlighted sections. Dear Parents, Nationally, 7 in 10 teachers assign homework that requires internet access. But an estimated five million households with school-age children do not have internet access at home. Students that fall into this “homework gap”—households where internet access is limited or unavailable—lag behind in education and are less competitive in the workforce. But as a parent of children in North Carolina’s K-12 schools you already know what happens when your children and/or their classmates can’t meaningfully access the internet. Many of you spend hours each week driving your children to a nearby McDonalds or Starbucks to use their Wi-Fi because internet is not available to your house or it’s too expensive. Or trek to the local library multiple times a week so your kids can use the computers because your digital device is broken, being used by one of your other children, or you don’t have one at home because buying one doesn’t fit in your budget. The State of North Carolina wants to help ensure no child in the K-12 schools falls into the homework gap. But to do so, the State needs to know how widespread the homework gap is and potential challenges students face in accessing digital resources. To identify this data, our partners, the Broadband Infrastructure Office and the Friday Institute, are conducting a survey of North Carolina households with K-12 students. We would like to encourage you to take the survey so policy makers and education stakeholders can design solutions to this issue. The anonymous, short survey is available in English and Spanish and can be found here K-12 Internet Access at Home Survey (Encuesta de Accesso a Internet K-12 en el Hogar) or at below link. It remains open until April 30, 2017. Should you have any questions, concerns, or feedback, you can reach out to the Broadband Infrastructure Office directly at: broadband@nc.gov or (919) 754-6695. Thank you for your continued support of [INSERT YOUR ORGANIZATION’S NAME HERE], we appreciate all you do. Sincerely, [INSERT YOUR NAME HERE] Survey Link: http://bit.ly/k12hwgap APPENDIX A Letter Accompanying Survey for Parents Form Email to Parents Asking Them to Participate in the Homework Gap Survey
  • 29.
    29 APPENDIX B Sample HomeworkGap Blog or Newsletter Post Nationally, 7 in 10 teachers assign homework that requires internet access. But an estimated five million households with school-age children do not have internet access at home. Students that fall into this “homework gap”—households where internet access is limited or unavailable—lag behind in education and are less competitive in the workforce. But if you’re a parent with children in North Carolina’s K-12 schools you already know what happens when your children and/or their classmates can’t meaningfully access the internet. Many of you spend hours each week driving your children to a nearby McDonalds or Starbucks to use their Wi-Fi because internet is not available to your house or it’s too expensive. Or trek to the local library multiple times a week so your kids can use the computers because your digital device is broken, being used by one of your other children, or you don’t have one at home because buying one doesn’t fit in your budget. The State of North Carolina wants to help ensure no child in the K-12 schools falls into the homework gap. But to do so, the State needs to know how widespread the homework gap is and potential challenges students face in accessing digital resources. To identify this data, our partners, the Broadband Infrastructure Office and the Friday Institute, are conducting a survey of North Carolina households with K-12 students. We would like to encourage you to take the survey so policy makers and education stakeholders can design solutions to this issue. The anonymous, short survey is available in English and Spanish and can be found here K-12 Internet Access at Home Survey (Encuesta de Accesso a Internet K-12 en el Hogar) (or at below link). It remains open until April 30, 2017. Should you have any questions, concerns, or feedback, you can reach out to the Broadband Infrastructure Office directly at: broadband@nc.gov or (919) 754-6695. Survey Link: http://bit.ly/k12hwgap
  • 30.
    30 APPENDIX C K-12 InternetAccess At Home Survey K-12 INTERNET ACCESS AT HOME SURVEY This survey is for North Carolina parents/guardians of students in grades K-12. The purpose of the survey is to determine how access to the internet outside of school impacts NC’s K-12 students’ ability to complete homework. Results will be used to inform further research and policy suggestions for assisting households and communities where internet access is unavailable or inadequate. Your responses are anonymous and you are free to decline participation at any time. The survey will take 5–10 minutes to complete. Thank you in advance for your participation. Your input will help inform the State as we work to increase internet access throughout the state. Should you have any questions or concerns please contact the Broadband Infrastructure Office: email: broadband@nc.gov | phone: (919) 754-6695. Broadband Infrastructure Office, North Carolina Department of Information Technology broadband@nc.gov | 919 754 6695
  • 31.
    31 APPENDIX C Accesso AInternet K-12 En El Hogar ACCESO A INTERNET K-12 EN EL HOGAR Esta encuesta es para los padres/guardianes de estudiantes en los grados K-12 de Carolina del Norte. El propósito de la encuesta es determinar cómo el acceso a Internet fuera de la escuela que afecta la habilidad de los estudiantes de K-12 de NC para completar la tarea. Los resultados se utilizarán para informar más investigaciones y sugerencias de políticas para ayudar a hogares y comunidades donde el acceso a Internet no está disponible o es inadecuado. Sus respuestas son anónimas y usted es libre de rechazar la participación en cualquier momento. La encuesta tomará 5-10 minutos para completar. Gracias por tu participación por adelantado. Su contribución ayudará a informar al Estado como mientras trabajamos para aumentar el acceso a Internet en todo el estado. Si tiene algunas preguntas o inquietudes, comuníquese con la oficina de la Oficina de Infraestructura de Banda Ancha: Correo electrónico: broadband@nc.gov | teléfono: (919) 754-6695 Broadband Infrastructure Office, North Carolina Department of Information Technology broadband@nc.gov | 919 754 6695
  • 32.
    32 PREGUNTA 1 ¿Ud tieneacceso a internet en su hogar? )) Sí, pago una suscripción mensual por internet. )) Sí, tengo acceso pero no pago una suscripción. )) No, no tengo acceso. Si respondió “No” a la pregunta 1, pase a la pregunta 3. PREGUNTA 2 ¿Cómo accede Ud. a Internet en su hogar? Marque todas las que apliquen. )) Plan de datos móviles para un teléfono o dispositivo móvil (e.g., Verizon, Sprint, etc.) )) Línea de abonado digital (DSL) (e.g., CenturyLink, Frontier, etc.) )) Módem de cable (e.g., Time Warner. etc.) )) Fibra óptica (e.g., AT&T U-verse, etc.) )) Servicio de Internet por Satélite (HughesNet, etc.) )) Dial-up )) No estoy seguro PREGUNTA 3 ¿Cuál es la razón principal por la que actualmente no TIENE ACCESO a Internet en su casa? )) No le interesa )) Acceso a Internet no es disponible en mi área )) Internet es muy lento )) Mi dispositivo digital no se conecta al Internet )) Acceso a Internet en hogar es muy caro )) Yo uso el Internet en otros lugares )) Tengo preocupaciones sobre de la privacidad en línea )) Otros (por favor especificar) ____________________ QUESTION 1 Do you currently have internet access at home? )) Yes, I pay a monthly subscription for internet. )) Yes, I have access but do not pay for a subscription. )) No, I do not have access. If you answered “No” to question 1, please proceed to question 3. QUESTION 2 How do you access the internet at home? Check all that apply. )) Cellular data plan (e.g., Verizon, Sprint, etc.) )) Digital Subscriber Line (DSL) (e.g., CenturyLink, Frontier, etc.) )) Cable modem (e.g., Time Warner, etc.) )) Fiber-Optic (e.g., AT&T U-verse, etc.) )) Satellite Internet Service (HughesNet, etc.) )) Dial-up )) Not Sure QUESTION 3 What is the main reason you DO NOT CURRENTLY HAVE internet access in your home? )) Don’t see the need for it )) Not available in my area )) Internet too slow )) My device does not connect )) Too expensive )) I use the internet somewhere else )) Concerns about online privacy Other (please specify) ____________________
  • 33.
    33 DIGITAL DEVICE DEFINITION Adigital device is an electronic tool that can receive, store, process, or send digital information. The picture below provides examples of digital devices. DEFINICIÓN DE DISPOSITIVO DIGITAL Un dispositivo digital es un dispositivo electrónico que puede recibir, almacenar, procesar o enviar información digital. La siguiente imagen muestra ejemplos de dispositivos digitales. QUESTION 4 How many of the following digital devices do you use in your home? 0 1 2 3 4+ Smart phone ) ) ) ) ) Desktop ) ) ) ) ) Laptop ) ) ) ) ) Tablet/e-reader (e.g., Kindle, Ipad, etc.) ) ) ) ) ) Smart TV (e.g., Android TV, Samsung Smart Hub, etc.) ) ) ) ) ) Streaming Device (e.g., Chromecast, Apple TV, etc.) ) ) ) ) ) Gaming System (e.g., XBOX, Playstation, Wii, etc.) ) ) ) ) ) Other ) ) ) ) ) If you DID NOT answer “0” for all of the items in question 4, please proceed to question 6. PREGUNTA 4 ¿Cuántos de los siguientes dispositivos digitales usa en su hogar? 0 1 2 3 4+ Teléfono inteligente ) ) ) ) ) Computadora de escritorio ) ) ) ) ) Laptop ) ) ) ) ) Tableta/lector digital (e.g., Kindle, Ipad, etc.) ) ) ) ) ) Televisión inteligente/Smart TV (e.g., Android TV, Samsung Smart Hub, etc.) ) ) ) ) ) Dispositivo de streaming (e.g., Chromecast, Apple TV, etc.) ) ) ) ) ) Videojuegos y Consolas (e.g., XBOX, Playstation, Wii, etc.) ) ) ) ) ) Otros ) ) ) ) ) Si NO respondió “0” para todos los elementos en pregunta 4, pase a pregunta 6.
  • 34.
    34 QUESTION 5 What isthe main reason you DO NOT CURRENTLY HAVE a digital device in your home? )) Don’t see the need for it )) My current device(s) don’t work )) Too expensive )) I use computer/devices somewhere else )) Too difficult to use )) Concerns about online privacy )) Other (Please Specify) ____________________ QUESTION 6 Thinking about your own use of digital devices, HOW COMFORTABLE ARE YOU with using them to do the following tasks: VERY UNCOMFORTABLE SOMEWHAT UNCOMFORTABLE NOTSURE SOMEWHAT COMFORTABLE VERY COMFORTABLE Help my children with homework ) ) ) ) ) To pay bills ) ) ) ) ) Online banking ) ) ) ) ) For work ) ) ) ) ) To shop online ) ) ) ) ) To access personal information (e.g., medical records, taxes, etc.) ) ) ) ) ) Job search ) ) ) ) ) Entertainment (e.g., watching movies, videos, listening to music, etc.) ) ) ) ) ) QUESTION 7 Overall, HOW COMFORTABLE ARE YOUR CHILDREN with using a digital device for homework? VERY UNCOMFORTABLE SOMEWHAT UNCOMFORTABLE NOTSURE SOMEWHAT COMFORTABLE VERY COMFORTABLE ) ) ) ) ) PREGUNTA 5 ¿Cuál es la razón principal por la que Ud. ACTUALMENTE NO TIENE un dispositivo digital en su hogar? )) No le interesa )) Mis dispositivos actuales no funcionan )) Las computadoras y otros dispositivos digitales son muy caros )) Yo uso dispositivos digitales en otros lugares )) Son muy difíciles de usar )) Tengo preocupaciones sobre de la privacidad en línea )) Otro (Por favor especificar) ____________________ PREGUNTA 6 Pensando en su propio uso de dispositivos digitales, ¿QUÉ TAN FACIL CREE UD. que es usar un dispositivo digital al: TANDIFICIL ALGO DIFICIL NOESTOY SEGURO ALGOFÁCIL TANFÁCIL Ayudar a sus hijos con la tarea ) ) ) ) ) Pagar cuentas ) ) ) ) ) Banca en línea ) ) ) ) ) Para trabajo ) ) ) ) ) Comprar de productos en línea ) ) ) ) ) Accesar a información personal (por ejemplo, registros médicos, impuestos, etc.) ) ) ) ) ) Buscando trabajo ) ) ) ) ) Actividades sociales (por ejemplo, ver películas o videos, escuchar música, etc.) ) ) ) ) ) PREGUNTA 7 En general, ¿QUÉ TAN FACIL SON PARA SUS HIJOS el uso de un dispositivo digital para la tarea? TANDIFICIL ALGO DIFICIL NOESTOY SEGURO ALGOFÁCIL TANFÁCIL ) ) ) ) )
  • 35.
    35 QUESTION 8 How oftendo YOUR CHILDREN use their digital device for homework? DAILY 2-3 TIMES PER WEEK ONCE A WEEK 1-2 TIMES PER MONTH DOES NOT ACCESS NOT SURE ) ) ) ) ) ) QUESTION 9 How often do YOUR CHILDREN use the following places in your community to access free internet for completing homework? DAILY 2-3TIMESPERWEEK ONCEAWEEK 1-2TIMESPERMONTH DOESNOTACCESS NOTSURE Public Library (e.g., County, College/University) ) ) ) ) ) ) Restaurants (e.g., Starbucks, McDonalds, etc.) ) ) ) ) ) ) Retailers (e.g., Apple Store, Barnes & Noble, etc.) ) ) ) ) ) ) Other Public Institutions (e.g., community center, park, museum, etc.) ) ) ) ) ) ) Someone else's home (e.g., classmate, friend, family member, etc.) ) ) ) ) ) ) Other: _________________ (please specify) ) ) ) ) ) ) PREGUNTA 8 ¿Con qué frecuencia SUS HIJOS usan un dispositivo digital para la tarea? DAILY 2-3 TIMES PER WEEK ONCE A WEEK 1-2 TIMES PER MONTH DOES NOT ACCESS NOT SURE ) ) ) ) ) ) PREGUNTA 9 ¿Con qué frecuencia usan SUS HIJOS los siguientes lugares en su comunidad para acceder a Internet gratis para completar la tarea? DIARIAMENTE 2-3VECESPORSEMANA UNAVEZPORSEMANA 1-2VECESPORMES NOTIENEACCESO NOESTOYSEGURO Biblioteca Pública (por ejemplo, Condado, Colegio/ Universidad) ) ) ) ) ) ) Restaurantes (e.g., Starbucks, McDonalds, etc.) ) ) ) ) ) ) Minoristas (e.g., Apple Store, Barnes & Noble, etc.) ) ) ) ) ) ) Otrasinstitucionespúblicas(por ejemplo, centro comunitario, parque, museo, etc.) ) ) ) ) ) ) El hogar de otra persona (por ejemplo, compañero, amigo, familiar, etc.) ) ) ) ) ) ) Otro: __________________ (por favor especificar) ) ) ) ) ) )
  • 36.
    36 QUESTION 10 Some schoolsprovide specific programs to support digital learning for students. These programs include digital device rentals from the school for students to use at home; or extended computer lab hours that allow students to use the computer lab before and after the school’s regular hours. Do YOUR CHILDREN take advantage of any of the following resources? YES NO NOTSURE NOTAVAILABLE ATSCHOOL School-Provided Rental Digital Device (e.g., laptop, tablet, hotspot, etc.) ) ) ) ) Extended-Day Computer Lab Internet Access (e.g., before or after school programs) ) ) ) ) Other: _________________ (please specify) ) ) ) ) QUESTION 11 Please identify the number of children in K-12 that reside in your home: 0 1 2 3 4+ Elementary School (K-5th grade) or (K-6th grade) ) ) ) ) ) Middle School/ Jr High (6-8th grade) or (7-9th grade) ) ) ) ) ) High School (9-12th grade) or (10-12th grade) ) ) ) ) ) QUESTION 12 What type of school(s) are your children currently enrolled in? Check all that apply. )) Public School (Including Traditional, Charter, Early College, Magnet. etc.) )) Private School )) Other (Please Specify) ____________________ PREGUNTA 10 Algunas escuelas ofrecen programas específicos para apoyar el aprendizaje digital para los estudiantes. Estos programas incluyen dispositivos digitales de la escuela para que los estudiantes los usen su hogar; O horas extendidas del laboratorio de computadora que permiten a estudiantes utilizar el laboratorio de computadora antes y después de las horas regulares de la escuela. ¿Aprovechan SUS HIJOS de cualquiera de los siguientes recursos? SÍ NO NOESTOY SEGURO INDISPONIBLE ENLAESCUELA Dispositivo digital de alquiler proporcionado por la escuela (e.g., laptop, tableta, punto de acceso, etc.) ) ) ) ) Laboratorio computación de día extendido Acceso a Internet (por ejemplo, antes o después de los programas escolares) ) ) ) ) Otro: __________________ (por favor especificar) ) ) ) ) PREGUNTA 11 Por favor, identifique el número de hijos en K-12 que residen en su hogar: 0 1 2 3 4+ Escuela Primaria (grado K-5) o (grado K-6) ) ) ) ) ) Escuela Intermedia/ Jr High (grado 6-8) o (grado 7-9) ) ) ) ) ) Escuela Secundaria (grado 9-12) o (grado 10-12) ) ) ) ) ) PREGUNTA 11 ¿En qué tipo de escuela están sus hijos actualmente matriculados? Marque todas las que apliquen. )) Escuela Pública (Incluyendo tradicional, Carta, Colegio Temprano, Magnet. Etc.) )) Escuela privada )) Otros (Por favor especificar) ____________________
  • 37.
    37 QUESTION 13 Please selectyour county and write your zip code below. Zip: __ __ __ __ __ QUESTION 14 What is your sex? )) Female )) Male )) Other QUESTION 15 What is your race/ethnicity? select all that apply )) Asian/Pacific Islander )) Black/African American )) Hispanic/Latino )) Native American/American Indian )) White )) Other PREGUNTA 12 Por favor seleccione su condado y escriba su código postal abajo. Código Postal: __ __ __ __ __ PREGUNTA 14 ¿Cuál es su sexo? )) Femenino )) Masculino )) Otros PREGUNTA 15 Por favor especifique su origen étnico(raza): seleccione todas las que apliquen )) Asia/Islas del Pacífico )) Negro/Afroamericano )) Hispano/Latino )) Nativo Americano/Indio Americano )) Blanco )) Otros Alamance Chowan Guilford Mitchell Rutherford Alexander Clay Halifax Montgomery Sampson Alleghany Cleveland Harnett Moore Scotland Anson Columbus Haywood Nash Stanly Ashe Craven Henderson New Hanover Stokes Avery Cumberland Hertford Northampton Surry Beaufort Currituck Hoke Onslow Swain Bertie Dare Hyde Orange Transylvania Bladen Davidson Iredell Pamlico Tyrrell Brunswick Davie Jackson Pasquotank Union Buncombe Duplin Johnston Pender Vance Burke Durham Jones Perquimans Wake Cabarrus Edgecombe Lee Person Warren Caldwell Forsyth Lenoir Pitt Washington Camden Franklin Lincoln Polk Watauga Carteret Gaston Macon Randolph Wayne Caswell Gates Madison Richmond Wilkes Catawba Graham Martin Robeson Wilson Chatham Granville McDowell Rockingham Yadkin Cherokee Greene Mecklenburg Rowan Yancey
  • 38.
    38 QUESTION 16 What isyour household income? )) Less than $10,000 )) $10,000 to $14,999 )) $15,000 to $24,999 )) $25,000 to $34,999 )) $35,000 to $49,999 )) $50,000 to $74,999 )) $75,000 to $99,999 )) $100,000 to $149,999 )) $150,000 to $199,999 )) $200,000 or more QUESTION 17 What is your highest degree or level of school completed? )) Less than high school )) High school diploma (or GED) )) Some college )) Associate’s degree (e.g., AA, AS) )) Bachelor’s degree (e.g., BA, BS) )) Master’s degree (e.g., MA, MS, MBA, MEd) )) Professional degree beyond a bachelor’s degree (e.g., MD, DDS, LLB, JD) )) Doctorate degree (e.g., PhD, EdD) PREGUNTA 16 Por favor, seleccione su rango de ingresos: )) Menos de $10,000 )) $10,000 to $14,999 )) $15,000 to $24,999 )) $25,000 to $34,999 )) $35,000 to $49,999 )) $50,000 to $74,999 )) $75,000 to $99,999 )) $100,000 to $149,999 )) $150,000 to $199,999 )) $200,000 o más PREGUNTA 17 ¿Cuál es su grado más alto o nivel de escuela completado? )) Menos que escuela secundaria )) Diploma de escuela secundaria (o GED) )) Alguna colegio )) Grado de asociado (e.g., AA, AS) )) Licenciatura (e.g., BA, BS) )) Máster (e.g., MA, MS, MBA, MEd) )) Título profesional más allá de una licenciatura (e.g., MD, DDS, LLB, JD) )) Doctorado (e.g., PhD, EdD)
  • 39.
    39 APPENDIX D Research Questionsand Analysis NOTE: research questions are numbered and in bold, analysis is labeled “Analysis” RESEARCH QUESTION 1 Are the respondents representative of the NC K-12 school population as a whole (i.e., can we assume any lessons learned from the data apply to the state as a whole?) No. For Demographic analysis see tables 65-67. RESEARCH QUESTION 2 Was there statistically significant: a. Difference in completed survey on paper vs. online and checked “No” to Question 1? ANALYSIS Dichotomized Question 1 into two groups, those with and those without internet access at home. Built a frequency table illustrating the extent to which people who completed the survey online differed from those who completed the survey on paper, with regard to their internet access at home. TABLE 1 Online v. Paper Survey Internet Access INTERNET ACCESS NO INTERNET ACCESS Online 89.3% 10.6% Paper 89.1% 10.9% χ2 (1, N = 9064) = .032, p = .86. With Yates’ continuity correction χ2 (1, N = 9064) = .058, p = .81. Uncorrected People who completed the survey online as opposed to on paper did not differ in the extent to which they reported having internet access or not in their homes. b. Relationship between how people answered Question 1 and how they answered Question 4? i. Internet access – number of each device (e.g, smart phone, desktop, laptop etc.) used in home. Question 4 scale: 0,1,2,3,4+ ANALYSIS TABLE 2 Relationship Between Access at Home and Ownership of Smart Phone Devices; N=8,653 0 1 2 3 4+ Paid Access 1.8 % 10.4 % 34.7 % 27 % 26.2 % Free Access 4.7 % 23 % 26.7 % 19.3 % 26.4 % No Access 9 % 29.2 % 33.6 % 15.4 % 12.8 % Kruskal-Wallis H test demonstrated that there was a statistically significant difference in the number of smart phones individuals reported owning based on their internet access at home χ2 (2, N=8653) = 326.91, p<.001. A Dunn’s post hoc analysis with a Bonferroni correction demonstrated that these differences were statistically significant at each pairwise comparison (p<.001). TABLE 3 Relationship Between Access at Home and Ownership of Desktop Devices; N=7,501 0 1 2 3 4+ Paid Access 47.5 % 42.1 % 7.2 % 1.9 % 1.3 % Free Access 56 % 33.7 % 4.8 % 4 % 1.6 % No Access 78.9 % 19.1 % 0.7 % 0.7 % 0.7 % Kruskal-Wallis H test demonstrated that there was a statistically significant difference in the number of desktops individuals reported owning based on their internet access at home χ2 (2, N = 7501) = 256.95, p<.001. A Dunn’s post hoc analysis with a Bonferroni correction demonstrated that these differences were statistically significant in the free access-no access and paid access and no access comparisons (p<.001), and they were statistically significant in the free access-paid access comparison (p<.05).
  • 40.
    40 TABLE 4 Relationship betweenAccess at Home and Ownership of Laptop Devices; N=8,289 0 1 2 3 4+ Paid Access 9.3 % 38.7 % 29.2 % 14.3 % 8.4 % Free Access 19.8 % 41.8 % 20.5 % 9.9 % 8.1 % No Access 51.4 % 35.4 % 8.7 % 3.2 % 1.3 % Kruskal-Wallis H test demonstrated that there was a statistically significant difference in the number of laptops individuals reported owning based on their internet access at home χ2 (2, N = 8289) = 727.59, p<.001. A Dunn’s post hoc analysis with a Bonferroni correction demonstrated that these differences were statistically significant at each pairwise comparison (p<.001). TABLE 5 Relationship Between Access at Home and Ownership of Tablet Devices; N=8,257 0 1 2 3 4+ Paid Access 9.5 % 30.2 % 28.9 % 16.7 % 14.6 % Free Access 28.3 % 33.5 % 19.9 % 7.7 % 10.7 % No Access 42.9 % 30.6 % 16.1 % 6.6 % 3.8 % Kruskal-Wallis H test demonstrated that there was a statistically significant difference in the number of tablets individuals reported owning based on their internet access at home χ2 (2, N = 8257) = 527.38, p<.001. A Dunn’s post hoc analysis with a Bonferroni correction demonstrated that these differences were statistically significant at each pairwise comparison (p<.001). TABLE 6 Relationship Between Access at Home and Ownership of Smart TV Devices; N=7,675 0 1 2 3 4+ Paid Access 37.2 % 34.2 % 16.7 % 6.6 % 5.3 % Free Access 44.8 % 27.6 % 10.3 % 9.2 % 8 % No Access 66.9 % 20.2 % 6.8 % 3.5 % 2.6 % Kruskal-Wallis H test demonstrated that there was a statistically significant difference in the number of smart TVs individuals reported owning based on their internet access at home χ2 (2, N= 7675) = 218.20, p<.001. A Dunn’s post hoc analysis with a Bonferroni correction demonstrated that these differences were statistically significant in the free access-no access comparison and the paid access-no access comparison (p<.001). However, there was not a significant difference in the number of smart TVs owned by individuals with paid internet access as opposed to individuals with free internet access (p=.28). TABLE 7 Relationship Between Access at Home and Ownership of Streaming Device; N=7,218 0 1 2 3 4+ Paid Access 48.1 % 30.5 % 13.1 % 4.5 % 3.7 % Free Access 65.4 % 17.9 % 11 % 2 % 3.7 % No Access 91.5 % 6.1 % 1.3 % 0.6 % 0.6 % Kruskal-Wallis H test demonstrated that there was a statistically significant difference in the number of streaming devices individuals reported owning based on their internet access at home χ2 (2, N = 7218) = 461.94, p<.001. A Dunn’s post hoc analysis with a Bonferroni correction demonstrated that these differences were statistically significant at each pairwise comparison (p<.001). TABLE 8 Relationship Between Access at Home and Ownership of Gaming Systems; N=7,974 0 1 2 3 4+ Paid Access 22.5 % 44.4 % 20.7 % 7.4 % 4.9 % Free Access 23.8 % 37.2 % 19.3 % 10 % 9.7 % No Access 43.8 % 38.8 % 9.6 % 3.4 % 4.4 % Kruskal-Wallis H test demonstrated that there was a statistically significant difference in the number of gaming systems individuals reported owning based on their internet access at home χ2 (2, N = 7974) = 165.77, p<.001. A Dunn’s post hoc analysis with a Bonferroni correction demonstrated that these differences were statistically significant in the free access-no access comparison and the paid access-no access comparison (p<.001). However, there was not a significant difference in the number of smart TVs owned by individuals with paid internet access as opposed to individuals with free internet access (p=.17). TABLE 9 Relationship Between Access At Home and Ownership of ‘Other’ Types of Devices; N=2,182 0 1 2 3 4+ Paid Access 89.3 % 5.7 % 2.8 % 1 % 1.1 % Free Access 83.1 % 9 % 2.2 % 1.1 % 4.5 % No Access 94 % 2.8 % 1.9 % 0 % 1.3 % Kruskal-Wallis H test demonstrated that there was a statistically significant difference in the number of other devices individuals reported owning based on their internet access at home χ2 (2, N= 2182) = 10.82, p<.01. A Dunn’s post hoc analysis with a Bonferroni correction demonstrated that these differences were statistically significant in the free access-no access comparison (p<.01) and the paid access- no access comparison (p<.001). However, there was not a significant difference in the number of smart TVs owned by individuals with paid internet access as opposed to individuals with free internet access (p=.09).
  • 41.
    41 c. Relationship betweenhow people answered Question 1 and how they answered Question 5? i. Internet access – Main reason for NOT having a digital device in home TABLE 10 Relationship Between Access at Home and Reason for Not Owning a Digital Device; N=36 PAIDACCESS FREEACCESS NOACCESS Don’t see the need for it 33.3% 0.0% 66.7% My current device(s) don’t work 100.0% 0.0% 0.0% Too expensive 8.0% 8.0% 84.0% I use computer/devices somewhere else 0.0% 0.0% 100.0% Too difficult to use 0.0% 0.0% 0.0% Concerns about online privacy 0.0% 0.0% 100.0% Other 0.0% 0.0% 100.0% Note: Sample sizes were not large enough to conduct statistical tests. d. Relationship between how people answered Question 1 and how they answered Question 6? i. Internet access – comfort using digital devices for various tasks ANALYSIS TABLE 11 Relationship Between At Home Access and Comfortability with Using Digital Devices to Help Children with Schoolwork; N=7,995 VERY UNCOMFORTABLE SOMEWHAT UNCOMFORTABLE SOMEWHAT COMFORTABLE VERY COMFORTABLE Paid Access 9 % 6.1 % 22.3 % 62.6 % Free Access 13.9 % 7.4 % 29.2 % 49.5 % No Access 16.5 % 11.3 % 28.1 % 44.1 % Kruskal-Wallis H test demonstrated that there was a statistically significant difference in the level of comfort individuals felt with regard to using their devices to help their children with schoolwork based on their internet access at home χ2 (2, N = 7995) = 124.13, p<.001. A Dunn’s post hoc analysis with a Bonferroni correction demonstrated that these differences were statistically significant in the free access-paid access comparison and the no access- paid access comparison (p<.001). However, there was not a significant difference between individuals with no internet access at home and individuals with free internet access at home with regard to the level of comfort they had using their devices to help their children with schoolwork (p=.11). NOTE ABOUT ANALYSIS For each of these tables and analyses within research questions D and E, the researcher re-scaled the measure to only include response options 1,2, 4, and 5. 4 and 5 are represented by 3 and 4 in the tables displayed here. In other words, the tables are scaled as follows, 1=”very uncomfortable”, 2=”somewhat uncomfortable”, 3=”somewhat comfortable”, 4=”very comfortable”.
  • 42.
    42 TABLE 12 Relationship BetweenAt Home Access and Comfortability with Using Digital Devices to Pay Bills; N=8,012 VERY UNCOMFORTABLE SOMEWHAT UNCOMFORTABLE SOMEWHAT COMFORTABLE VERY COMFORTABLE Paid Access 11 % 4.9 % 18.1 % 65.9 % Free Access 24.9 % 8.1 % 25.9 % 41.1 % No Access 25.4 % 12 % 29.3 % 33.3 % Kruskal-Wallis H test demonstrated that there was a statistically significant difference in the level of comfort individuals felt with regard to using their devices to pay their bills based on their internet access at home χ2 (2, N = 8012) = 369.75, p<.001. A Dunn’s post hoc analysis with a Bonferroni correction demonstrated that these differences were statistically significant in the free access-paid access comparison and the no access-paid access comparison (p<.001). However, there was not a significant difference between individuals with no internet access at home and individuals with free internet access at home with regard to the level of comfort they had using their devices to help their children with schoolwork (p=.10). TABLE 13 Relationship Between At Home Access and Comfortability with Using Digital Devices to Conduct Online Banking; N=7,887 VERY UNCOMFORTABLE SOMEWHAT UNCOMFORTABLE SOMEWHAT COMFORTABLE VERY COMFORTABLE Paid Access 12.1 % 4.8 % 17.9 % 65.2 % Free Access 27.7 % 10.7 % 21.5 % 40.1 % No Access 30.7 % 12.1 % 25.5 % 31.7 % Kruskal-Wallis H test demonstrated that there was a statistically significant difference in the level of comfort individuals felt with regard to using their devices for online banking based on their internet access at home χ2 (2, N = 7887) = 399.40, p<.001. A Dunn’s post hoc analysis with a Bonferroni correction demonstrated that these differences were statistically significant in the free access-paid access comparison and the no access-paid access comparison (p<.001). However, there was not a significant difference between individuals with no internet access at home and individuals with free internet access at home with regard to the level of comfort they had using their devices for online banking (p=.07). TABLE 14 Relationship Between At Home Access and Comfortability with Using Digital Devices for Work; N=7,761 VERY UNCOMFORTABLE SOMEWHAT UNCOMFORTABLE SOMEWHAT COMFORTABLE VERY COMFORTABLE Paid Access 9 % 2.5 % 13.7 % 74.7 % Free Access 14.7 % 5.6 % 23.4 % 56.3 % No Access 17.7 % 8.3 % 27.4 % 46.7 % Kruskal-Wallis H test demonstrated that there was a statistically significant difference in the level of comfort individuals felt with regard to using their devices for work based on their internet access at home χ2 (2, N=7761) = 263.65, p<.001. A Dunn’s post hoc analysis with a Bonferroni correction demonstrated that these differences were statistically significant in the free access-paid access comparison and the no access-paid access comparison (p<.001), and they were significant in the free access-no access comparison (p<.05). TABLE 15 Relationship Between At Home Access and Comfortability with Using Digital Devices to Shop; N=8,065 VERY UNCOMFORTABLE SOMEWHAT UNCOMFORTABLE SOMEWHAT COMFORTABLE VERY COMFORTABLE Paid Access 9 % 4.5 % 19.3 % 67.2 % Free Access 15.2 % 10.3 % 29.9 % 44.6 % No Access 24.5 % 13.3 % 31.6 % 30.6 % Kruskal-Wallis H test demonstrated that there was a statistically significant difference in the level of comfort individuals felt with regard to using their devices for online shopping based on their internet access at home χ2 (2, N = 8065) = 461.05, p<.001. A Dunn’s post hoc analysis with a Bonferroni correction demonstrated that these differences were statistically significant at each pairwise comparison (p<.001).
  • 43.
    43 TABLE 16 Relationship BetweenAt Home Access and Comfortability with Using Digital Devices to Access Personal Information; N=7,712 VERY UNCOMFORTABLE SOMEWHAT UNCOMFORTABLE SOMEWHAT COMFORTABLE VERY COMFORTABLE Paid Access 11.2 % 8.4 % 26.2 % 54.2 % Free Access 19.1 % 15.7 % 28.7 % 36.5 % No Access 32.3 % 18.6 % 23.9 % 25.2 % Kruskal-Wallis H test demonstrated that there was a statistically significant difference in the level of comfort individuals felt with regard to using their devices to access personal information (e.g., medical records, taxes, etc.) based on their internet access at home χ2 (2, N = 7712) = 353.38, p<.001. A Dunn’s post hoc analysis with a Bonferroni correction demonstrated that these differences were statistically significant at each pairwise comparison (p<.001). TABLE 17 Relationship Between At Home Access and Comfortability with Using Digital Devices for Job Searching; N=7,549 VERY UNCOMFORTABLE SOMEWHAT UNCOMFORTABLE SOMEWHAT COMFORTABLE VERY COMFORTABLE Paid Access 8.6 % 3.4 % 20.9 % 67.1 % Free Access 11.1 % 9.1 % 24.2 % 55.6 % No Access 14.7 % 8.8 % 32.5 % 44 % Kruskal-Wallis H test demonstrated that there was a statistically significant difference in the level of comfort individuals felt with regard to using their devices for job searching based on their internet access at home χ2 (2, N = 7549) = 162.45, p<.001. A Dunn’s post hoc analysis with a Bonferroni correction demonstrated that these differences were statistically significant in the free access-paid access comparison and the no access-paid access comparison (p<.001), and they were significant in the free access-no access comparison (p<.01). TABLE 18 Relationship Between At Home Access and Comfortability with Using Digital Devices for Entertainment; N=8,014 VERY UNCOMFORTABLE SOMEWHAT UNCOMFORTABLE SOMEWHAT COMFORTABLE VERY COMFORTABLE Paid Access 8.1 % 3.3 % 18.4 % 70.3 % Free Access 10.2 % 5.1 % 17.4 % 67.2 % No Access 13.9 % 11 % 28.8 % 46.3 % Kruskal-Wallis H test demonstrated that there was a statistically significant difference in the level of comfort individuals felt with regard to using their devices for entertainment (e.g., watching movies, videos, listening to music, etc.) based on their internet access at home χ2 (2, N = 8014) = 181.83, p<.001. A Dunn’s post hoc analysis with a Bonferroni correction demonstrated that these differences were statistically significant in the free access-no access comparison and the no access-paid access comparison (p<.001). However, there was not a significant difference between individuals with free internet access at home and individuals with paid internet access at home with regard to the level of comfort they had using their devices for entertainment (p=.34). e. Relationship between how people answered Question 1 and how they answered Question 7? TABLE 19 Relationship Between at Home Access and Respondents’ Children’s Comfort Using Digital Device for Homework; N=7,798 VERY UNCOMFORTABLE SOMEWHAT UNCOMFORTABLE SOMEWHAT COMFORTABLE VERY COMFORTABLE Paid Access 7.2 % 5.8 % 27.4 % 59.6 % Free Access 10 % 9.1 % 27.4 % 53.5 % No Access 12.1 % 8.7 % 30.8 % 48.4 % Kruskal-Wallis H test demonstrated that there was a statistically significant difference in the level of comfort individuals reported that their children felt with using a digital device for homework based on their internet access at home χ2 (2, N = 7798) = 46.36, p<.001. A Dunn’s post hoc analysis with a Bonferroni correction demonstrated that
  • 44.
    44 these differences werestatistically significant in the free access-paid access comparison (p<.05) and the no access- paid access comparison (p<.001). However, there was not a significant difference between individuals with free internet access at home and individuals with no internet access at home with regard to the level of comfort they reported that their children felt with using a digital device for homework (p=.27). f. Relationship between how people answered Question 1 and how they answered Question 8? i. Internet access – frequency of using places in community to access free internet for completing homework TABLE 20 Relationship Between At Home Access and Frequency of Use of Digital Device for Completing Homework; N=8,400 DAILY 2-3TIMESPERWEEK ONCEAWEEK 1-2TIMESPERMONTH DOESNOTACCESS NOTSURE Paid Access 37.8% 24.7% 10.2% 10.7% 11.2% 5.3% Free Access 34.5% 21.5% 12.3% 6.9% 13.8% 11.1% No Access 20.9% 18.9% 8.5% 7.6% 34.4% 9.8% Kruskal-Wallis H test demonstrated that there was a statistically significant difference in the frequency in which individuals reported that their children used a digital device for homework based on their internet access at home, χ2 (2, N = 7898) = 210.07, p<.001. A Dunn’s post hoc analysis with a Bonferroni correction demonstrated that these differences were statistically significant in the free access-no access comparison (p<.001) and the no access-paid access comparison (p<.001). However, there was not a significant difference between individuals with free internet access at home and individuals with paid internet access at home with regard to the frequency in which individuals reported that their children used a digital device for homework (p=.67). g. Relationship between how people answered Question 1 and how they answered Question 9? ANALYSIS TABLE 21 Relationship Between At Home Access and Frequency of Use of Libraries to Access the Internet for Completing Homework; N=8,135 DAILY 2-3TIMESPERWEEK ONCEAWEEK 1-2TIMESPERMONTH DOESNOTACCESS NOTSURE Paid Access 2.1% 2.4% 2.3% 8.2% 79% 5.9% Free Access 5.3% 3.7% 9.4 % 15.5% 52.2% 13.9% No Access 7.1% 12.6% 9 % 15.5% 47.1% 8.7% Kruskal-Wallis H test demonstrated that there was a statistically significant difference in the frequency in which individuals reported that their children used a public library (e.g., county, college/university) in their community to access free internet for completing their homework based on their internet access at home, χ2 (2, N = 7612) = 525.70, p<.001. A Dunn’s post hoc analysis with a Bonferroni correction demonstrated that these differences were statistically significant at each pairwise comparison (p<.001). Note: Recognize that there is a different N for the statistical test than there is for the table above NOTE ABOUT ANALYSIS The following tables all include values for the “Not Sure” response option. However, for statistical testing, the researcher excluded this response option from the analyses in order to withhold the ordinal nature of the scale.
  • 45.
    45 TABLE 22 Relationship BetweenAt Home Access and Frequency of Use of Restaurants to Access the Internet for Completing Homework; N=8,085 DAILY 2-3TIMESPERWEEK ONCEAWEEK 1-2TIMESPERMONTH DOESNOTACCESS NOTSURE Paid Access 1.1% 3.4% 5.7% 12.4% 71.6% 5.8% Free Access 3.8% 7.1% 7.9% 14.6% 51.7% 15% No Access 3.7% 13.8% 9% 14.3% 49.8% 9.4% Kruskal-Wallis H test demonstrated that there was a statistically significant difference in the frequency in which individuals reported that their children used a restaurant (e.g., Starbucks, McDonalds, etc.) in their community to access free internet for completing their homework based on their internet access at home, χ2 (2, N = 7564) = 525.70, p<.001. A Dunn’s post hoc analysis with a Bonferroni correction demonstrated that these differences were statistically significant in the free access-paid access comparison and the no access-paid access comparison (p<.001). However, there was not a significant difference between individuals with free internet access at home and individuals with no internet access at home with regard to the frequency in which individuals reported that their children used a restaurant to access free internet for completing their homework (p=.06). TABLE 23 Relationship Between at Home Access and Frequency of Use of Retailers to Access the Internet for Completing Homework; N=8,029 DAILY 2-3TIMESPERWEEK ONCEAWEEK 1-2TIMESPERMONTH DOESNOTACCESS NOTSURE Paid Access 0.5% 1.5% 2.4% 6.6% 82.1% 7% Free Access 4.2% 3.4% 3% 9.3% 63.6% 16.5% No Access 1.4% 3% 2.2% 7.9% 72.8% 12.7% Kruskal-Wallis H test demonstrated that there was a statistically significant difference in the frequency in which individuals reported that their children used a retailer (e.g., Apple Store, Barnes & noble, etc.) in their community to access free internet for completing their homework based on their internet access at home χ2 (2, N = 7401) = 40.65, p<.001. A Dunn’s post hoc analysis with a Bonferroni correction demonstrated that these differences were statistically significant in the free access-paid access comparison and the no access-paid access comparison (p<.001), and they were significant in the free access-no access comparison (p<.01). TABLE 24 Relationship Between at Home Access and Frequency of Use of Other Public Institutions to Access Internet for Completing Homework; N=8,035 DAILY 2-3TIMESPERWEEK ONCEAWEEK 1-2TIMESPERMONTH DOESNOTACCESS NOTSURE Paid Access 1.1% 1.8% 2.4% 7.1% 80.1% 7.5% Free Access 4.6% 4.6% 3.4% 11.4% 58.2% 17.7% No Access 3.8% 6.4% 6.1% 8.7% 62.9% 12.1% Kruskal-Wallis H test demonstrated that there was a statistically significant difference in the frequency in which individuals reported that their children used other public institutions (e.g., community center, park, museum, etc.) in their community to access free internet for completing their homework based on their internet access at home χ2 (2, N = 7369) = 157.04, p<.001. A Dunn’s post hoc analysis with a Bonferroni correction demonstrated that these differences were statistically significant in the free access-paid access comparison and the no access-paid access comparison (p<.001). However, there was not a significant difference between individuals with free internet access at home and individuals with no internet access at home with regard to the frequency in which individuals reported that their children used other public institutions to access free internet for completing their homework (p>.99).
  • 46.
    46 TABLE 25 Relationship Betweenat Home Access and Frequency of Use of Someone Else’s Home to Access Internet for Completing Homework; N=8,106 DAILY 2-3TIMESPERWEEK ONCEAWEEK 1-2TIMESPERMONTH DOESNOTACCESS NOTSURE Paid Access 2.1% 6.5% 8.6% 20.1% 55.6% 7.1% Free Access 10.5% 8.4% 12.1% 18% 36.4% 14.6% No Access 11.7% 17.8% 11.8% 19.2% 30.7% 8.8% Kruskal-Wallis H test demonstrated that there was a statistically significant difference in the frequency in which individuals reported that their children used someone else’s home (e.g., classmate, friend, family member, etc.) in their community to access free internet for completing their homework based on their internet access at home, χ2 (2, N = 7499) = 319.09, p<.001. A Dunn’s post hoc analysis with a Bonferroni correction demonstrated that these differences were statistically significant in the free access-paid access comparison and the no access-paid access comparison (p<.001), and they were significant in the free access-no access comparison (p<.01). TABLE 26 Relationship Between at Home Access and Frequency of Use of ‘Other’ Location to Access Internet for Completing Homework; N=3,787 DAILY 2-3TIMESPERWEEK ONCEAWEEK 1-2TIMESPERMONTH DOESNOTACCESS NOTSURE Paid Access 3.2% 1.6% 1% 1% 72.2% 20.9% Free Access 4.1% 2.5% 1.6% 3.3% 50.8% 37.7% No Access 5.2% 1.9% 3.3% 2.4% 55.2% 31.9% Kruskal-Wallis H test demonstrated that there was a statistically significant difference in the frequency in which individuals reported that their children used other locations in their community to access free internet for completing their homework based on their internet access at home, χ2 (2, N = 2929) = 34.63, p<.001. A Dunn’s post hoc analysis with a Bonferroni correction demonstrated that these differences were statistically significant in the free access-paid access comparison (p<.05) and the no access-paid access comparison (p<.001). However, there was not a significant difference between individuals with free internet access at home and individuals with no internet access at home with regard to the frequency in which individuals reported that their children used other locations in their community to access free internet for completing their homework (p>.99). h. Relationship between respondents’ responses to Question 1 and the TYPE of device they own? ANALYSIS Dichotomized the number of each particular device owned into owned or does not own this particular device. Created a contingency table of device ownership by internet access group (i.e., paid, free, no access). Note: Treated the ownership as ordinal to better understand how ownership differed across groups. TABLE 27 Relationship Between At Home Access and Ownership of Smart Phone; N=8,653 DOES NOT OWN OWNS Paid Access 1.8 % 98.2 % Free Access 4.7 % 95.3 % No Access 9 % 91 % Kruskal-Wallis H test demonstrated that there was a statistically significant difference in whether individuals reported owning a smart phone based on their internet access at home, χ2 (2, N = 8653) = 171.03, p<.001. A Dunn’s post hoc analysis with a Bonferroni correction demonstrated that these differences were statistically significant in the free access-no access comparison and the no access-paid access comparison (p<.001), and they were significant in the free access-paid access comparison (p<.01). TABLE 28 Relationship Between At Home Access and Ownership of Desktop Computers; N=7,501 DOES NOT OWN OWNS Paid Access 47.5 % 52.5 % Free Access 56 % 44 % No Access 78.9 % 21.1 % Kruskal7-Wallis H test demonstrated that there was a statistically significant difference in whether individuals reported owning a desktop based on their internet access at home, χ2 (2, N = 7501) = 260.43, p<.001. A Dunn’s post hoc analysis with a Bonferroni correction demonstrated that these differences were statistically significant in the free access-no access comparison and the no access-paid access comparison (p<.001), and they were significant in the free access-paid access comparison (p<.05).
  • 47.
    47 TABLE 29 Relationship BetweenAt Home Access and Ownership of Laptop Computer; N=8,289 DOES NOT OWN OWNS Paid Access 9.3 % 90.7 % Free Access 19.8 % 80.2 % No Access 51.4 % 48.6 % Kruskal-Wallis H test demonstrated that there was a statistically significant difference in whether individuals reported owning a laptop based on their internet access at home, χ2 (2, N = 8289) = 1061.28, p<.001. A Dunn’s post hoc analysis with a Bonferroni correction demonstrated that these differences were statistically significant at each pairwise comparison (p<.001). TABLE 30 Relationship Between At Home Access and Ownership of Tablet; N=8,257 DOES NOT OWN OWNS Paid Access 9.5 % 90.5 % Free Access 28.3 % 71.7 % No Access 42.9 % 57.1 % Kruskal-Wallis H test demonstrated that there was a statistically significant difference in whether individuals reported owning a tablet based on their internet access at home, χ2 (2, N = 8257) = 740.05, p<.001. A Dunn’s post hoc analysis with a Bonferroni correction demonstrated that these differences were statistically significant at each pairwise comparison (p<.001). TABLE 31 Relationship Between at Home Access and Ownership of Smart TV; N=7,675 DOES NOT OWN OWNS Paid Access 37.2 % 62.8 % Free Access 44.8 % 55.2 % No Access 66.9 % 33.1 % Kruskal-Wallis H test demonstrated that there was a statistically significant difference in whether individuals reported owning a smart tv based on their internet access at home, χ2 (2, N = 7675) = 253.05, p<.001. A Dunn’s post hoc analysis with a Bonferroni correction demonstrated that these differences were statistically significant in the free access-no access comparison and the no access-paid access comparison (p<.001), and they were significant in the free access-paid access comparison (p<.05). TABLE 32 Relationship Between at Home Access and Ownership of Streaming Device; N=7,218 DOES NOT OWN OWNS Paid Access 48.1 % 51.9 % Free Access 65.4 % 34.6 % No Access 91.5 % 8.5 % Kruskal-Wallis H test demonstrated that there was a statistically significant difference in whether individuals reported owning a streaming device based on their internet access at home, χ2 (2, N = 7218) = 503.22, p<.001. A Dunn’s post hoc analysis with a Bonferroni correction demonstrated that these differences were statistically significant at each pairwise comparison (p<.001). TABLE 32 Relationship Between at Home Access and Ownership of Gaming System; N=7,974 DOES NOT OWN OWNS Paid Access 22.5 % 77.5 % Free Access 23.8 % 76.2 % No Access 43.8 % 56.2 % Kruskal-Wallis H test demonstrated that there was a statistically significant difference in whether individuals reported owning a gaming system based on their internet access at home, χ2 (2, N = 7974) = 175.11, p<.001. A Dunn’s post hoc analysis with a Bonferroni correction demonstrated that these differences were statistically significant in the free access-no access comparison and the no access-paid access comparison (p<.001). However, there was not a significant difference between individuals with free internet access at home and individuals with paid internet access at home with regard to whether individuals reported owning a gaming system (p=.95). TABLE 32 Relationship Between at Home Access and Ownership of ‘Other’ Device; N=2,182 DOES NOT OWN OWNS Paid Access 89.3 % 10.7 % Free Access 83.1 % 16.9 % No Access 94 % 6 % Kruskal-Wallis H test demonstrated that there was a statistically significant difference in whether individuals reported owning other digital devices based on their internet access at home, χ2 (2, N = 2182) = 10.83, p<.01. A Dunn’s post hoc analysis with a Bonferroni correction demonstrated that these differences were statistically significant in the
  • 48.
    48 TABLE 34 Relationship BetweenFrequency of Use of Restaurants to Access Internet to Complete Homework and Grade Level; N=4,951 DAILY 2-3TIMESPERWEEK ONCEAWEEK 1-2TIMESPERMONTH DOESNOTACCESS NOTSURE Elementary School 0.4% 1.8% 3.2% 8.9% 83.1% 2.5% Middle School 1.2% 4% 7.3% 13.2% 69.3% 5% High School 2.6% 7.5% 7.5% 16% 56.4% 10.1% Kruskal-Wallis H test demonstrated that there was a statistically significant difference in the frequency in which individuals reported that their children used a restaurant in their community to access free internet for completing their homework based on their school level (i.e., elementary, middle, high school), χ2 (2, N = 4706) = 281.04, p<.001. A Dunn’s post hoc analysis with a Bonferroni correction demonstrated that these differences were statistically significant at each pairwise comparison (p<.001). TABLE 35 Relationship Between Frequency of Use of Retailers to Access Internet to Complete Homework and Grade Level; N=4,922 DAILY 2-3TIMESPERWEEK ONCEAWEEK 1-2TIMESPERMONTH DOESNOTACCESS NOTSURE Elementary School 0.2% 0.9% 1.4% 3.9% 90.6% 2.9% Middle School 0.3% 1.8% 2.2% 7.5% 81.7% 6.5% High School 1% 2.8% 2.5% 9.4% 72.7% 11.6% Kruskal-Wallis H test demonstrated that there was a statistically significant difference in the frequency in which individuals reported that their children used a retailer in their community to access free internet for completing their homework based on their school level (i.e., elementary, middle, high school), χ2 (2, N = 4635) = 116.63, p<.001. A Dunn’s post hoc analysis with a Bonferroni correction demonstrated that these differences were statistically significant at each pairwise comparison (p<.001). free access-no access comparison (p<.01) and the no access- paid access comparison (p<.05). However, there was not a significant difference between individuals with free internet access at home and individuals with paid internet access at home with regard to whether individuals reported owning other digital devices (p=.09). i. Relationship between Question 9 and grade level of children (i.e. elementary, middle, high) from Question 16? ANALYSIS Dichotomized number of children at each grade level to indicate whether the respondent reported having a child at a particular grade level or not, regardless of the number. Then, I removed any respondent who reported having a child at more than one school level. Therefore, each respondent in the following analyses was only responding with regard to their child at a single grade level. Said differently, the responses across school levels are independent of one another. TABLE 33 Relationship Between Frequency of Use of Library to Access Internet to Complete Homework and Grade Level; N=4,986 DAILY 2-3TIMESPERWEEK ONCEAWEEK 1-2TIMESPERMONTH DOESNOTACCESS NOTSURE Elementary School 1% 1.7% 2.6% 8.2% 83% 3.6% Middle School 2.7% 4.4% 2.7% 9.2% 75.9% 5% High School 5.4% 4.6 % 3.4% 8.8% 69.4% 8.3% Kruskal-Wallis H test demonstrated that there was a statistically significant difference in the frequency in which individuals reported that their children used a public library (e.g., county, college/university) in their community to access free internet for completing their homework based on their school level (i.e., elementary, middle, high school), χ2 (2, N = 47390) = 81.21, p<.001. A Dunn’s post hoc analysis with a Bonferroni correction demonstrated that these differences were statistically significant in the elementary school-high school comparison and the elementary school-middle school comparison (p<.001), and they were significant in the high school-middle school comparison (p<.05).
  • 49.
    49 TABLE 36 Relationship BetweenFrequency of Use of ‘Other Public Institutions’ to Access Internet to Complete Homework and Grade Level; N=4,927 DAILY 2-3TIMESPERWEEK ONCEAWEEK 1-2TIMESPERMONTH DOESNOTACCESS NOTSURE Elementary School 0.6% 1.2% 1.6% 4.9% 88.7% 3.1% Middle School 0.9% 2% 4.4% 8.1% 77.5% 7.2% High School 2.4% 2.5% 2.8% 8.9% 70.1% 13.3% Kruskal-Wallis H test demonstrated that there was a statistically significant difference in the frequency in which individuals reported that their children used other public institutions in their community to access free internet for completing their homework based on their school level (i.e., elementary, middle, high school), χ2 (2, N = 4607) = 101.29, p<.001. A Dunn’s post hoc analysis with a Bonferroni correction demonstrated that these differences were statistically significant in the elementary school-high school comparison and the elementary school-middle school comparison (p<.001). However, there was not a significant difference between high school students and middle school students with regard to the frequency in which they use other public institutions in their community to access free internet for completing their homework, as reported by their parent(s) (p=.15). TABLE 37 Relationship Between Frequency of Use of Library to Access Internet to Complete Homework and Grade Level; N=4,967 DAILY 2-3TIMESPERWEEK ONCEAWEEK 1-2TIMESPERMONTH DOESNOTACCESS NOTSURE Elementary School 1.7% 4.7% 7% 14.6% 68.6% 3.5% Middle School 3.5% 6.2% 10.6% 22.9% 50.8% 5.9% High School 4.2% 10.5% 10% 24.4% 40.7% 10.2% Kruskal-Wallis H test demonstrated that there was a statistically significant difference in the frequency in which individuals reported that their children used someone else’s home in their community to access free internet for completing their homework based on their school level (i.e., elementary, middle, high school), χ2 (2, N = 4684) = 262.28, p<.001. A Dunn’s post hoc analysis with a Bonferroni correction demonstrated that these differences were statistically significant at each pairwise comparison (p<.001). TABLE 38 Relationship Between Frequency of Use of ‘Other’ to Access Internet to Complete Homework and Grade Level; N=2,384 DAILY 2-3TIMESPERWEEK ONCEAWEEK 1-2TIMESPERMONTH DOESNOTACCESS NOTSURE Elementary School 1.2% 1.6% 1 % 1.1% 81.8% 13.3% Middle School 2.7% 1% 2.1 % 0.3% 68.8% 25% High School 6.8% 1.3% 1.1% 0.6% 58.1% 32.1% Kruskal-Wallis H test demonstrated that there was a statistically significant difference in the frequency in which individuals reported that their children used other locations in their community to access free internet for completing their homework based on their school level (i.e., elementary, middle, high school), χ2 (2, N = 1933) = 34.59, p<.001. A Dunn’s post hoc analysis with a Bonferroni correction demonstrated that these differences were statistically significant in the elementary school-high school comparison (p<.001) and the high school-middle school comparison (p<.01). However, there was not a significant difference between elementary school students and middle school students with regard to the frequency in which they use other locations in their community to access free internet for completing their homework, as reported by their parent(s) (p=.24).
  • 50.
    50 j. Relationship betweenschool type from Question 19 (i.e., public, private, other) and response to Question 1? ANALYSIS: Due to the sample sizes within cells (e.g., Free access by private school, free access by other, etc.) statistical testing could not be conducted. TABLE 39 Relationship Between at Home Access and School Type; N=7,922 PUBLIC PRIVATE OTHER Paid Access 96.9 % 0.8 % 2.4 % Free Access 97.1 % 0.8 % 2.1 % No Access 98 % 0.5 % 1.5 % k. Relationship to response for Question 3 and income level (Question 15) i. Income level – Main reason for NOT having internet access ANALYSIS: For income, rather than reporting the results from 10 different income categories, we condensed the categories down to 3, low, medium, and high-income categories. Low consists of categories ranging from less than 10k-34.99k. Medium ranges from 35k-74.99k. High ranges from 75k-200k+. Collapsed the ten income categories into three categories (1-4 = Low income, 5-7 = medium income, 8-10 = high income). This should make for more interpretable and practical results. Again, I treated the dependent variable, “yes/no” responses as ordinal. Essentially treated it as “More of a reason” vs. “less of a reason”. This allowed for better interpretation across groups, rather than just determining whether the proportion of Yes vs. No was statistically significant within each income group. Kruskal Wallis analyses were used throughout. TABLE 40 Relationship Between Income Level and ‘No Need’ as Main Reason Respondent Does Not Have Broadband Home Access; N=777 IS NOT A MAIN REASON IS A MAIN REASON Low (Less Than $10,000 - $34,999) 98.2 % 1.8 % Medium ($35,000 - $74,999) 98 % 2 % High ($75,000 - $200,000+) 100 % 0 % Participants provided whether or no several potential reasons for not having internet access in their homes was relevant to their situation. Kruskal-Wallis H test demonstrated that there was not a statistically significant difference in the extent to which participants said they did not have a need for internet access based on income level, χ2 (2, N = 777) = .67, p=.72. TABLE 41 Relationship Between Income Level and ‘Not Available’ as Main Reason Respondent Does Not Have Broadband Home Access; N=777 IS NOT A MAIN REASON IS A MAIN REASON Low (Less Than $10,000 - $34,999) 87.4 % 12.6 % Medium ($35,000 - $74,999) 59.8 % 40.2 % High ($75,000 - $200,000+) 28.1 % 71.9 % Participants provided whether or no several potential reasons for not having internet access in their homes was relevant to their situation. Kruskal-Wallis H test demonstrated that there was a statistically significant difference in the extent to which participants said that internet was not available to them in their area access based on income level, χ2 (2, N = 777) = 111.85, p<.001. A Dunn’s post hoc analysis with a Bonferroni correction demonstrated that these differences were statistically significant at each pairwise comparison of income levels (p<.001).
  • 51.
    51 TABLE 42 Relationship BetweenIncome Level and ‘Too Slow’ as Main Reason Respondent Does Not Have Broadband Home Access; N=777 IS NOT A MAIN REASON IS A MAIN REASON Low (Less Than $10,000 - $34,999) 93.8 % 6.2 % Medium ($35,000 - $74,999) 89.8 % 10.2 % High ($75,000 - $200,000+) 87.5 % 12.5 % Participants provided whether or no several potential reasons for not having internet access in their homes was relevant to their situation. Kruskal-Wallis H test demonstrated that there was not a statistically significant difference in the extent to which participants said their internet connection was too slow based on income level, χ2 (2, N = 777) = 4.86, p=.09. TABLE 43 Relationship Between Income Level and ‘Device will not Connect’ as Main Reason Respondent Does Not Have Broadband Home Access; N=777 IS NOT A MAIN REASON IS A MAIN REASON Low (Less Than $10,000 - $34,999) 98 % 2 % Medium ($35,000 - $74,999) 97.5 % 2.5 % High ($75,000 - $200,000+) 100 % 0 % Participants provided whether or no several potential reasons for not having internet access in their homes was relevant to their situation. Kruskal-Wallis H test demonstrated that there was not a statistically significant difference in the extent to which participants said their devices would not connect based on income level, χ2 (2, N = 777) = 4.86, p=.09. TABLE 44 Relationship Between Income Level and ‘Too Expensive’ as Main Reason Respondent Does Not Have Broadband Home Access; N=777 IS NOT A MAIN REASON IS A MAIN REASON Low (Less Than $10,000 - $34,999) 23.8 % 76.2 % Medium ($35,000 - $74,999) 43.4 % 56.6 % High ($75,000 - $200,000+) 81.2 % 18.8 % Participants provided whether or no several potential reasons for not having internet access in their homes was relevant to their situation. Kruskal-Wallis H test demonstrated that there was a statistically significant difference in the extent to which participants said that internet was too expensive based on income level, χ2 (2, N = 777) = 65.57, p<.001. A Dunn’s post hoc analysis with a Bonferroni correction demonstrated that these differences were statistically significant at each pairwise comparison of income levels (p<.001). TABLE 45 Relationship Between Income Level and ‘Use Internet Elsewhere’ as Main Reason Respondent Does Not Have Broadband Home Access; N=777 IS NOT A MAIN REASON IS A MAIN REASON Low (Less Than $10,000 - $34,999) 93.2 % 6.8 % Medium ($35,000 - $74,999) 92.2 % 7.8 % High ($75,000 - $200,000+) 96.9 % 3.1 % Participants provided whether or no several potential reasons for not having internet access in their homes was relevant to their situation. Kruskal-Wallis H test demonstrated that there was not a statistically significant difference in the extent to which participants said they access the internet elsewhere based on income level, χ2 (2, N = 777) = 1.01, p=.60. TABLE 46 Relationship Between Income Level and ‘Privacy Concerns’ as Main Reason Respondent Does Not Have Broadband Home Access; N=777 IS NOT A MAIN REASON IS A MAIN REASON Low (Less Than $10,000 - $34,999) 98.2 % 1.8 % Medium ($35,000 - $74,999) 97.5 % 2.5 % High ($75,000 - $200,000+) 100 % 0 % Participants provided whether or no several potential reasons for not having internet access in their homes was relevant to their situation. Kruskal-Wallis H test demonstrated that there was not a statistically significant difference in the extent to which participants said they had privacy concerns based on income level, χ2 (2, N = 777) = 1.04, p=.60.
  • 52.
    52 TABLE 47 Relationship BetweenIncome Level and ‘Other’ as Main Reason Respondent Does Not Have Broadband Home Access; N=777 IS NOT A MAIN REASON IS A MAIN REASON Low (Less Than $10,000 - $34,999) 88.8 % 11.2 % Medium ($35,000 - $74,999) 91.8 % 8.2 % High ($75,000 - $200,000+) 81.2 % 18.8 % Participants provided whether or no several potential reasons for not having internet access in their homes was relevant to their situation. Kruskal-Wallis H test demonstrated that there was not a statistically significant difference in the extent to which participants said they did not have internet access for other reasons based on income level, χ2 (2, N = 777) = 3.92, p=.14. 3. What was the most common answer to Question 3 for those who checked “No” to Question 1? ANALYSIS Includes only responses from people who checked “NO” to Question 1. TABLE 48 Relationship between Respondents Without Access and Main Reason for Not Having Internet in their Home; N=937 RESPONSE OPTION NOT FOR THIS REASON FOR THIS REASON Don’t see the need for it 96.37 % 3.63 % Not available in my area 76.73 % 23.27 % Internet too slow 91.36 % 8.64 % My device does not connect 97.65 % 2.35 % Too expensive 34.04 % 65.96 % I use the internet somewhere else 92.85 % 7.15 % Concerns about online privacy 97.23 % 2.77 % Other 89.01 % 10.99 % 4. Breakdown with descriptive stats of the responses to each question (i.e., how many people selected each option, what percentage that was of total response rate, etc.) ANALYSIS TABLE 49 Descriptive Stats to Question 1, “Do you currently have internet access at home?” RESPONSE N RAW % VALID % Yes, I pay a monthly subscription for internet 7774 81.92 85.77 Yes, I have access but do not pay for a subscription 321 3.38 3.54 No, I do not have access 969 10.21 10.69 Missings 426 4.49 TABLE 50 Descriptive Stats to Question 2, “How do you access the internet at home?”; N=8,005 NOT USING USING Cellular data plan 55.94 % 44.06 % Digital Subscriber 83.1 % 16.9 % Line (DSL) 77.75 % 22.25 % Cable modem 43.30 % 56.70 % Fiber-Optic 88.21 % 11.79 % Satellite internet service 96.59 % 3.41 % Dial-up 99.56 % 0.44 % Not sure 97.73 % 2.27 %
  • 53.
    53 TABLE 51 Descriptive Statsto Question 3, “What is the main reason you do not currently have internet access in your home?”; N=937 RESPONSE OPTION NOT FOR THIS REASON FOR THIS REASON Don’t see the need for it 96.37 % 3.63 % Not available in my area 76.73 % 23.27 % Internet too slow 91.36 % 8.64 % My device does not connect 97.65 % 2.35 % Too expensive 34.04 % 65.96 % I use the internet somewhere else 92.85 % 7.15 % Concerns about online privacy 97.23 % 2.77 % Other 89.01 % 10.99 % TABLE 52 Descriptive Stats to Question 4, “How many of the following digital devices do you use in your home?” N 0 1 2 3 4+ Smart Phone 8653 2.61% 12.78% 34.27% 25.51% 24.84 % Desktop 7501 50.86% 39.54% 6.49% 1.84% 1.27% Laptop 8289 13.60% 38.53% 27.00% 13.10% 7.77% Tablet/ e-Reader 8257 13.35% 30.39% 27.39% 15.44% 13.43% Smart TV 7675 40.46% 32.55% 15.45% 6.40% 5.15% Streaming Device 7218 53.03% 27.65% 11.89% 4.05% 3.38% Gaming System 7974 24.71% 43.59% 19.54% 7.12% 5.04% Other 2182 89.73% 5.45% 2.66% 0.87% 1.28% TABLE 53 Descriptive Stats to Question 5, “What is the main reason you do not currently have a digital device in your home?” RESPONSE N RAW % VALID % Don’t see the need for it 3 0.03 8.33 Too expensive 25 0.26 69.44 I use computer/devices somewhere else 1 0.01 2.78 Concerns about online privacy 1 0.01 2.78 My current devices don’t work 1 0.01 2.78 Other 5 0.05 13.89 Missings 9454 99.62 TABLE 54 Descriptive Stats to Question 5, “How comfortable are you with using the digital devices you own to do the following tasks?” N=8,457 VERY UNCOMFORTABLE SOMEWHAT UNCOMFORTABLE NOTSURE SOMEWHAT COMFORTABLE VERY COMFORTABLE Help my children with schoolwork 9.33% 6.26% 5.34% 21.80% 57.27% To pay bills 12.10% 5.40% 4.62% 18.49% 59.39% Online banking 13.30% 5.25% 5.89% 17.61% 57.94% For work 9.27% 2.92% 6.81% 14.16% 66.85% To shop online 10.19% 5.27% 3.79% 19.95% 60.80% To access personal information (e.g., medical records, taxes,etc. 12.30% 8.76% 8.00% 23.93% 47.01% Job search 8.36% 3.70% 9.20% 20.04% 58.70% Entertainment (e.g., watching movies,videos, listening to music, etc. 8.30% 3.85% 4.52% 18.43% 64.90% TABLE 55 Descriptive Stats to Question 7, “Overall, how comfortable are your children with using a digital device for homework?” RESPONSE N RAW % VALID % Very Uncomfortable 602 6.34 7.12 Somewhat Uncomfortable 481 5.07 5.69 Not Sure 659 6.94 7.79 Somewhat Comfortable 2160 22.76 25.54 Very Comfortable 4555 48.00 53.86 Missings 1033 10.89
  • 54.
    54 TABLE 56 Descriptive Statsto Question 8, “How often do your children use the following places in your community to access free internet for completing homework?” N DAILY 2-3TIMESPERWEEK ONCEAWEEK 1-2TIMESPERMONTH NOACCESS NOTSURE Public Library (e.g., County, College/University) 8135 2.72% 3.50% 3.18% 9.18% 74.98% 6.43% Restaurants (e.g., Starbucks, McDonalds, etc.) 8085 1.43% 4.55% 6.06% 12.63% 68.88% 6.44% Retailers (e.g., Apple Store, Barnes & Noble, etc.) 8029 0.71% 1.69% 2.35% 6.76% 80.66% 7.82% Other Public Institutions (e.g., community center, park, museum, etc.) 8035 1.43% 2.33% 2.83% 7.36% 77.77% 8.29% Someone else’s home (e.g., classmate, friend, family member, etc.) 8106 3.33% 7.67% 9.02% 19.91% 52.58% 7.49% Other 3787 3.49% 1.66% 1.27% 1.27% 69.66% 22.66% TABLE 57 Descriptive Stats to Question 8, “How often do your children use a digital device for homework?” RESPONSE N RAW % VALID % Daily 3021 31.83 38.25 2-3 week 2019 21.28 25.56 Once per week 848 8.94 10.74 1-2 month 863 9.09 10.93 No access 1147 12.09 14.52 Missings 1592 16.78 TABLE 58 Descriptive Stats to Question 10, “Do your children take advantage of any of the following resources?” YES NO NOTSURE NOTAVAILABLE ATSCHOOL School-Provided Rental Digital Device (e.g., laptop, tablet, hotspot, etc.) 8068 28.21% 38.82% 9.58% 23.39% Extended-Day Computer Lab Internet access (e.g., before or after school programs) 7992 10.55% 50.75% 16.70% 22.00% Other 2759 3.73% 49.29% 26.35% 20.62%
  • 55.
    55 TABLE 59 Descriptive Statsto Question 11, “Please identify the number of children in K-12 that reside in your home” N 0 1 2 3 4+ Elementary School (K-5th grade or 6th grade) 6929 27.88% 48.25% 19.18% 3.58% 1.11% Middle School/Jr High(6th -8th gradeor7th - 9th grade) 6099 55.24% 39.15% 4.64% 0.52% 0.44% High School (9th - 12th grade or 10th -12th grade) 6246 48.64% 40.38% 9.35% 0.88% 0.75% TABLE 60 Descriptive Stats to Question 12, “What type of school(s) are your children currently enrolled in?” RESPONSE N RAW % VALID % Public School (Including Traditional, Charter, Early College, Magnet, etc.) 7751 81.68 96.98 Private School 60 0.63 0.75 Other 181 1.91 2.26 Missings 1498 15.79 TABLE 61 Descriptive Stats to Question 14, “What is your sex?” RESPONSE N RAW % VALID % Male 1334 14.06 16.67 Female 6629 69.85 82.85 Other 38 0.40 0.47 Missings 1489 15.69 TABLE 62 Descriptive Stats to Question 15, “What is your race/ ethnicity?” RESPONSE N RAW % VALID % Asian/Pacific Islander 112 1.18 1.41 Black/African American 761 8.02 9.61 Hispanic/Latino 411 4.33 5.19 Native American/American Indian 152 1.60 1.92 White 6324 66.64 79.88 Other 157 1.65 1.98 Missings 1573 16.58 TABLE 63 Descriptive Stats to Question 16, “What is your household income?” RESPONSE N RAW % VALID % Less than $10,000 371 3.91 4.92 $10,000 to $14,999 281 2.96 3.73 $15,000 to $24,999 512 5.40 6.79 $25,000 to $34,999 618 6.51 8.20 $35,000 to $49,999 892 9.40 11.83 $50,000 to $74,999 1470 15.49 19.49 $75,000 to $99,999 1337 14.09 17.73 $100,000 to $149,999 1278 13.47 16.95 $150,000 to $199,999 441 4.65 5.85 $200,000 or more 341 3.59 4.52 Missings 1949 20.54
  • 56.
    56 TABLE 64 Descriptive Statsto Question 17, “What is your highest degree or level of school completed?” RESPONSE N RAW % VALID % Less than high school 356 3.75 4.51 High school diploma (or GED) 877 9.24 11.11 Some college 1387 14.62 17.57 Associate’s degree (e.g., AA, AS) 1062 11.19 13.45 Bachelor’s degree (e.g., BA,BS) 2350 24.76 29.76 Master’s degree (e.g., MA, MS, MBA, MEd) 1489 15.69 18.86 Professionaldegreebeyond a bachelor’s degree (e.g., MD,DDS, LB, JD) 196 2.07 2.48 Doctorate degree (e.g., PhD, EdD) 179 1.89 2.27 Missings 1594 16.80 5. Profile of the type of person who checked “No” to Question 1 (i.e., do demographics tend to be similar or different). TABLE 65 Percent of Respondents With and Without Broadband by Race/Ethnicity BLACK HISPANIC WHITE OTHER Paid Access 8.4% 4.6% 82.1% 4.9% Free Access 25.9% 12.5% 54.3% 7.3% No Access 15.8% 8.3% 68.0% 8.0% TABLE 66 Percent of Respondents With and Without Broadband by Income Level LOW MEDIUM HIGH Paid Access 17.6% 51.8% 30.5% Free Access 56.7% 29.5% 13.8% No Access 64.7% 31.2% 4.1% TABLE 67 Percent of Respondents With and Without Broadband by Education Level LESSTHANHIGH SCHOOL HIGHSCHOOL DIPLOMA SOMECOLLEGE ASSOCIATES BACHELOR’S MASTER’S PROFESSIONAL DEGREE DOCTORATE Paid Access 3.1% 9.2% 16.5% 13.2% 32.2% 20.7% 2.7% 2.4% Free Access 28.3% 21.2% 14.2% 10.2% 15.0% 8.0% 1.3% 1.8% No Access 10.3% 24.7% 27.8% 16.8% 13.0% 6.0% 0.6% 0.9%
  • 57.
    57 ZIP CODE ANALYSIS– AGGREGATED TO THE REGIONAL LEVEL For this analysis, I first acquired NC populations by county from the NC office of State Budget and Management (osbm. nc.gov/demog/county-estimates). Next, I paired regions to counties and the summed the population from each county within each region together to attain a regional population value. I then divided this value over the total state population in order to acquire the regional population proportion. For the survey proportions, I summed up the total number of valid responses to the zip code question (note: this excludes around 2,000 responses from the total survey N). I then paired zip codes to their corresponding regions and totaled up the number of responses we had from each region. These regional totals were then divided over the sum of all valid responses to the zip code question. By acquiring proportions for both the NC population by region, and survey responses by region, we can observe the distribution of our respondents by region in comparison to the actual population by region. Ideally, survey proportions are similar to regional population proportions. TABLE 68 Zip Code Analysis REGION REGIONAL POPULATION PROPORTION REGIONAL SURVEY RESPONSE PROPORTION DIFFERENCE (IN ABSOLUTE VALUES) 1 5.3% 4.6% 0.7% 2 10.5% 11.7% 1.2% 3 23.4% 12.7% 10.7% 4 8.6% 14.0% 5.4% 5 16.5% 10.2% 6.3% 6 22.4% 10.9% 11.5% 7 6.2% 22.6% 16.4% 8 7.1% 13.3% 6.2% Overall, many of the regions appear to have been proportionately well represented, especially regions 1 and 2. Region 3 and 6 were the most underrepresented regions proportionately, in the survey. Region 3 and 6 are the most populated regions of the NC regions; however, their representation in the survey was roughly equal to most other regions, as opposed to being much larger. In contrast, region 7 was overrepresented in the survey, accounting for 22.6% of the survey responses. More respondents resided in this region than any other region; however, in the context of the NC population, region 7 accounts for the second lowest proportion of the total population. Because there were respondents who were excluded from the zip code analysis due to missing data and complications with the survey, there is error present in the table above. Although missing data may have occurred randomly, with regard to the survey complications, certain respondents who took the survey before a specific time point were excluded from this analysis. Therefore, it is likely that the proportions in the table were affected by this systematic error.
  • 58.
    58 APPENDIX E Survey DistributionPartners Catawba County Schools Creekside Elementary School Digital Charlotte E2D Durham Digital Equity Partnership Imhotep Academy, NCSU Kajeet Kramden Institute Lee County Schools North Carolina Department of Public Instruction North Carolina League of Municipalities North Carolina PTA State Library of North Carolina
  • 59.
    59 APPENDIX F Homework GapConvening Notes The schedule for the day was intentional. Each component of the agenda included opportunities for the participants to network and engage in meaningful discussion. Each session addressed eliminating the the homework gap. The following sections of this paper will provide an overview of the day including participants’ feedback during working groups and recommendations for addressing digital inequities in NC. SOLUTIONDESIGNBREAKOUTGROUP SESSIONS Participants spent part of the afternoon working in group sessions discussing four areas (1. Technology, Infrastructure, and Devices; 2. Sustainability; 3. Policy; and 4. Research and Data). A facilitator guided each group through conversations designed to both define the challenges associated with each topical area and develop thoughtful recommendations for practical next steps. The concurrent sessions began with a brief introduction of the participants in which they provided their name, organizational affiliation, and their connection to or reason for interest in the homework gap. Next, a guiding question aligned to the session topic was posted to generate ideas. Each participant was given small slips of paper to record their answers. The responses were placed on the wall and grouped by similarities. Each participant then received three stickers to select the top three areas they would like to discuss. BREAKOUT SESSION 1 Sustainability Solution Design (n=9) Guiding Questions: •• What are some creative financing models for closing the homework gap? •• What are the best ways to sustain those models? •• How would the addition of this/these solutions be useful in your district or area? •• Why would they be impractical? •• What are the best short-term solutions? •• What are the best long-term solutions? •• Which solution is most feasible? •• What barriers do you foresee? Representatives from city/state government, institutes of higher education, private business, public organizations, and schools/districts assembled to engage in productive conversations about eradicating the Homework Gap. The convening set three main priorities: 1) Continue the conversations held during the 2016 Digital Equity Convening; 2) Discuss new data on the scope and breadth of the homework gap in NC; and 3) Engage stakeholders and subject matter experts in designing solutions to close the gap. OPENING SESSION Glenn Kleiman, Friday Institute Executive Director Welcome Geoff Coltrane, NC Education Advisor Remarks Eric Boyett, NC CIO Remarks HOMEWORK GAP SURVEY DATA PRESENTATION Jessica Rosenworcel, Federal Communication Commissioner (FCC) Keynote Address HOMEWORK GAP SOLUTIONS PANEL Bruce Clark, Executive Director Digital Charlotte Rob Dietrich, Director of Accountability and Technology Lee County School Beth Lancaster, Director of Project ACCESS Montgomery County Schools HOMEWORK GAP SOLUTIONS BREAKOUT SESSIONS Policy Research and Data Sustainability Technology, Infrastructure, and Devices
  • 60.
    60 DISCUSSION SUMMARY General Assembly ••What is the General Assembly planning to do with the textbooks line item? With the digital resources line item? Can these somehow be reallocated to provide greater access? •• Use lottery funds to purchase laptops, devices, access, etc., by ADM. Local Government •• Allow local communities to build their own networks, which lowers the costs for the communities. •• Co-ops for building local networks with infrastructure grants •• Libraries that do not take e-rate funding can extend their network beyond their facilities to the community; however, not all libraries are connected by a fiber line. •• Local networks will have ongoing sustainability issues (built by local governments). •• Subsidizing access requires continuous funding from the state or local government, or from private entities, or both. •• Ask local agencies (churches, banks, etc.) to help fund internet access for disadvantaged students. •• Cumberland County model (mapping out places with Wifi and labeling them) helps students find locations to get access. Safety can be a concern for students having to go somewhere outside of the home to use wifi. •• Ask local governments to allocate some of the money they get from leasing space for wireless carrier towers to schools •• Verizon, AT&T, Sprint, T-Mobile = major wireless carriers – should rely on existing carriers for their networks rather than creating their own. School Districts •• Local corporate partners to assist with providing access by funding on an ongoing basis •• Sustainability for school districts = devices, connectivity, training •• Get corporate sponsorships for hot spot creation, with splashpads, so students can get access. The ad revenue to districts could support purchasing devices and access. •• Have teachers stop assigning homework Private Entities •• Educational publishers need to understand that instructional resources can only be purchased for one to two years at a time. •• The point of getting more access for students is to provide them an equal footing for education to everyone else, who has access. Once the students have the access at home, even though it’s limited, many parents see the value and purchase wireless access for the home. •• School districts purchase for the school year, not monthly. POTENTIAL SOLUTIONS •• Develop public-private partnerships. •• Shift school funds from textbooks to technology •• Reduce costs of wireless access; use a state-level agency to negotiate lower costs for all school districts, just as DPI does for instructional resources (textbooks). •• The General Assembly should create line items that require funds be used for connectivity. •• Open conversations with service carriers about allowing them to put cell towers on district properties on a lease available to nonprofit organizations.
  • 61.
    61 DISCUSSION SUMMARY •• Cleanup the surplus laws that make it easier for distribute the devices. Currently, there is a concern from the state will lose surplus revenue from device sales to other nonprofits, public auction, and for- profit recycling. They want to be sure they can keep some similar level of revenue that they would be losing. If you take care of that part of it which is a big weight on families, then you focus on access. •• HB-129- Law passed at the state level that does not allow local government to provide infrastructure for internet access. Supported by the telecom industry. If you’re looking at getting broadband access, it is hard for cities to help. A counterpoint, the cities and municipalities are forced to play on the same level as telecom providers. The outlying areas, such as in western NC, mountaintops or valleys, that are far from the nearest municipality, if a municipality could lay the groundwork, it would free up the municipality to focus others. HB 129 puts limits on the municipalities ability to lay groundwork outside their boundaries. City of Wilson has their own WIFI network and they can go anywhere in the County of Wilson, but they choose not to go to those areas because it isn’t cost effective. Does HB 129 limit the creative problem solution for difficult areas? NC Rural Center has researched this a lot. Wilson is a great example of a success but not every municipality should try to copy that model. There are examples of remote areas such as Alleghany that has great fiber access. Educating the municipalities on the variety of options that are available to municipalities. There are grey areas that laws don’t allow municipalities to do some things. We could get a common understanding/ best practices list to clarify some of these grey areas and get municipalities on the right track. County folks have the impression that they can’t really do much of anything. Municipalities can provide free services. •• A grant program would have the most immediate impact to communities. The state has taken on grant funding to reach the 7% of households that don’t have access. Back of the hand calculations to get all of the rural areas access would be $300-400 million. There is no way the General Assembly will appropriate taxpayer dollars to finish that. If you focus on underserved, you will never get to unserved. It is cheaper to speed up locations with access already than to get access to places without any at all. Adoption is the biggest issue. That would dramatically change the business model to make the profitability to go into rural areas much greater. BREAKOUT SESSION 2 Policy Solution Design (n=19) Guiding Questions: •• What policy changes are needed at the local, state, and federal level to bridge the homework gap? POTENTIAL SOLUTIONS •• Federal law to encourage the re-use of surplus devices/ make them available to nonprofit organizations •• Repeal HB 129- Municipal government cannot provide internet access •• Local understanding and overcoming regulatory and communication barriers to pave the way for a wider variety of service providers. •• Grant funding to make high cost rural areas more economical for private providers to deploy service to unserved areas. •• How would this policy change be useful in your district or area? •• Why would it be impractical or cause hardship? •• What are the best solutions (short-term and long-term)? •• Which solution is most feasible? •• What barriers do you foresee?
  • 62.
    62 DISCUSSION SUMMARY •• Lookat existing data we have and try to fill in gaps where there was no response; that’s foundational first-step approach of improving it, is to get as many responses as possible especially in geographic areas where we got low responses, so every zip code in the state would have some type of response. •• One of the staff members shared the difficulty and expense of moving of deploying the paper survey. “I think the hardest part was getting people thinking about the paper aspect of it -- we knew that was such a big deal but the money to fund getting the paper; then if you got the paper, do we mail it in or send someone to pick it up, so the logistics of doing a massive paper survey gave us hesitation, which is why Catawba County agreed to have their own and then we sent some people to pick them up, and we printed on both sides but they still ended up being 4-5 pages stapled, so that’s heavy; the online one is easy to send” Offering an online survey to people without internet is problematic. It was suggested that the survey be given through community centers, churches and schools during school events such as open houses. •• In affluent areas, you’re gonna get your responses either way because they’ll have easier access to surveys; if you want to see where the true gap lies, target the more rural or high need poverty areas; in my opinion as a teacher, those are the areas that need the access the most -- i have kids who live right near downtown Winston-Salem, they don’t have internet access and don’t even have a device, so that gap would still be there. Can you dig deeper into that, do they see the need to have that device, digging into the root cause of it? •• Those of us on the outside, this expectation that people want to take the survey – the hardest part for us was getting people to finish the survey; more people had access to it but they never finished it; and maybe it’s time or survey fatigue, but how can we get what we need to get in the shortest amount of time or questions without it being cumbersome. You can’t give them anything more than a page and they’re done, they’re busy and working and you have to think about the language we’re using, writing these questions in -- i have parents who struggle with reading and now you’re encountering this frustration piece, so that’ something else to consider •• Wake has a lower percentage of lack of access homework gap students than Montgomery or rural areas but in terms of absolute number of students, the number could actually be higher, so the impact of that -- the mixed methods is smart, but one of the things I’d suggest is thinking about tech proxies, so we have a tool that integrates with Google to help districts understand how tech is being used/access across the district and you can check the timing (between 4pm and 7am) and see to what extent that’s occurring, so that’s another method of getting data; it’s data acquisition opportunity, it’s not direct but could yield interesting data. 40,000 in CMS don’t have it in their home, but i guarantee they have access to 2 or 3 providers at home, so providers can tell you where we don’t have service, it’s when it’s available, why aren’t you subscribing? If we’re the only provider, we’re thrilled 60% of people subscribe, so if we fixed this adoption issue, more people would buy the services and it’d be more economic. You think you’d see more providers doing that with the return on investment. BREAKOUT SESSION 3 Research and Data Solution Design (n=8) Guiding Questions: •• How can we improve upon the pilot research, data collection, and analysis? •• What partnerships are needed to distribute the survey directly through the schools to K-12 households? •• What are other ways homework gap data can be collected to bolster the survey results? •• Why would they be impractical? •• Which solution is most feasible? •• What barriers do you foresee? POTENTIAL SOLUTIONS •• Improve the data collection to ensure there is a wider response from more diverse participants •• Target rural and high need poverty areas •• Shorten the survey •• Use data analytics to determine usage trends
  • 63.
    63 Technology, Infrastructure, andDevices (n=15) Guiding Questions: •• What technologies are needed to bridge the homework gap? •• How would the addition of this/these technologies be useful in your district or area? DISCUSSION SUMMARY •• Explore state surplus law and how to maneuver through state agencies to get access to devices •• State initiative to fund devices (long term) •• Advocate for legal/policy changes for surplus of devices/computers due to this being a revenue source for State Surplus would need to reviewed and possibly changed •• Inventory the number of students and aggregate demand of the school systems that need devices •• Secure devices with a “keyboard” would be more beneficial (i.e. Chromebook) •• Take into account quality of device for grade level being served •• (Short) Tech companies and data centers and providing devices - Inquire where this starts •• (Long) e-Rate and law changes - State continue to support be modernized POTENTIAL SOLUTIONS •• Determine a way to “unlock” the State Surplus law passed this year •• Demand aggregation for procurement/contracting/ purchasing of devices •• Create a clearinghouse for information/resources so locals are not starting from the ground •• Why would they be impractical? •• What are the best short-term solutions? •• What are the best long-term solutions? •• Which solution is most feasible? •• What barriers do you foresee?
  • 64.
    64 APPENDIX G Convening Attendees FIRSTNAME LAST NAME ORGANIZATION Aimee Meacham National Telecommunications and Information Administration Allen Lee Tyrrell County Schools Amber Harris North Carolina Association of County Commissioners Amy Huffman The Broadband Infrastructure Office, NC Department of Information Technology Angie Bailey ECC Technologies Beth Lancaster Montgomery County Schools Bill Holmes NC Department of Information Technology Brad Rhew Winston-Salem/Forsyth County Schools Brett Brenton The Research Triangle Park Bruce Clark Digital Charlotte Cal Shepard State Librarian's Office of North Carolina Candace Salmon-Hosey Rowan-Salisbury Schools Casey Jones Moore County Schools Cecilia Holden State Board of Education Chris Wasko Wake County Public Schools Cindy Johnson E-Rate Services, LLC Darren Bell Chapel Hill-Carrboro City Schools Dave Furiness MCNC Dean Russell Country Cablevision, Inc. Derek Kelly CenturyLink, Inc. Donna Malloy Wilson County Schools Dr. S. Janine Parker NC A&T University Elaine Batten Durham Public Schools Eric Boyette NC Department of Information Technology Eric Cramer Wilkes Telecommunications Erin Wynia North Carolina League of Municipalities Gene Ballard Kajeet George Collier The Broadband Infrastructure Office, NC Department of Information Technology Jane Smith Patterson Broadband Catalysts Jeff Sural The Broadband Infrastructure Office, NC Department of Information Technology Jeffrey Hamilton State Librarian's Office Jeni Corn Friday Institute Jennifer Hererra Project Ed Jenny Myers E2D Johanna Reese North Carolina Association of County Commissioners John Coggin North Carolina Rural Economic Development Center
  • 65.
    65 J'Tanya Adams EveryoneOn KarlRectanus LearnPlatform Kendt Eklund Moore County Schools Linda Jones City of Raleigh Lindsay Saunders NC Department of Information Technology Mark Johnson MCNC Mary Furtado Catawba County Manager's Office MaryAlice Warren NC Department of Information Technology Melissa Thibault North Carolina School of Science and Mathematics Mia Bailey Charter Michael Abensour Kramden Michael Flood Kajeet Michael Maher North Carolina State University Monica Belford Durham County Library Phil Emer Friday Institute Ray Zeisz Friday Institute Richard Bostic North Carolina School Board Association Rick Pilato Catawba County Manager's Office Robert Dietrich Lee County Schools Sammy Roberson Charter Samuel Wicks Durham Housing Authority Sara Weiss Friday Institute Stephanie Jane Edwards MCNC Steve Brewer CenturyLink Susan Miller Frontier Communications Tia Bethea Google Fiber Todd Brantley NC Rural Economic Development Center Trey Rabon AT&T Tricia Townsend Friday Institute Veronica Creech EveryoneOn Wes King The Broadband Infrastructure Office, NC Department of Information Technology William Seiz Final Mile Communications
  • 66.
    66 Acknowledgements PROJECT DIRECTOR, LEADRESEARCHER AND AUTHOR Amy Huffman, Research and Policy Specialist Broadband Infrastructure Office, NC Department of Information Technology LEAD RESEARCHERS Emily A. Antoszyk, Research Associate Friday Institute for Educational Innovation, North Carolina State University Avril Smart Goggans, Ph.D., Research and Engagement Manager Alliance for Excellent Education Janine Parker, Ph.D., Director NC AgrAbility, North Carolina Agricultural and Technical State University LaTricia W. Townsend, Ed.D., Senior Research Scholar Friday Institute for Educational Innovation, North Carolina State University Andrew Weedfall, Graduate Research Assistant Friday Institute for Educational Innovation, North Carolina State University PROJECT SUPPORT AND DIRECTION Jeffrey Sural, Director Broadband Infrastructure Office, NC Department of Information Technology CONTRIBUTING RESEARCHER Jeni Corn, Ph.D., Director of Evaluation Programs Friday Institute for Educational Innovation, North Carolina State University CONTRIBUTING AUTHOR LaTricia W. Townsend, Ed.D., Senior Research Scholar Friday Institute for Educational Innovation, North Carolina State University EDITORS William Holmes, Director of Legislative and Public Affairs NC Department of Information Technology Wesley King, Director of Communications Broadband Infrastructure Office, NC Department of Information Technology GRAPHIC DESIGN Laura Murray, Graphic Designer NC Department of Commerce
  • 67.
    67 ncbroadband.gov | broadband@nc.gov TheNorth Carolina Department of Information Technology’s Broadband Infrastructure Office (BIO) was established by the State Chief Information Officer (SCIO) in 2014 as a statewide resource for broadband access, first responder communication and student connectivity initiatives led by the State of North Carolina. BIO provides policy and strategy guidance and recommendations to community and state leaders on ways to enhance high-speed internet access for global competitiveness, education, public safety, healthcare, and government efficiency. About the Authors fi.ncsu.edu | 919 513 8500 The Friday Institute Research and Evaluation (FIRE) Group, a unit of North Carolina State University’s College of Education, provides a unique and comprehensive understanding of innovations in K-12 public education in North Carolina and nationally, including special expertise in developing systemic evaluations for comprehensive, innovative initiatives. Most recently, the Friday Institute lead the development and current implementation of the NC Digital Learning Plan which highlights the digital learning needs of the state to include out of school access. In addition, the FIRE Group is actively pursuing partnerships with community stakeholders to investigate the digital equity challenges in NC districts and schools. By combining exemplary practices, diverse professional backgrounds, and strong working relationships with education stakeholders, the FIRE Group contributes to effective, data-driven decision-making for the continuous improvement of teaching and learning.
  • 68.
    ncbroadband.gov | broadband@nc.govfi.ncsu.edu | 919 513 8500