Download to read offline
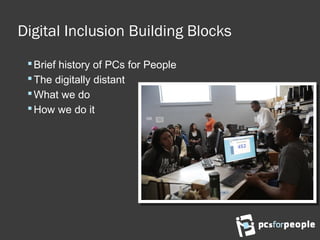
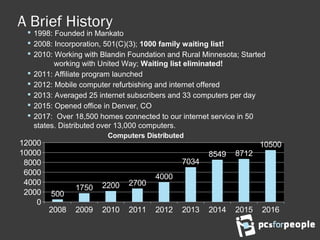
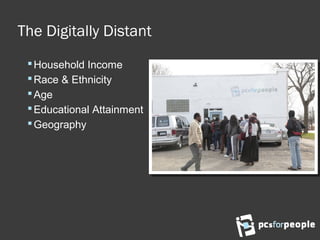
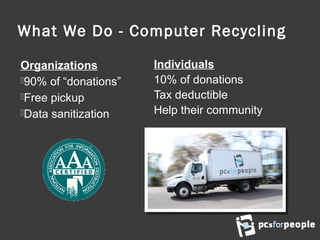
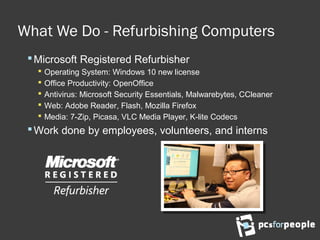
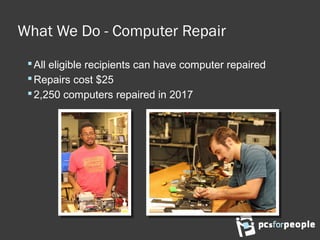
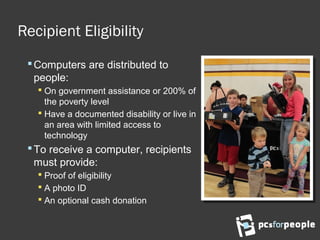

This document provides an overview of PCs for People, a nonprofit organization that works to address the digital divide. It discusses the organization's history since 1998 of refurbishing donated computers and distributing them to low-income families. It also explains how in more recent years the organization has expanded its services to include internet access through subsidized mobile hotspots and pay-as-you-go internet plans. The document outlines PCs for People's refurbishing process, eligibility requirements for recipients, and ways for other organizations to partner with them through distribution events or library hotspot lending programs.


![5G Explained! A High Level Overview [Introduction]](https://cdn.slidesharecdn.com/ss_thumbnails/5gexplainedahighleveloverview-260119165306-cc137a3e-thumbnail.jpg?width=640&height=640&fit=bounds)


