Download as PDF, PPTX


![Copyright
©2012
The
Nielsen
Company.
ConfidenOal
and
proprietary.
28
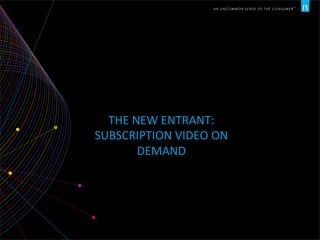
SUBSCRIPTION
VIDEO
ON
DEMAND
DEFINED
Subscrip:on
Video
On
Demand,
[SVOD],
On
demand
video
content
made
available
to
consumers
via
internet
connected
devices
on
a
subscripOon
basis
(separate
from
MVPD
subscripOon).
Examples
include:
Ne1lix,
Hulu
Plus,
and
Amazon
Prime.](https://image.slidesharecdn.com/brianfuhrercustomcontentdeckvf-140421103332-phpapp02/85/Brian-Fuhrer-Senior-Vice-President-Product-Leadership-National-and-Cross-Platform-Television-Audience-Measurement-Neilsen-28-320.jpg)

![Copyright
©2012
The
Nielsen
Company.
ConfidenOal
and
proprietary.
33
RECENTLY
TELECAST
VIDEO
ON
DEMAND
DEFINED
Recently
Telecast
Video
On
Demand,
[RTVOD],
On
demand
content
provided
by
MVPDs
that
is
taken
directly
from
the
live/
linear
airing
(including
same
commercials)
within
7
days
of
broadcast.
Viewing
credits
back
to
TV
raOngs
as
Omeshijed
viewing.
All
major
U.S.
broadcast
networks
and
most
cable
networks
now
make
their
content
available
via
RT
VOD
via
all
major
MVPDs.](https://image.slidesharecdn.com/brianfuhrercustomcontentdeckvf-140421103332-phpapp02/85/Brian-Fuhrer-Senior-Vice-President-Product-Leadership-National-and-Cross-Platform-Television-Audience-Measurement-Neilsen-33-320.jpg)


This document summarizes key trends in U.S. video consumption over the past 5 years based on Nielsen data. It finds that while total TV screen time has increased slightly, when and how people watch video has significantly changed. Younger viewers in particular have shifted to watching more video on smartphones, tablets, computers, and game consoles rather than live TV. The increasing popularity of video on demand and connectivity of TVs and other devices to the internet has also created new opportunities for video providers.


![U.S. Hispanics Ahead of Digital Curve - Nielsen Consumer Report [Feb 2014]](https://cdn.slidesharecdn.com/ss_thumbnails/the-digital-consumer-report-feb-2014-141002114717-phpapp02-thumbnail.jpg?width=640&height=640&fit=bounds)


