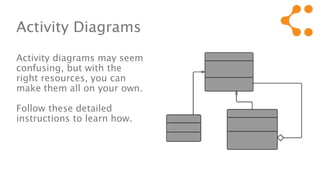
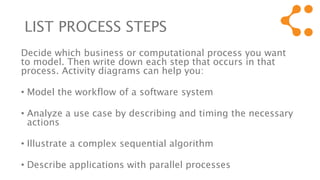
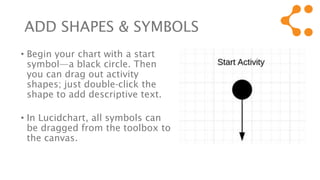
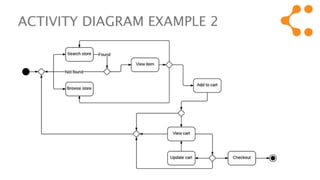
UML – Activity Diagram
Tutorial
Activity Diagrams
Activity diagrams may seem
confusing, but with the
right resources, you can
make them all on your own.
Follow these detailed
instructions to learn how.
LIST PROCESS STEPS
Decide which business or computational process you want
to model. Then write down each step that occurs in that
process. Activity diagrams can help you:
• Model the workflow of a software system
• Analyze a use case by describing and timing the necessary
actions
• Illustrate a complex sequential algorithm
• Describe applications with parallel processes
DO YOUR RESEARCH
• Before we go any further, be sure to review the basics.
You should understand what an activity diagram is. You
may even want to review what UML is, so you fully
understand the language that activity diagrams use as a
guide.
• When you're prepared with the necessary tools—
including a diagramming program like Lucidchart—it's
time to get started.
ADD SHAPES & SYMBOLS
• Begin your chart with a start
symbol—a black circle. Then
you can drag out activity
shapes; just double-click the
shape to add descriptive text.
• In Lucidchart, all symbols can
be dragged from the toolbox to
the canvas.
SHAPES Cont’d
• Add symbols as your process requires and use
connectors to show the flow of each activity as it
ends and begins.
• We've listed the most common symbols in the
next slides, along with their meanings. If you're
still confused, check out this comprehensive guide
to activity diagram symbols.
SHAPES Cont’d
• Activity nodes, also known as activity states, represent a
single step within a workflow.
• Transitions are simply connecting lines that demonstrate
which activity node follows another.
• Decisions are represented with diamond shapes. They
show alternative threads in the workflow.
• Synchronization bars are used to model parallel
subflows. These thick vertical or horizontal lines allow you
to show concurrent threads in a process.
Activity Diagram
Example 1
REVIEW THE FLOW
To ensure that you're demonstrating the important steps in
your activity, consider questions like:
• What happens when this process is initiated? How does
the process complete itself?
• How does one activity affect other steps in the
workflow, organization, or system?
• When do other factors and people enter the flow?
Which options or new paths do they provide?
REVIEW THE FLOW
• When you've covered these questions, ask your team
members to review the finished document.
• They may be able to provide a unique perspective
that ultimately improves understanding.
ACTIVITY DIAGRAM EXAMPLE 2
Resources
• See Lucid U for examples
and tutorials on UML
activity diagrams.
• Try the Lucidchart demo
for free!
Create a variety of UML diagrams, including activity diagrams, with Lucidchart. Our simple
online editor makes it easy to map any process or workflow right from your browser!

UML - activity diagram tutorial

  • 1.
    UML – ActivityDiagram Tutorial
  • 2.
    Activity Diagrams Activity diagramsmay seem confusing, but with the right resources, you can make them all on your own. Follow these detailed instructions to learn how.
  • 3.
    LIST PROCESS STEPS Decidewhich business or computational process you want to model. Then write down each step that occurs in that process. Activity diagrams can help you: • Model the workflow of a software system • Analyze a use case by describing and timing the necessary actions • Illustrate a complex sequential algorithm • Describe applications with parallel processes
  • 4.
    DO YOUR RESEARCH •Before we go any further, be sure to review the basics. You should understand what an activity diagram is. You may even want to review what UML is, so you fully understand the language that activity diagrams use as a guide. • When you're prepared with the necessary tools— including a diagramming program like Lucidchart—it's time to get started.
  • 5.
    ADD SHAPES &SYMBOLS • Begin your chart with a start symbol—a black circle. Then you can drag out activity shapes; just double-click the shape to add descriptive text. • In Lucidchart, all symbols can be dragged from the toolbox to the canvas.
  • 6.
    SHAPES Cont’d • Addsymbols as your process requires and use connectors to show the flow of each activity as it ends and begins. • We've listed the most common symbols in the next slides, along with their meanings. If you're still confused, check out this comprehensive guide to activity diagram symbols.
  • 7.
    SHAPES Cont’d • Activitynodes, also known as activity states, represent a single step within a workflow. • Transitions are simply connecting lines that demonstrate which activity node follows another. • Decisions are represented with diamond shapes. They show alternative threads in the workflow. • Synchronization bars are used to model parallel subflows. These thick vertical or horizontal lines allow you to show concurrent threads in a process.
  • 8.
  • 9.
    REVIEW THE FLOW Toensure that you're demonstrating the important steps in your activity, consider questions like: • What happens when this process is initiated? How does the process complete itself? • How does one activity affect other steps in the workflow, organization, or system? • When do other factors and people enter the flow? Which options or new paths do they provide?
  • 10.
    REVIEW THE FLOW •When you've covered these questions, ask your team members to review the finished document. • They may be able to provide a unique perspective that ultimately improves understanding.
  • 11.
  • 12.
    Resources • See LucidU for examples and tutorials on UML activity diagrams. • Try the Lucidchart demo for free! Create a variety of UML diagrams, including activity diagrams, with Lucidchart. Our simple online editor makes it easy to map any process or workflow right from your browser!