Download as PDF, PPTX
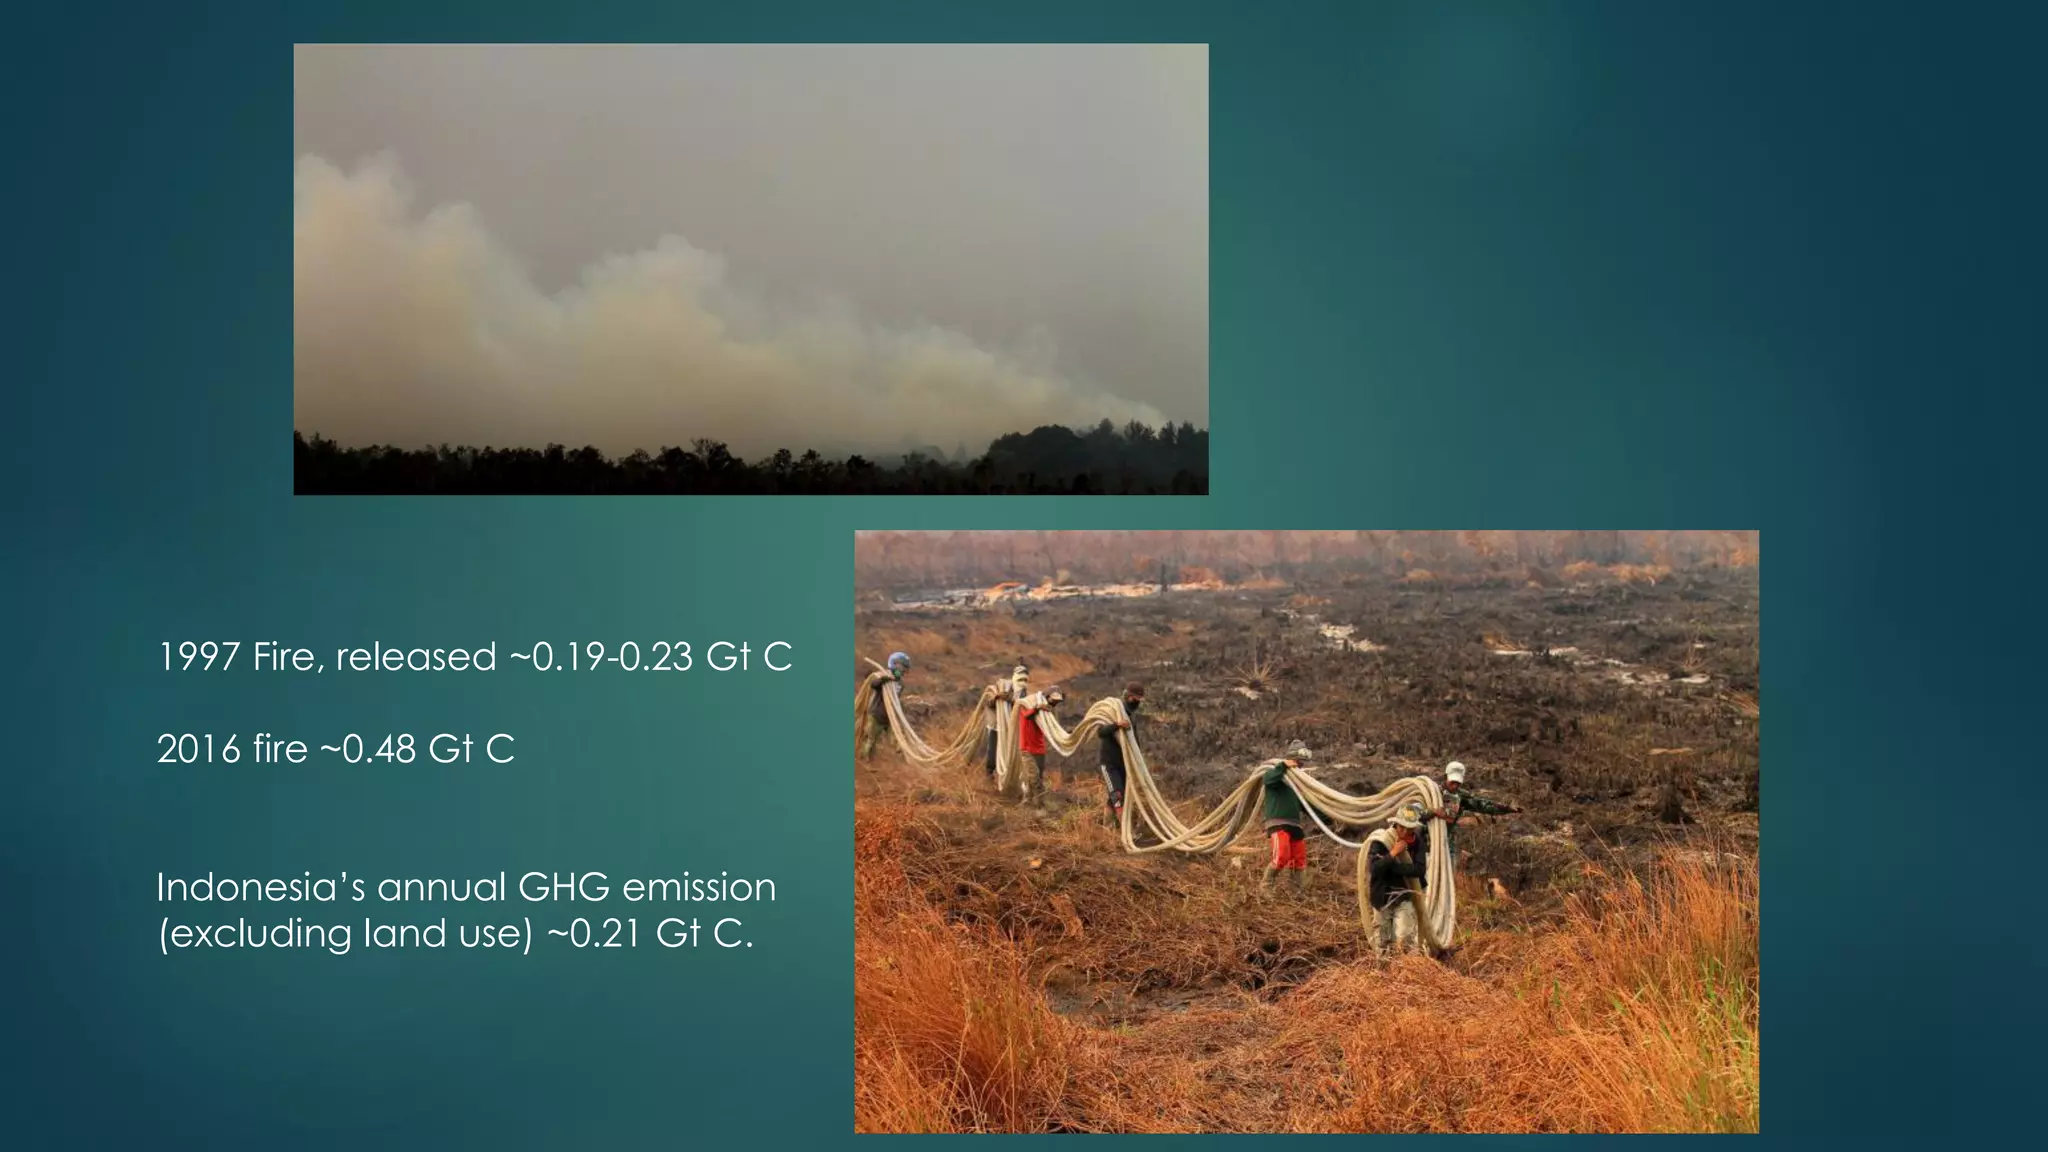
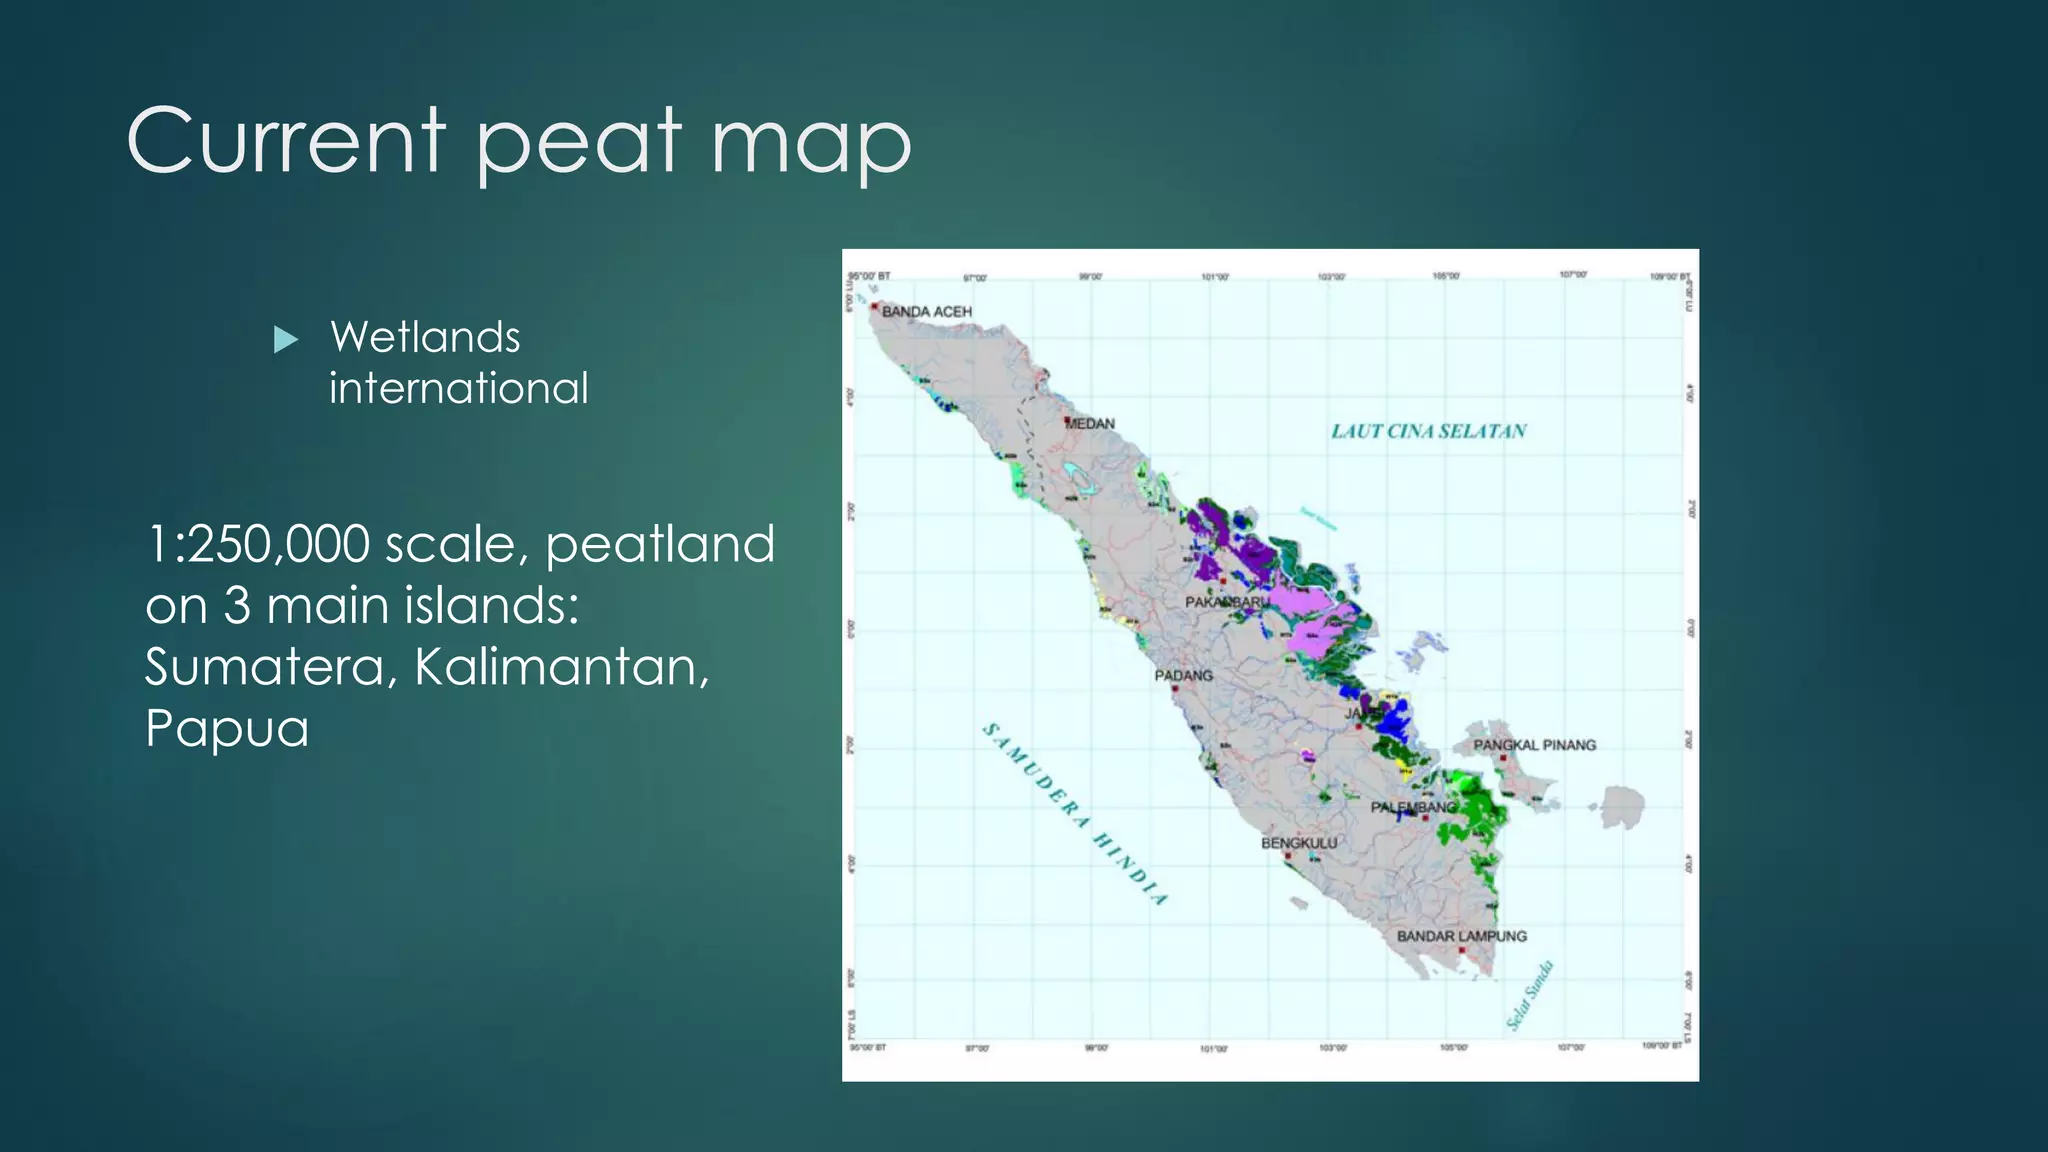
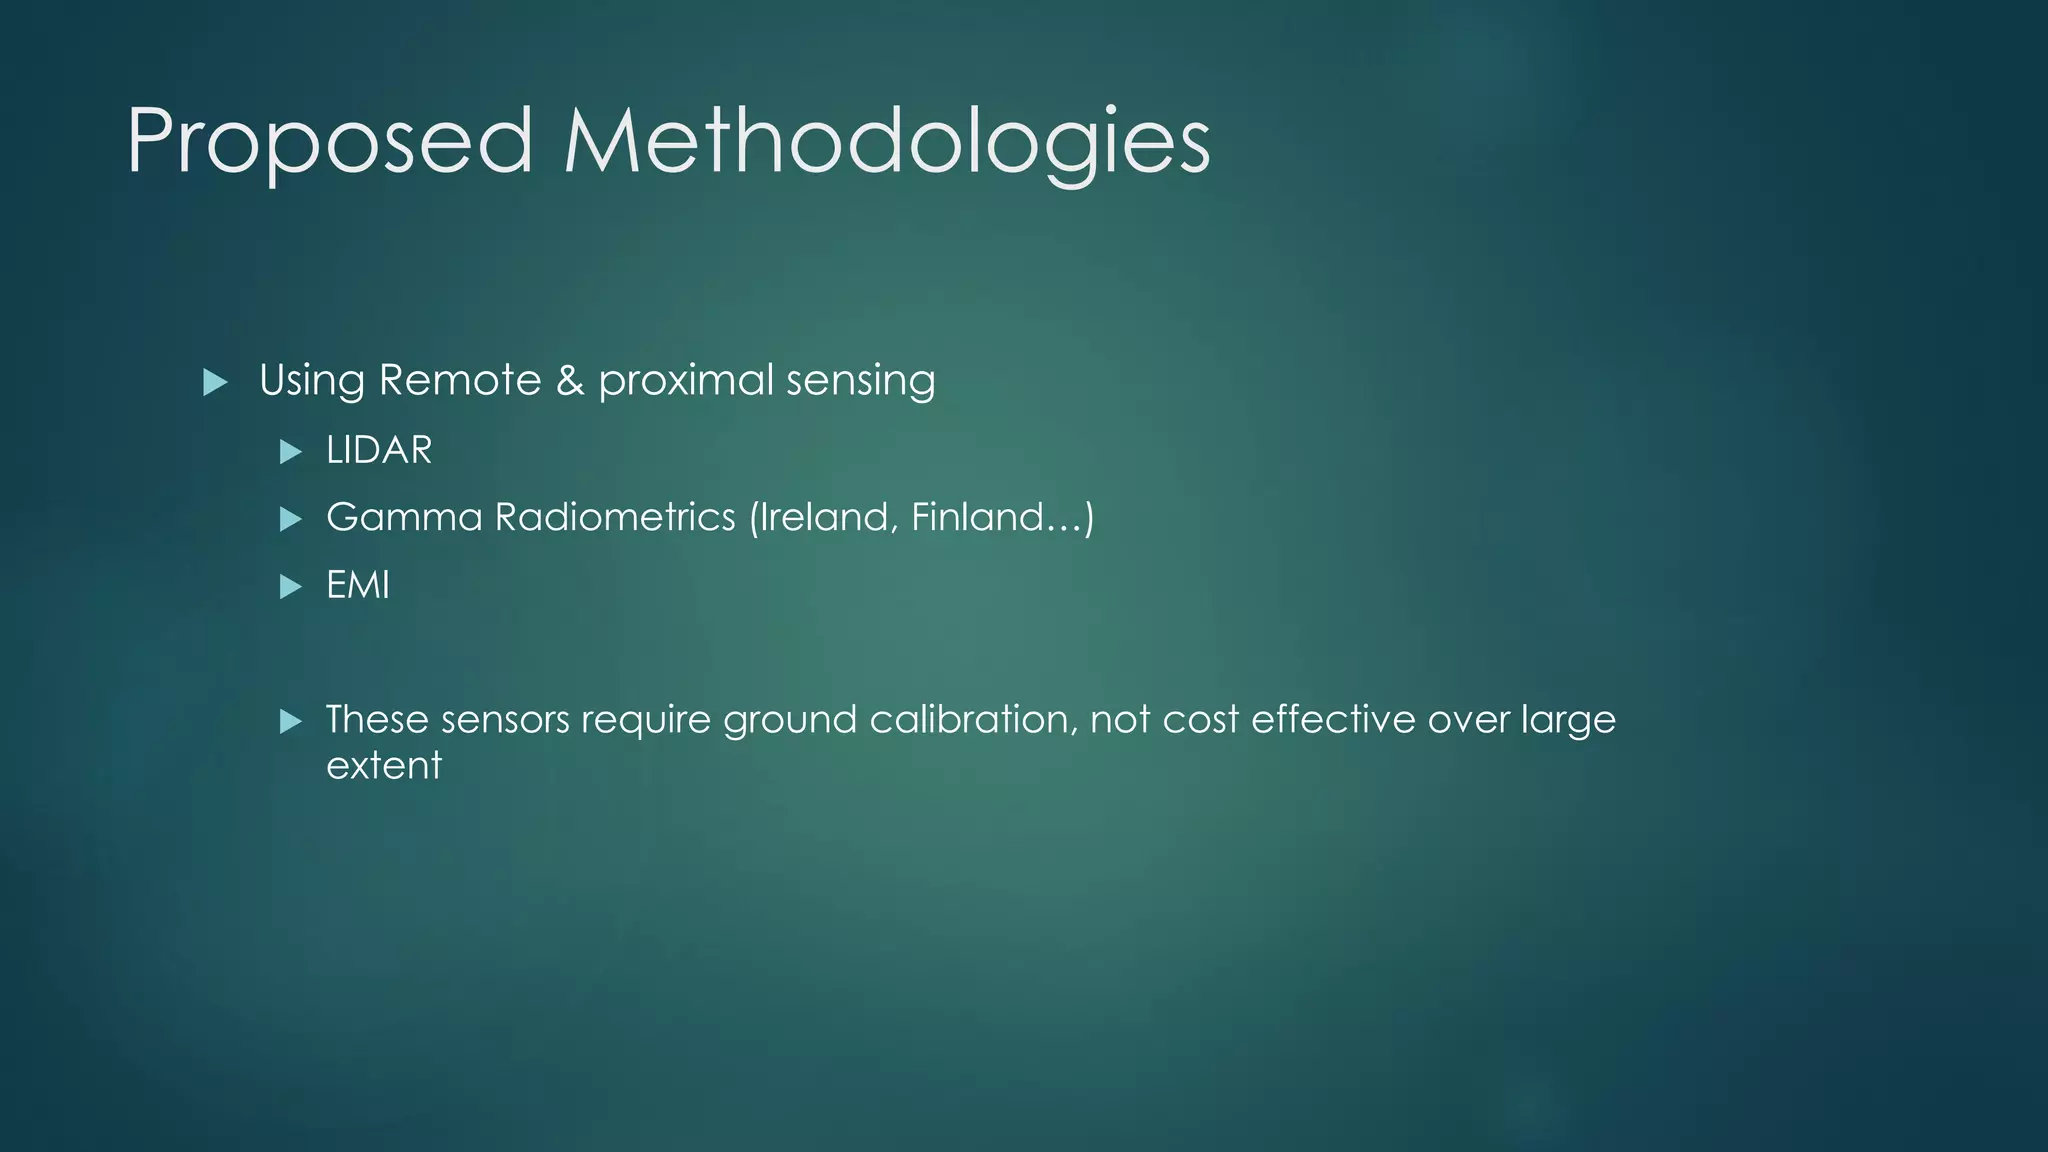
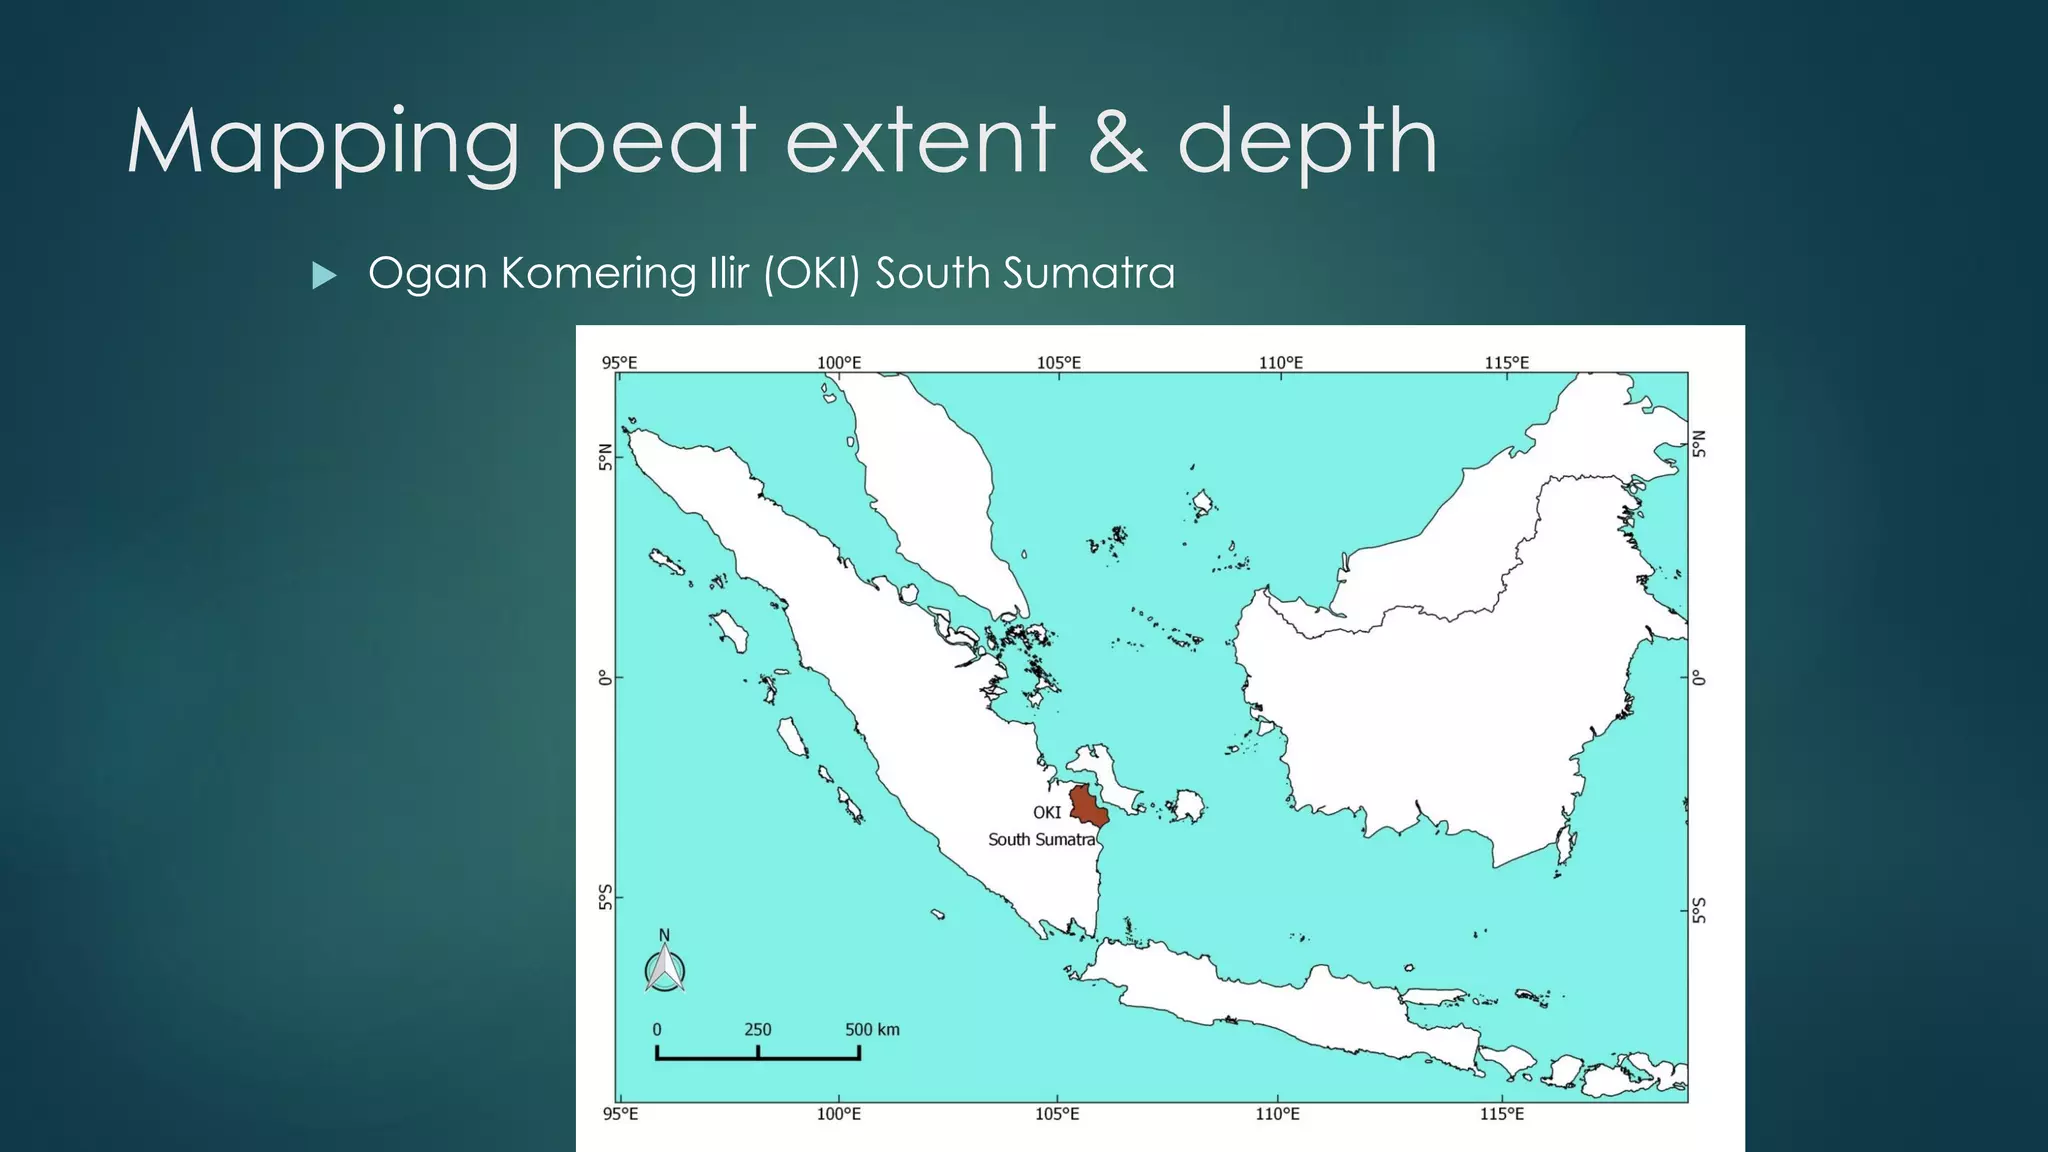
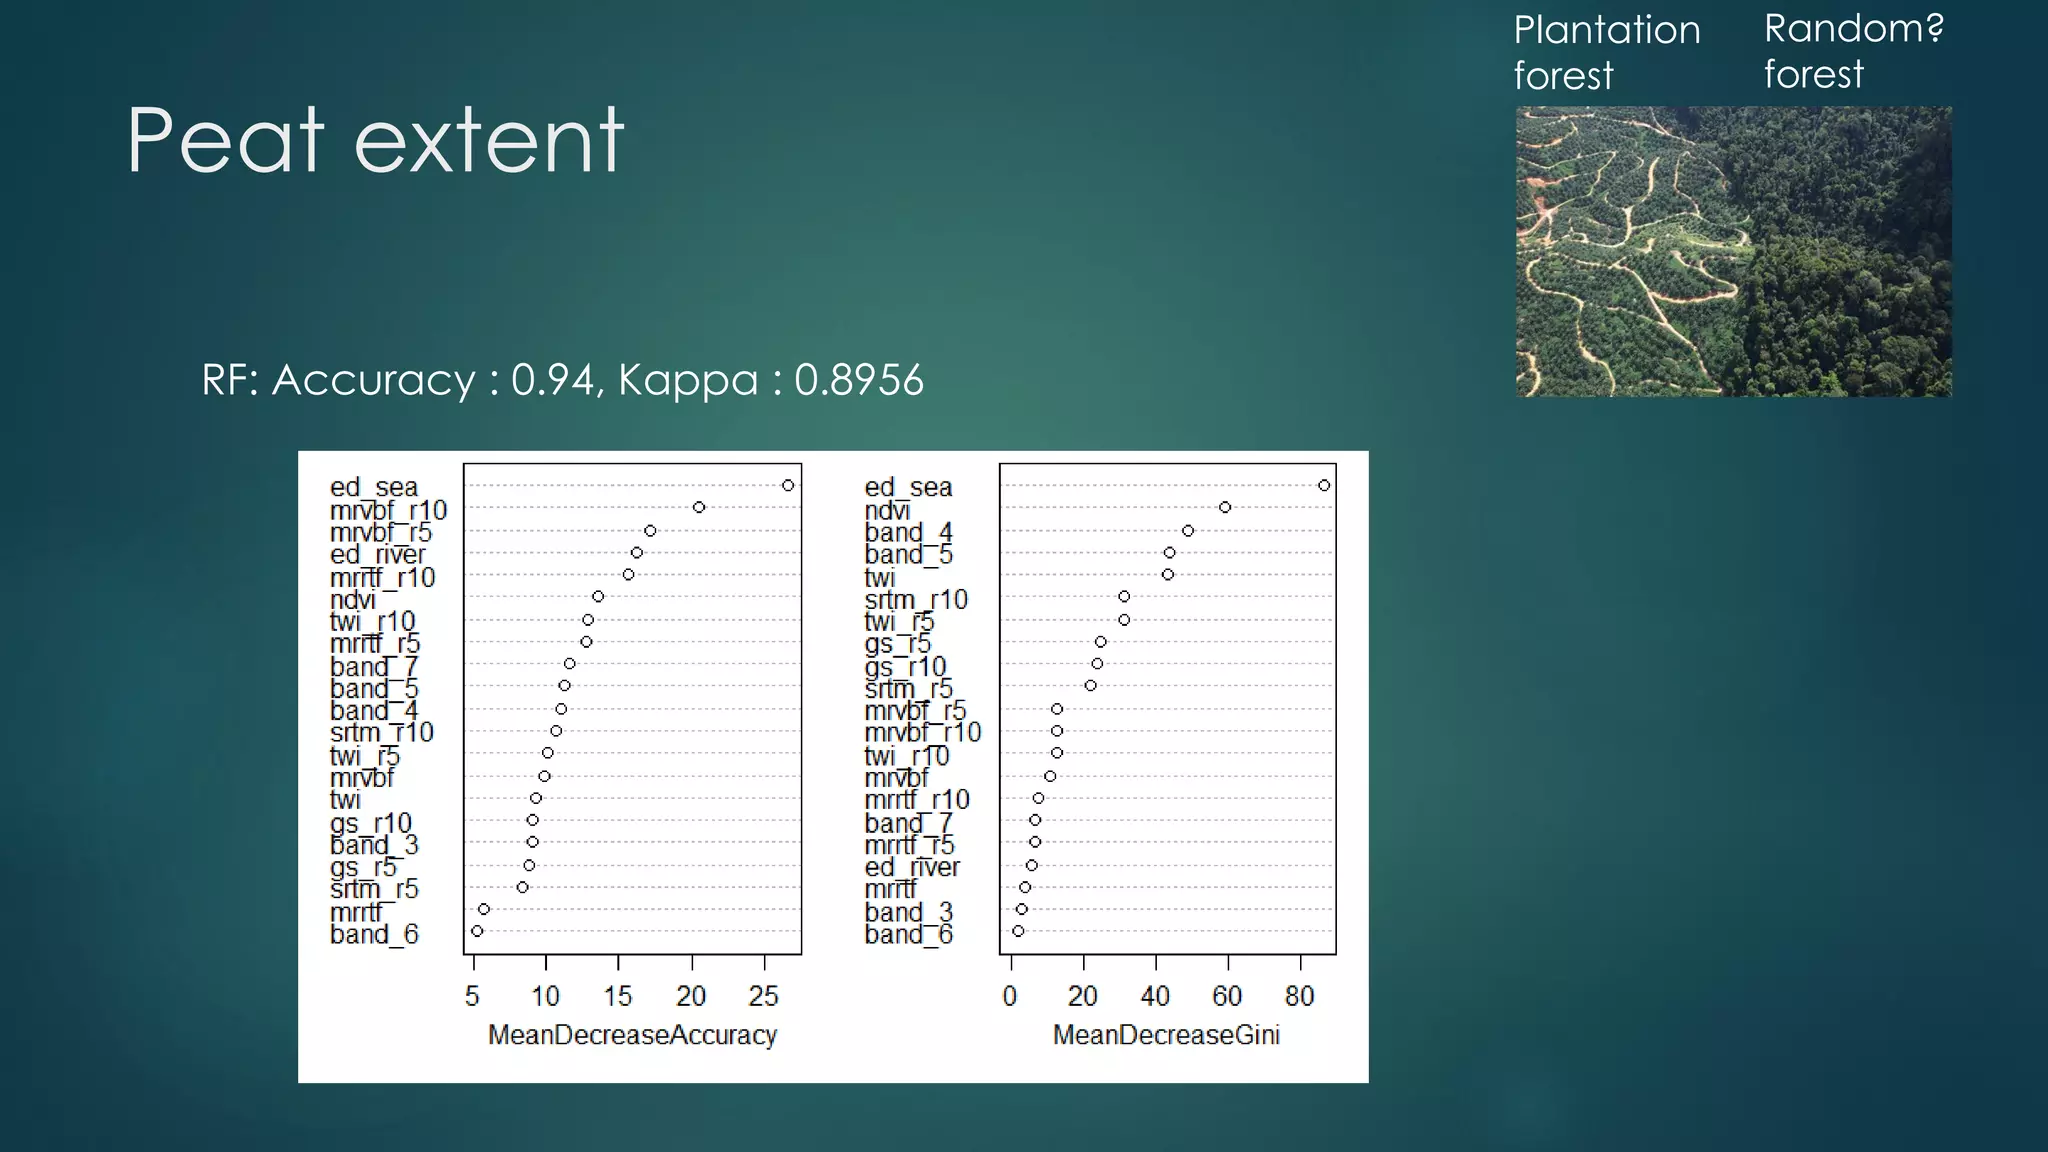
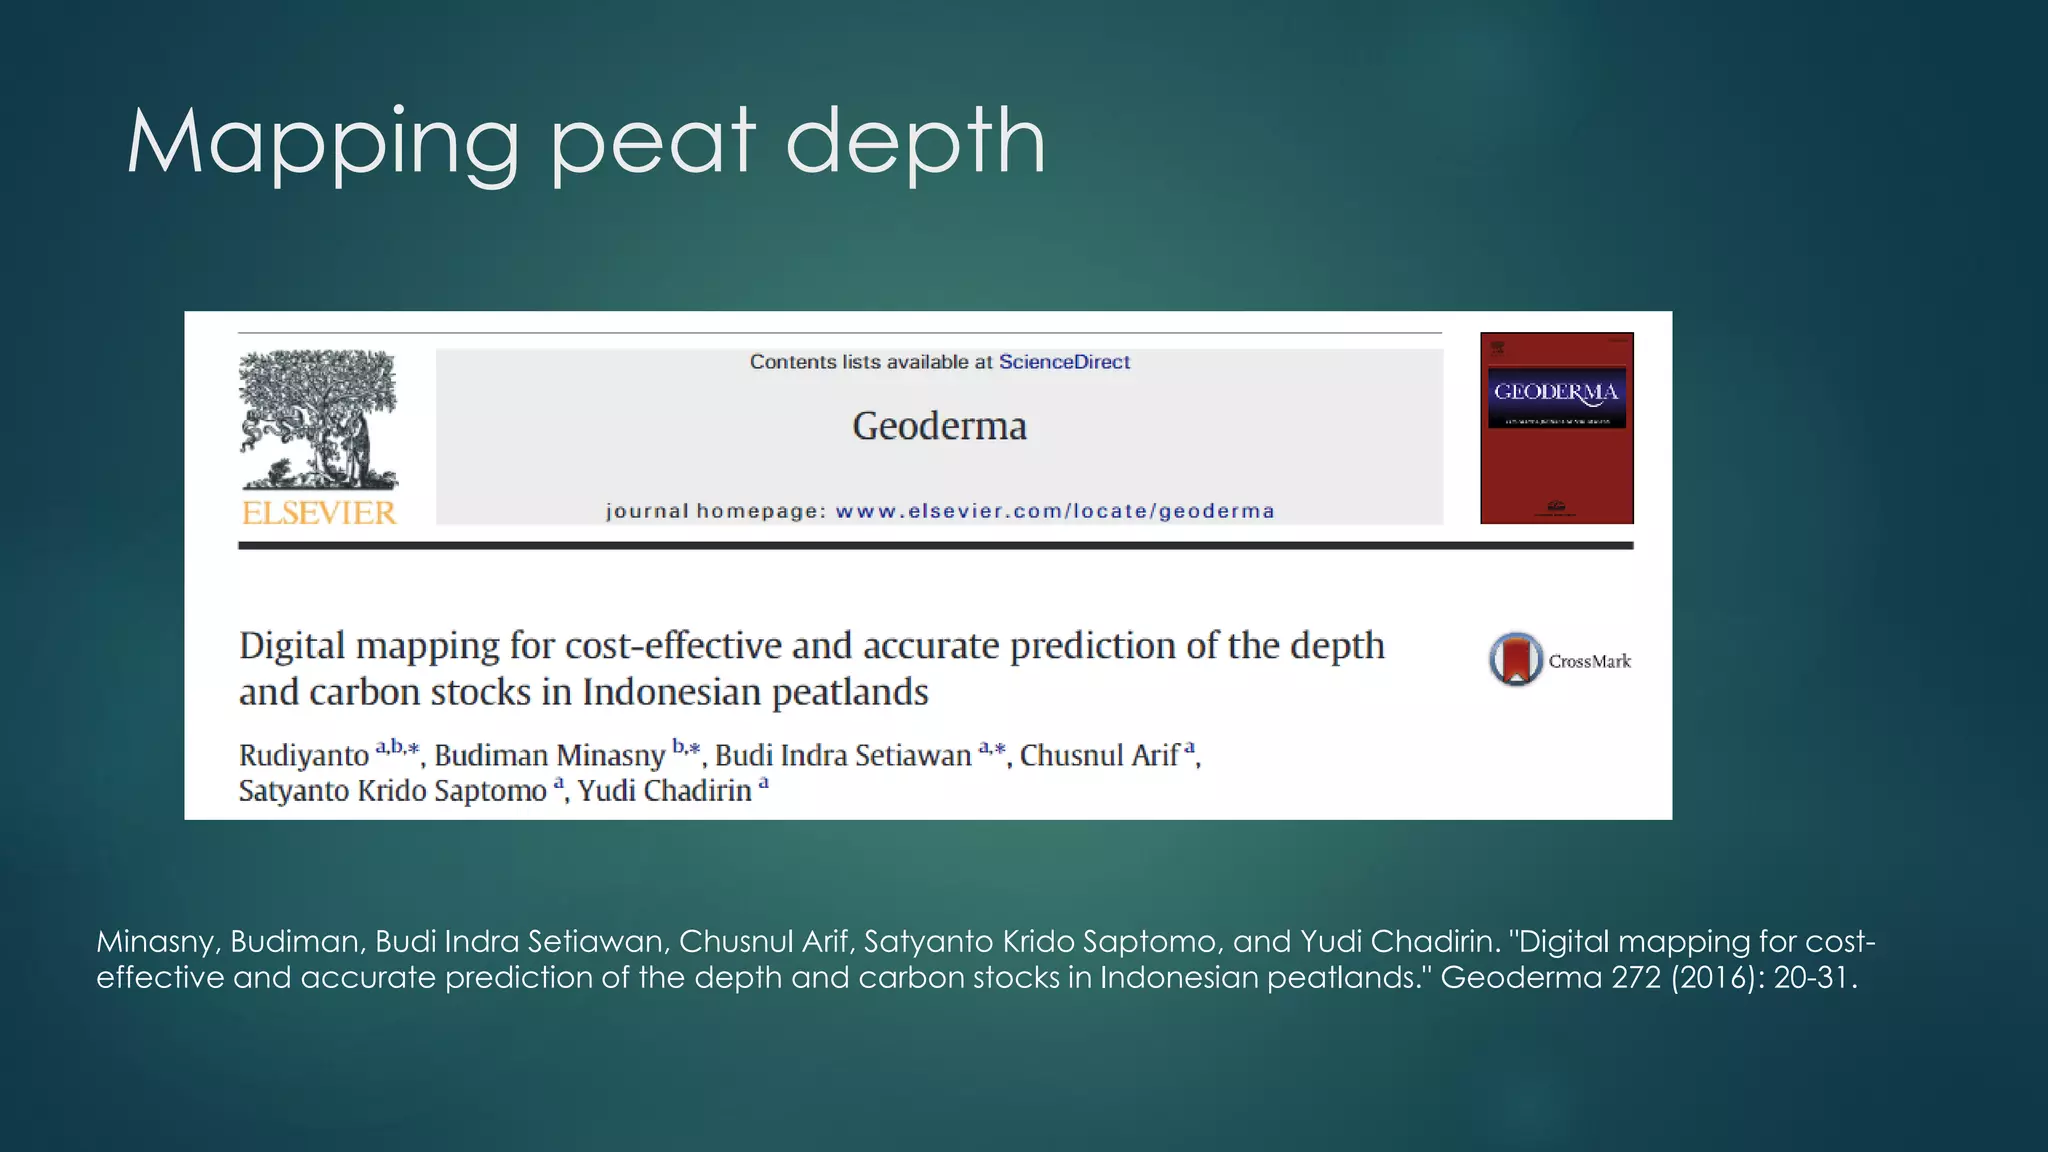
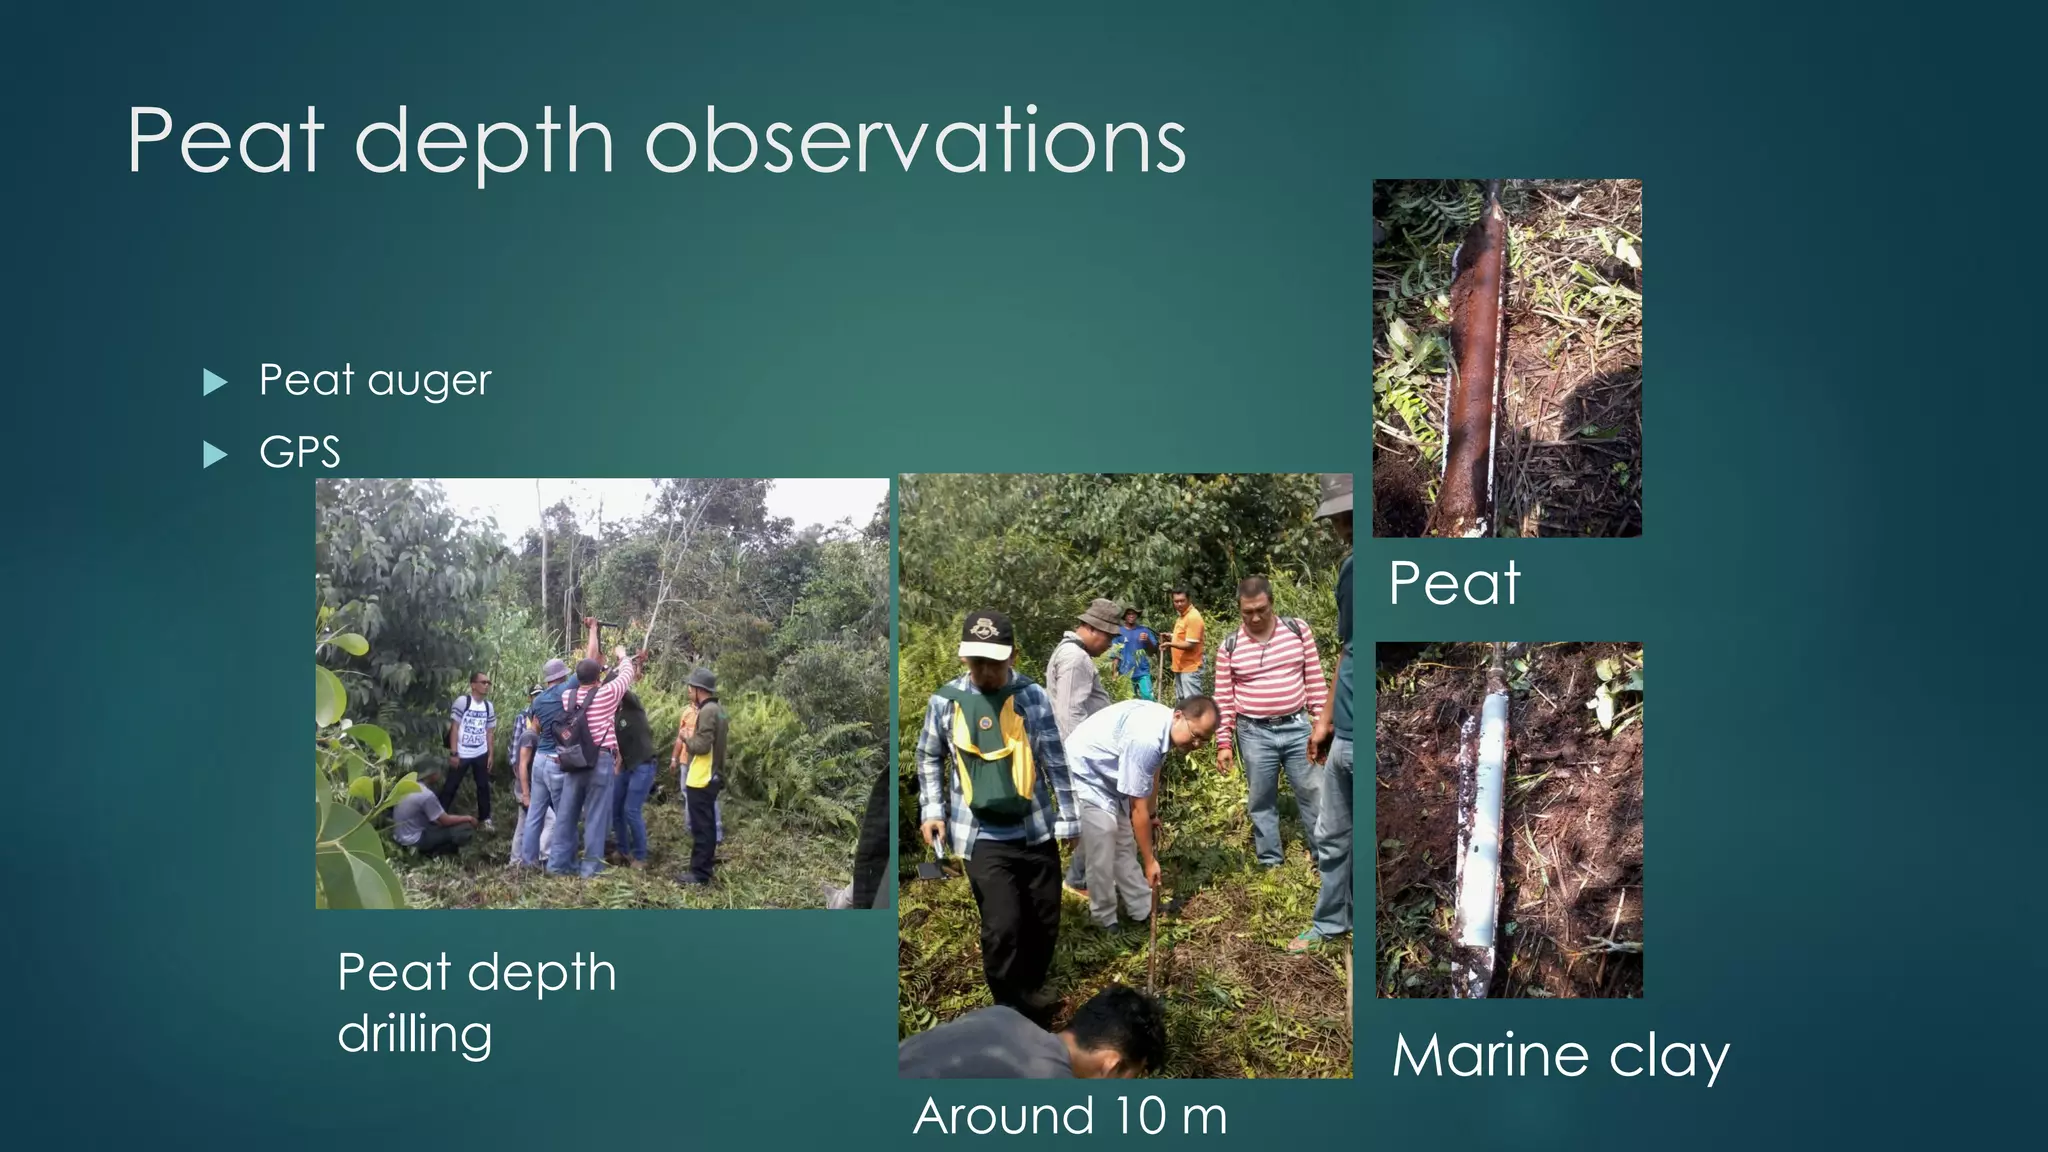
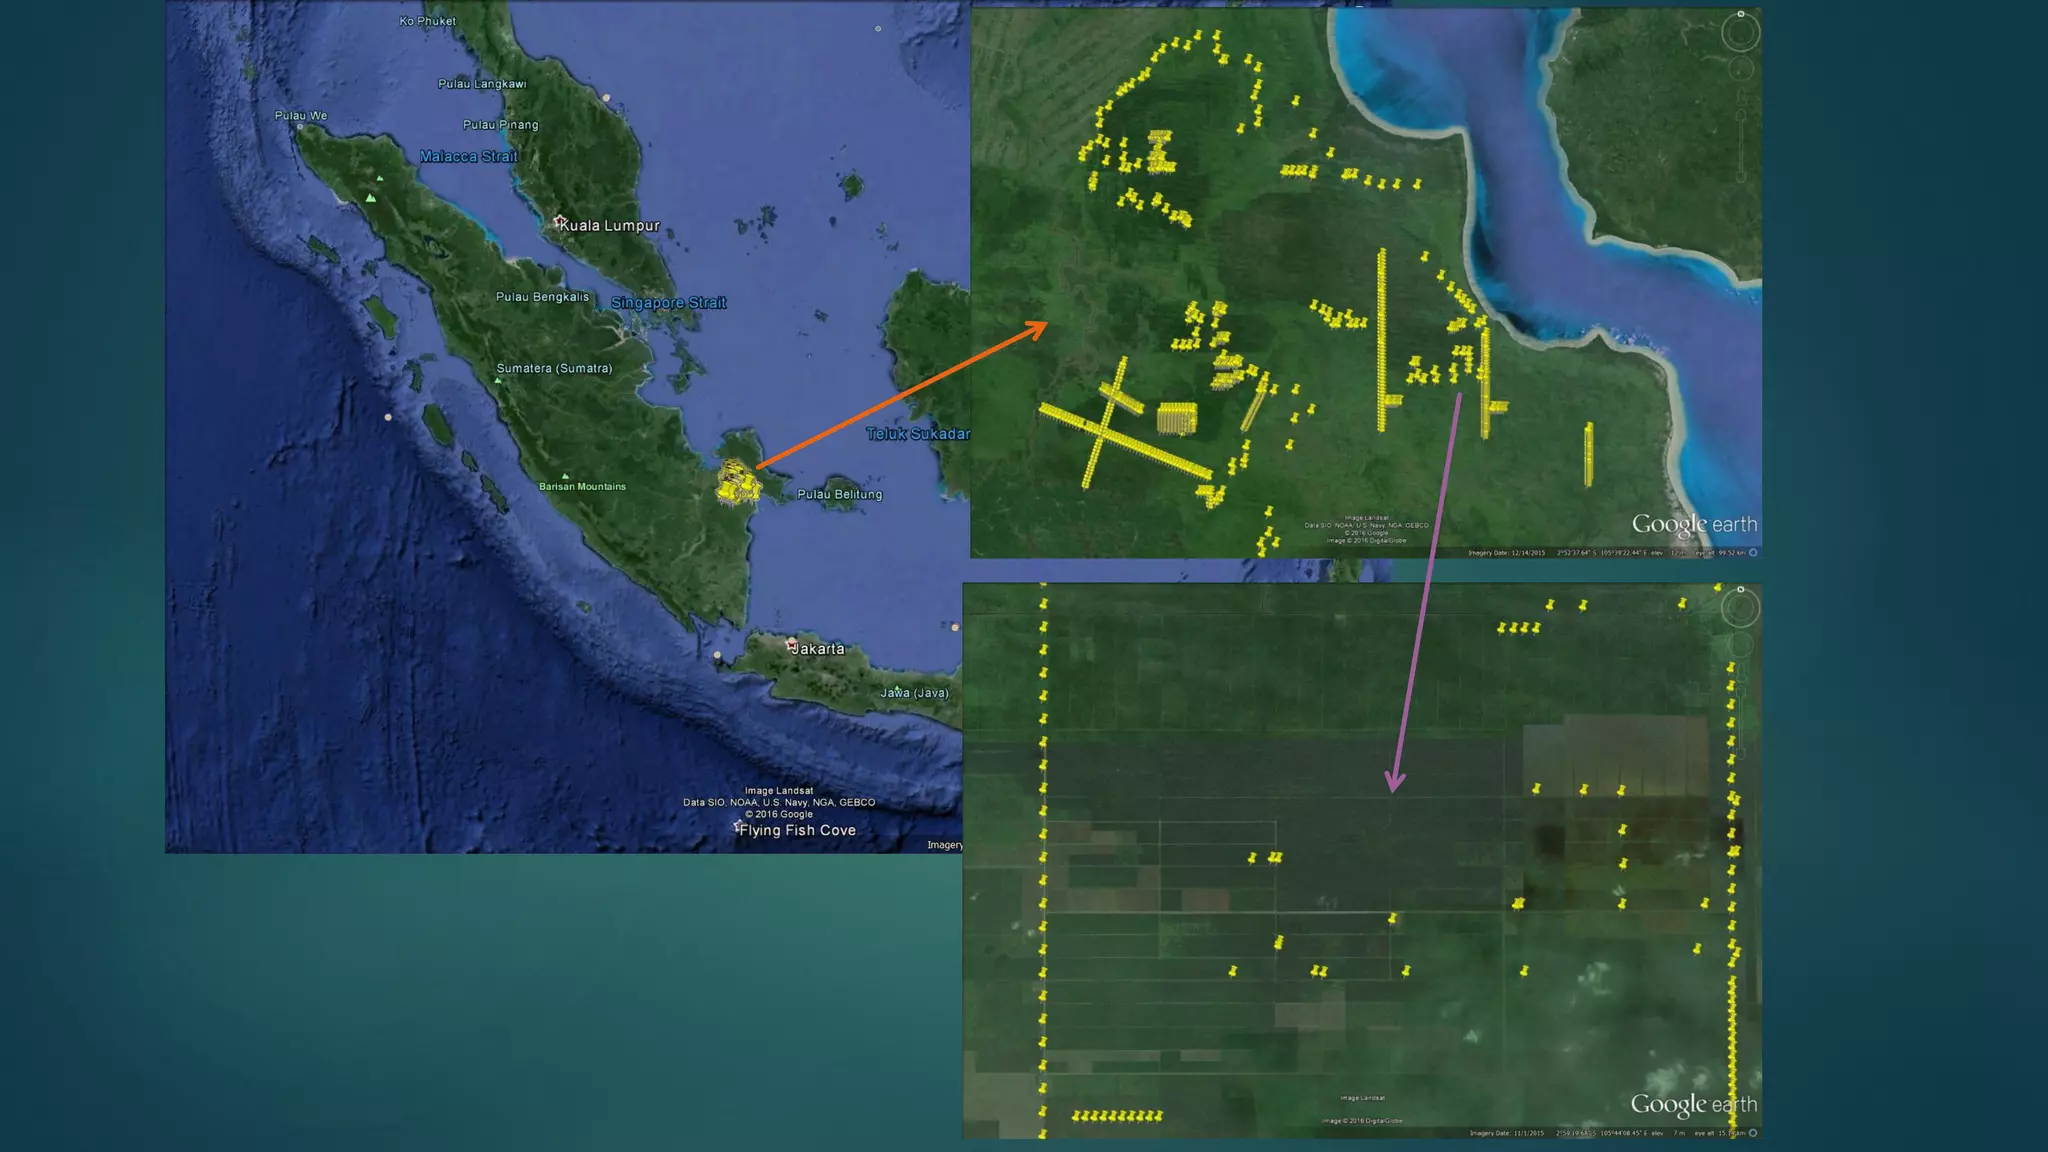
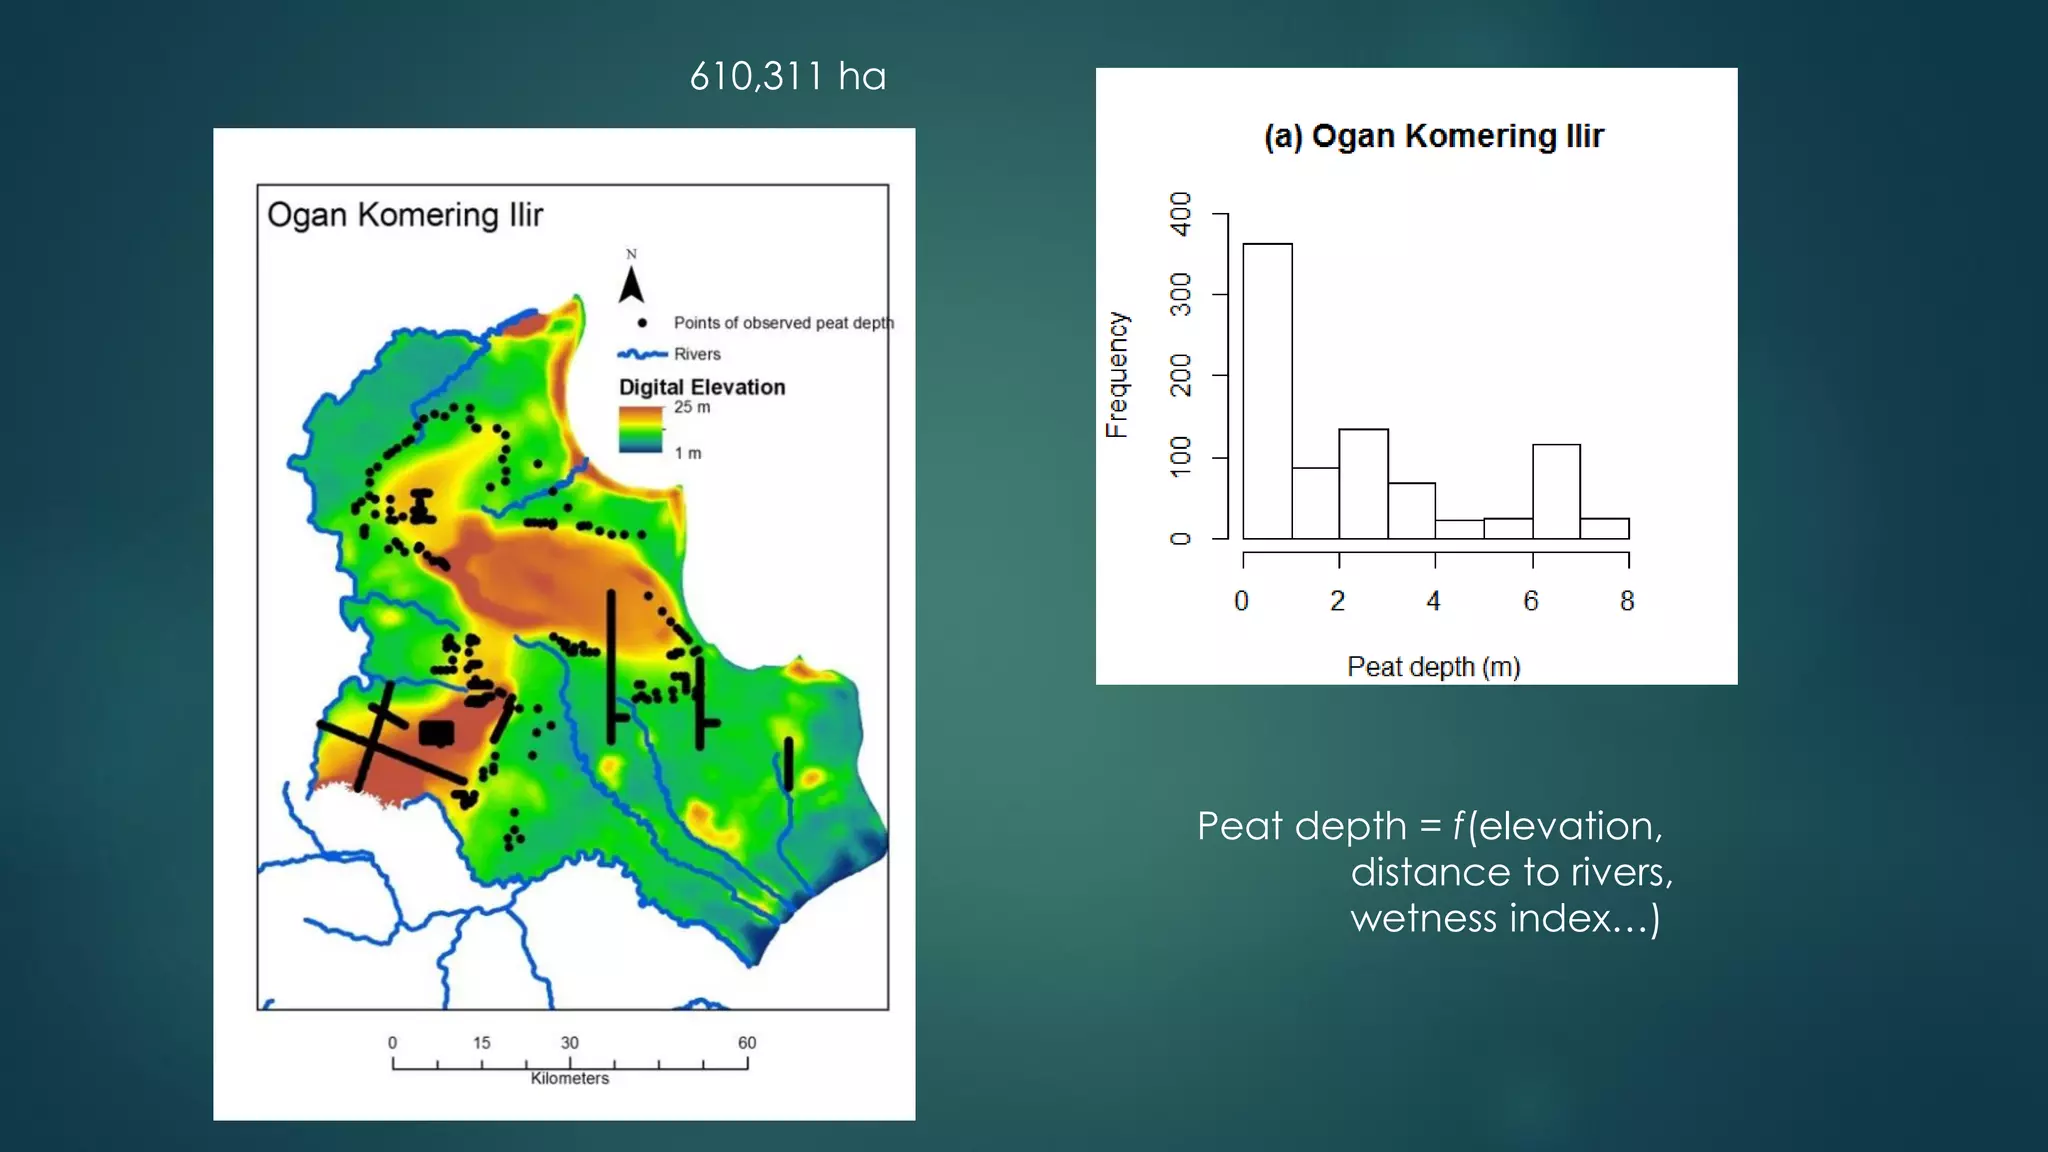
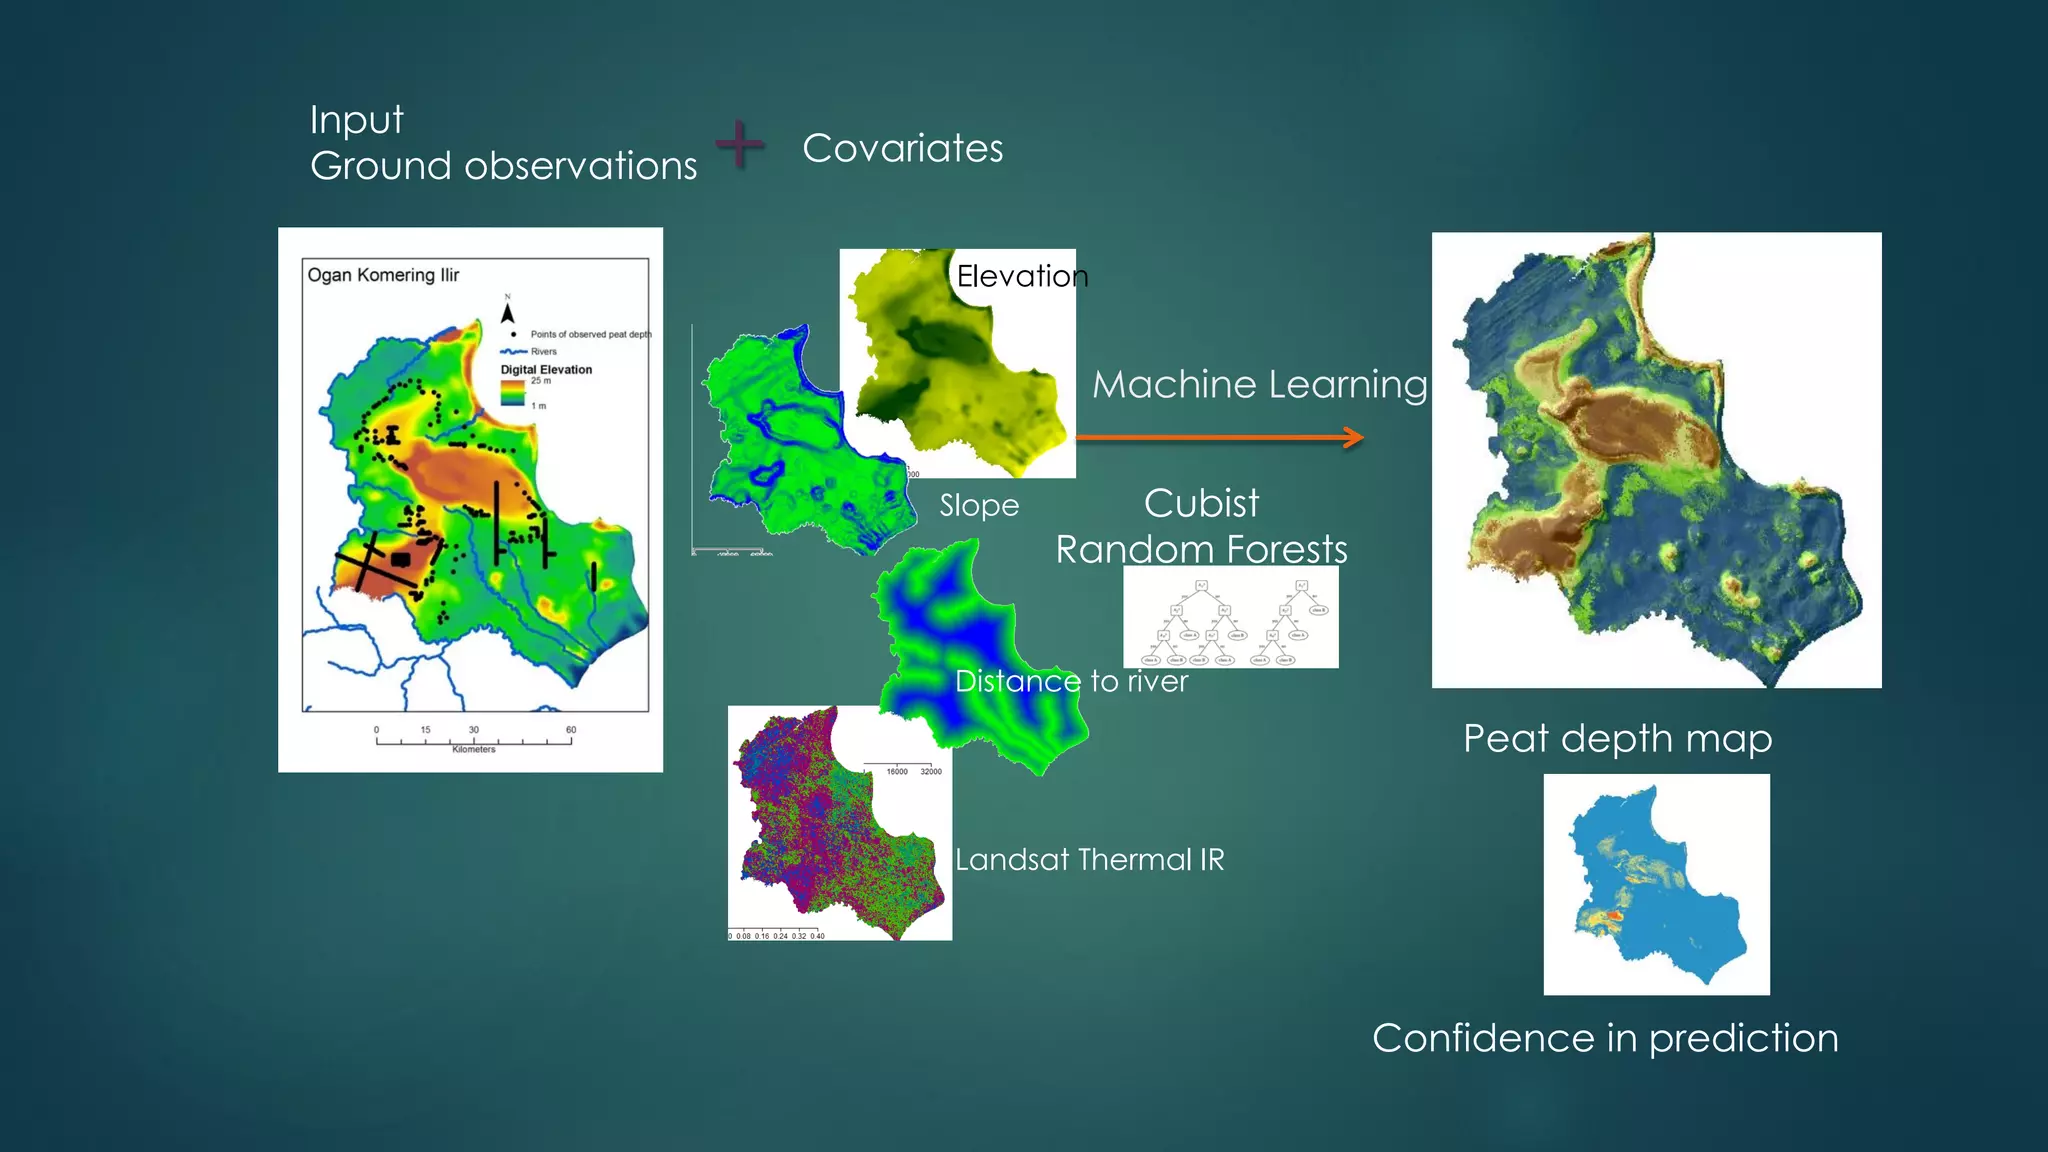
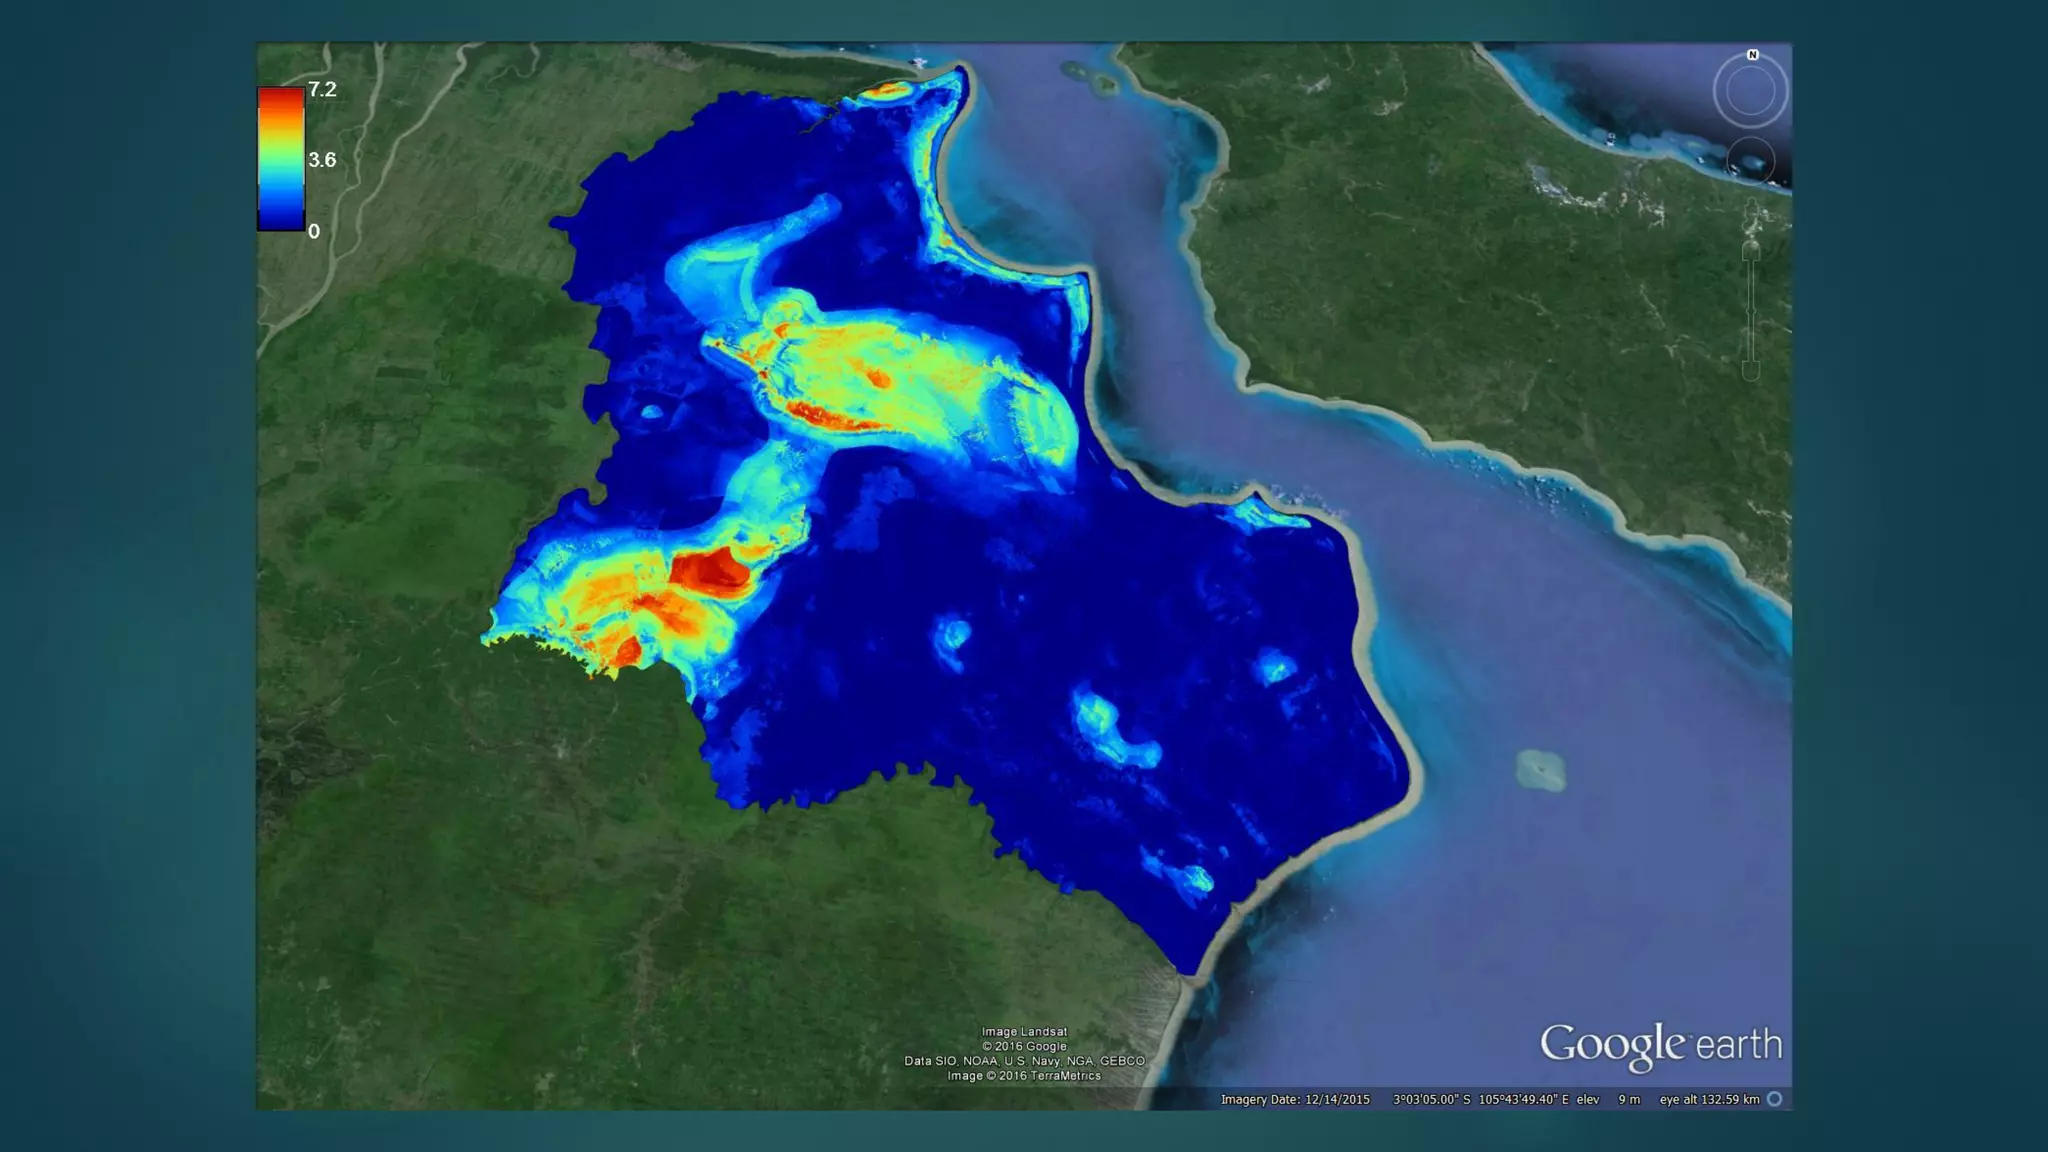
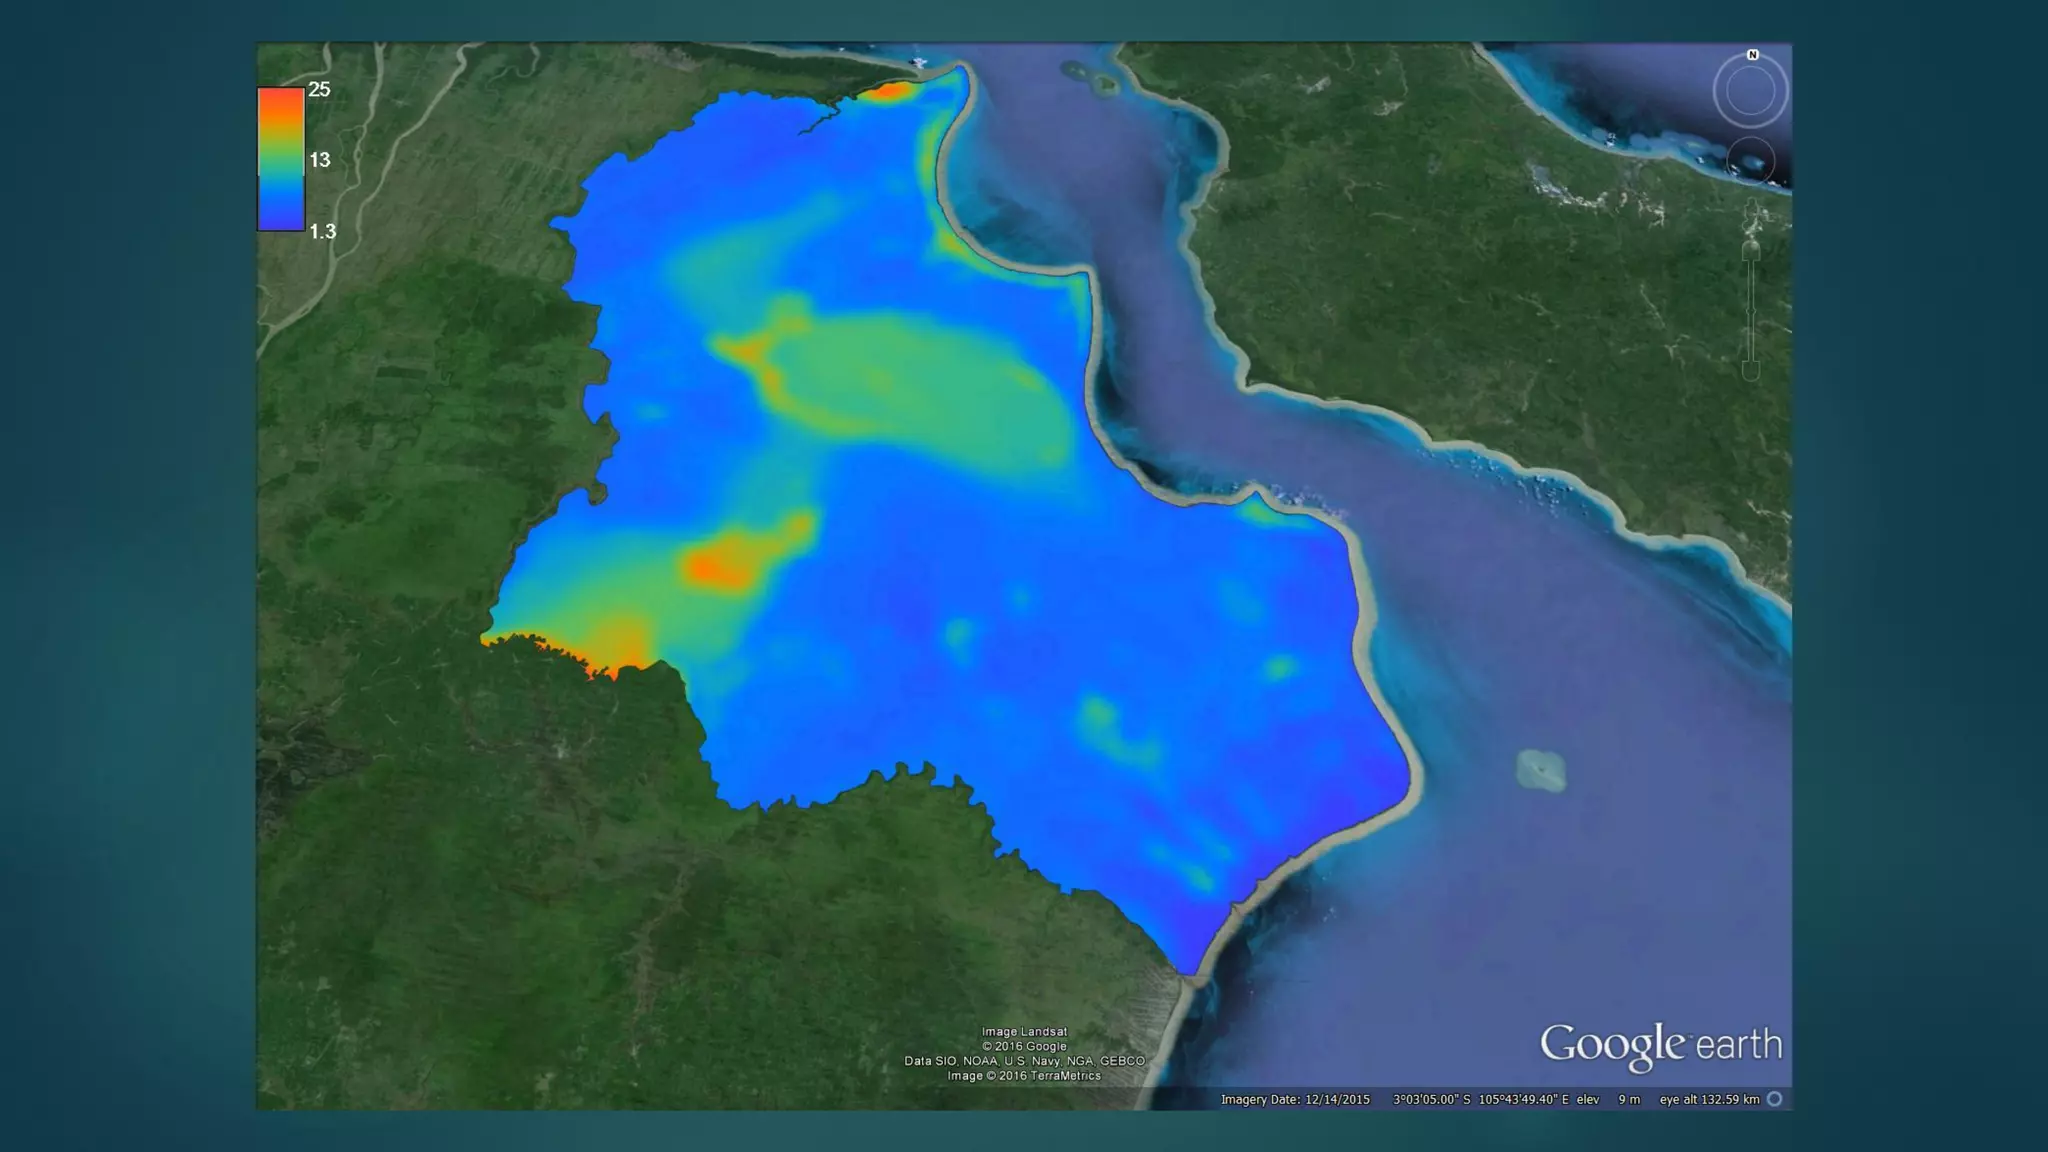
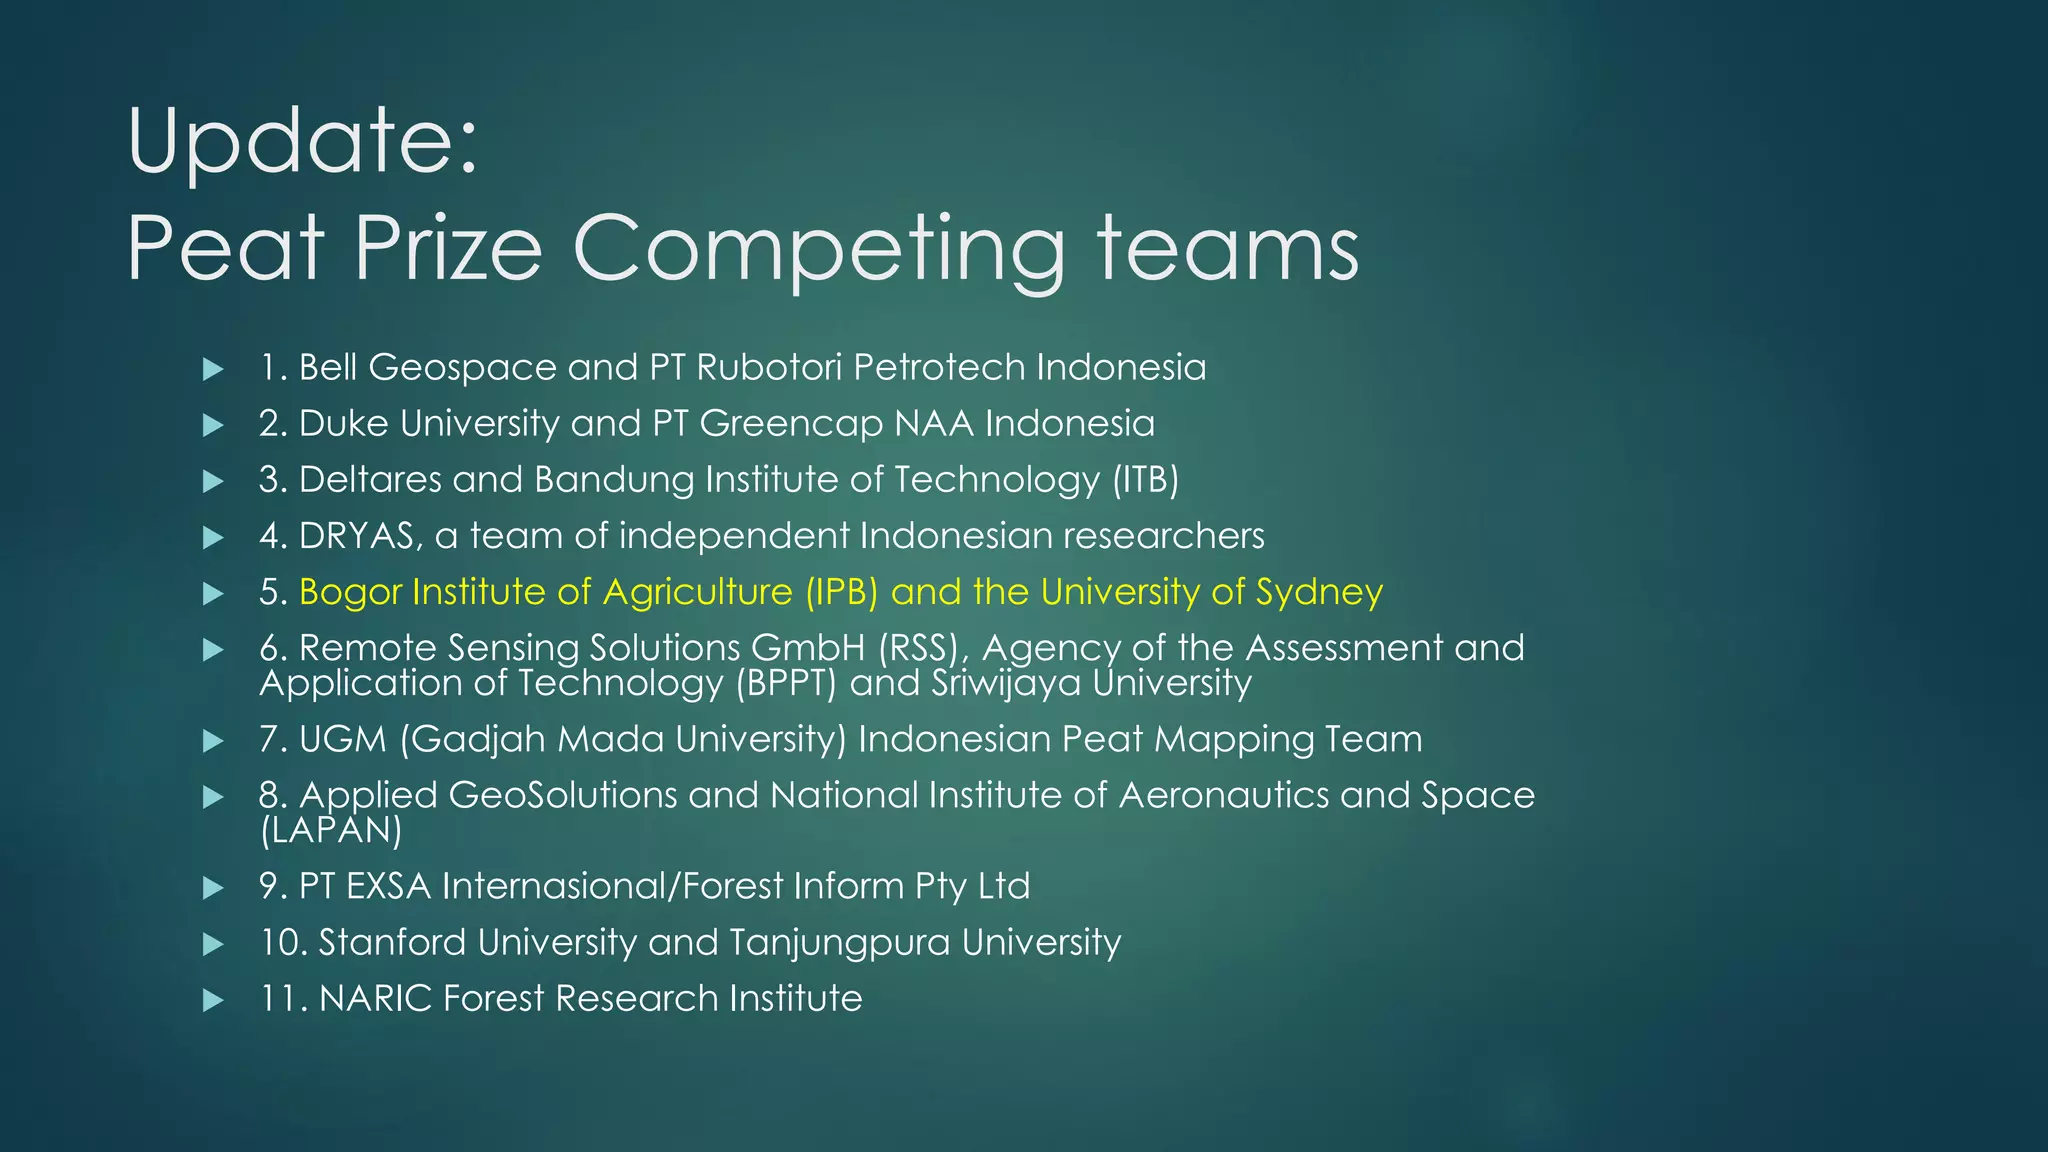

A million-dollar challenge is proposed to map Indonesian peatlands using digital soil mapping techniques, emphasizing the importance of peat depth and carbon stock assessments. The approach leverages remote sensing, machine learning, and field observations to create detailed peat maps cost-effectively. Several teams are competing in this initiative to improve the accuracy of peatland mapping in Indonesia.


