SlideShare a Scribd company logo
Books on Politics Network-
2004
Objective: To analyse a graphical
representation of a network
Coral reef
food web,
Cuba
233 vertices
3,753 edges
Data: http://datadryad.org/resource/doi:10.5061/dryad.c213h
Objective: To analyse a graphical
representation of a network
CMT111
Students,
Cardiff
26 vertices
30 edges
Objective: To analyse a graphical
representation of a network
Purchase of political books,
USA
105 vertices
441 edges
Data courtesy of Valdis Kreb available at: http://www-personal.umich.edu/~mejn/netdata/
Limitations
• Data limited: Number of purchases missing from
database, date of purchase, buyer data e.g.way voted
• No weights : Number of buyers who purchased both
books
• Mathematica’s definitions (hubs, k-cliques)
Mathematica
• Importing data
• Will not read as wide a variety of CSV formats as Gephi
• Can read .gml, .gv, .dot, .graphml, .gxl, .col, .g6, .s6, .gw, .net, .tgf
• Use Map or create a rule to show links (->) from one column of a CSV onto
another
• Other attributes
• More difficult to show vertex/edge attributes than in Gephi but still ppssiblt to
highlight using HighlightGraph[g, x]
• Built-in functions
• Very intuitive and well documented:
https://reference.wolfram.com/language/guide/GraphsAndNetworks.html
Book frequent purchase of both
books (endpoints) -
from Amazon ‘people who
bought this also bought’
NODE LINK
This graph is
unweighted: edges do not have associated weights
undirected: all edges travel in both directions
contains loops: no vertex is linked directly to itself
simple: undirected, unweighted, loop-free and lacks multiple edges
incomplete: each vertex is not connected to every other vertex
cyclic: contains at least one cycle
not bipartite: vertices cannot be divided into two disjoint sets
UndirectedGraphQ[books]
WeightedGraphQ[books]
CompleteGraphQ[books]
SimpleGraphQ[books]
BipartiteGraphQ[books]
LoopFreeGraphQ[books]
AcyclicGraphQ[books]
{6, 4, 4, 23, 8, 7, 11, 8, 25, 16, 15, 18, 25, 13, 9, 5, 3, 5, 3, 5, 10, 5, 7, 9, 9,
5, 9, 9, 3, 4, 20, 11, 5, 9, 5, 10, 5, 7, 7, 8, 18, 8, 6, 5, 5, 6, 4, 18, 4, 8, 3, 6,
5, 5, 6, 4, 4, 5, 13, 5, 6, 4, 6, 4, 9, 7, 21, 6, 4, 5, 7, 15, 22, 21, 16, 16, 13, 7,
5, 8, 4, 4, 9, 8, 23, 5, 14, 5, 5, 6, 5, 8, 3, 7, 7, 4, 6, 6, 5, 12, 12, 5, 4, 2, 3}
VertexDegree[books]
Vertex degrees:
Histogram[VertexDegree[books], ChartStyle -> Blue,
AxesLabel -> {HoldForm[Vertex degree], HoldForm[Frequency]},
PlotLabel -> None, LabelStyle -> {14, GrayLevel[0]}]
MatrixForm[GraphDistanceMatrix[books]]
Distance matrix
Array plot: distance matrix
ArrayPlot[GraphDistanceMatrix[books]]
Max[Flatten[GraphDistanceMatrix[books]]]
OR
GraphDiameter[books]
Diameter = 7
Radius = 4
GraphRadius[books]
Maximum and minimum eccentricities of any vertex:
Eccentricity Centrality
HighlightGraph[books, VertexList[books],
VertexSize ->
Thread[VertexList[books] ->
Rescale[EccentricityCentrality[books]]]]
Increases as maximum distances to every other reachable node increases
Closeness Centrality
HighlightGraph[books, VertexList[books],
VertexSize ->
Thread[VertexList[books] ->
Rescale[ClosenessCentrality[books]]]]
Increases as average distance to other nodes increases
Betweenness Centrality
HighlightGraph[books, VertexList[books],
VertexSize ->
Thread[VertexList[books] ->
Rescale[BetweennessCentrality[books]]]]
Increases as node lies on more shortest paths between other node-pairs
Degree Centrality
HighlightGraph[books, VertexList[books],
VertexSize ->
Thread[VertexList[books] ->
Rescale[DegreeCentrality[books]]]]
Increases as vertex degree increases
a = ListPlot[EccentricityCentrality[books], Filling -> Axis, PlotStyle -> Red]
b = ListPlot[ClosenessCentrality[books], Filling -> Axis, PlotStyle -> Magenta]
c = ListPlot[RadialityCentrality[books], Filling -> Axis, PlotStyle -> Cyan]
d = ListPlot[DegreeCentrality[books], Filling -> Axis]
gg = GraphicsGrid[{{a, b}, {c, d}}]
Export["CentralityGrid.png", gg]
Eccentricity Closeness
Radiality Degree
Dual Hub
HighlightGraph[books, GraphHub[books]]
Nodes with the highest vertex degree are returned
Hub Neighbours
HighlightGraph[books, NeighborhoodGraph[books, GraphHub[books]]]
CommunityGraphPlot[books]
Communities: Small world graph (Modular)
Graph partition:
minimises number of endpoints having edges in each part
HighlightGraph[books,FindGraphPartition[books]]
Graph communities:
maximises edges joining nodes within communities
with relatively fewer edges joining to nodes in other
communities
HighlightGraph[books, FindGraphCommunities[books]]
Centrality - showing bifurcation
partitioning based on edge centrality
CommunityGraphPlot[books, FindGraphCommunities[books, Method -> "Centrality"]]
ation - “Uncovering the overlapping community structure of comple
Finds largest k-
cliques first
then reduces k
CommunityGraphPlot[books, FindGraphCommunities[books, Method -> "CliquePercolation"]]
[1] Palla et al., Nature 435, 814-818 (2005)
Cliques
Largest set of connected vertices
HighlightGraph[books, Subgraph[books, FindClique[books]]]
Cliques
Largest set of connected vertices within 2 edges of each other
HighlightGraph[books, Subgraph[books, FindKClique[books, 2]]]
Cliques
Largest set of connected vertices within 3 edges of each other
HighlightGraph[books, Subgraph[books, FindKClique[books, 3]]]
Cliques
Largest set of connected vertices within 4 edges of each other
HighlightGraph[books, Subgraph[books, FindKClique[books, 4]]]
Cliques
Largest set of connected vertices within 5 edges of each other
HighlightGraph[books, Subgraph[books, FindKClique[books, 5]]]
Cliques
Largest set of connected vertices within 6 edges of each other
HighlightGraph[books, Subgraph[books, FindKClique[books, 6]]]
Cliques
Largest set of connected vertices within 7 (=diameter)
edges of each other
HighlightGraph[books, Subgraph[books, FindKClique[books, 7]]]
Lessons & Conclusions
• Mathematica Vs Gephi on Data Visualization
• Gephi struggles with larger datasets, crashes on OS X, cannot ‘undo’
• Gephi good a pulling apart larger datasets for easier visualisation, takes a wider range of
input formats, can visualise ‘multiple graphs’ more easily
• All the other functions within Mathematica at your disposal to aid network analysis e.g. Plot
• Source of Data Sets
• Working with a dataset of sufficient size but not so big that it cannot be comprehended.
• Analysis of sub-networks

More Related Content

Similar to Book buyer network

A new link based approach for categorical data clustering
A new link based approach for categorical data clusteringA new link based approach for categorical data clustering
A new link based approach for categorical data clustering
International Journal of Science and Research (IJSR)
 
Bba 2001
Bba 2001Bba 2001
Bba 2001
Monie Joey
 
Simplicial closure and simplicial diffusions
Simplicial closure and simplicial diffusionsSimplicial closure and simplicial diffusions
Simplicial closure and simplicial diffusions
Austin Benson
 
Engineering Data Science Objectives for Social Network Analysis
Engineering Data Science Objectives for Social Network AnalysisEngineering Data Science Objectives for Social Network Analysis
Engineering Data Science Objectives for Social Network Analysis
David Gleich
 
Network sampling, community detection
Network sampling, community detectionNetwork sampling, community detection
Network sampling, community detection
roberval mariano
 
105575916 maths-edit-new
105575916 maths-edit-new105575916 maths-edit-new
105575916 maths-edit-new
homeworkping7
 
Simplicial closure and higher-order link prediction (SIAMNS18)
Simplicial closure and higher-order link prediction (SIAMNS18)Simplicial closure and higher-order link prediction (SIAMNS18)
Simplicial closure and higher-order link prediction (SIAMNS18)
Austin Benson
 
Lx3520322036
Lx3520322036Lx3520322036
Lx3520322036
IJERA Editor
 
15857 cse422 unsupervised-learning
15857 cse422 unsupervised-learning15857 cse422 unsupervised-learning
15857 cse422 unsupervised-learning
Anil Yadav
 
GraphDatabases
GraphDatabasesGraphDatabases
GraphDatabases
Nader Albert
 
Introduction to graph databases in term of neo4j
Introduction to graph databases in term of neo4jIntroduction to graph databases in term of neo4j
Introduction to graph databases in term of neo4j
Abdullah Hamidi
 
Lec 3.pptx
Lec 3.pptxLec 3.pptx
Lec 3.pptx
AliAkbar99386
 
Group and Community Detection in Social Networks
Group and Community Detection in Social NetworksGroup and Community Detection in Social Networks
Group and Community Detection in Social Networks
Kent State University
 
Text clustering
Text clusteringText clustering
Text clustering
KU Leuven
 
Data Curation and Debugging for Data Centric AI
Data Curation and Debugging for Data Centric AIData Curation and Debugging for Data Centric AI
Data Curation and Debugging for Data Centric AI
Paul Groth
 
Cluster analysis using spss
Cluster analysis using spssCluster analysis using spss
Cluster analysis using spss
Dr Nisha Arora
 
Clustering techniques
Clustering techniquesClustering techniques
Clustering techniques
Learnbay Datascience
 
Gradoop: Scalable Graph Analytics with Apache Flink @ FOSDEM 2016
Gradoop: Scalable Graph Analytics with Apache Flink @ FOSDEM 2016Gradoop: Scalable Graph Analytics with Apache Flink @ FOSDEM 2016
Gradoop: Scalable Graph Analytics with Apache Flink @ FOSDEM 2016
Martin Junghanns
 
資料視覺化_透過Orange3進行_無須寫程式直接使用_碩士學程_202403.pdf
資料視覺化_透過Orange3進行_無須寫程式直接使用_碩士學程_202403.pdf資料視覺化_透過Orange3進行_無須寫程式直接使用_碩士學程_202403.pdf
資料視覺化_透過Orange3進行_無須寫程式直接使用_碩士學程_202403.pdf
FEG
 
Start From A MapReduce Graph Pattern-recognize Algorithm
Start From A MapReduce Graph Pattern-recognize AlgorithmStart From A MapReduce Graph Pattern-recognize Algorithm
Start From A MapReduce Graph Pattern-recognize Algorithm
Yu Liu
 

Similar to Book buyer network (20)

A new link based approach for categorical data clustering
A new link based approach for categorical data clusteringA new link based approach for categorical data clustering
A new link based approach for categorical data clustering
 
Bba 2001
Bba 2001Bba 2001
Bba 2001
 
Simplicial closure and simplicial diffusions
Simplicial closure and simplicial diffusionsSimplicial closure and simplicial diffusions
Simplicial closure and simplicial diffusions
 
Engineering Data Science Objectives for Social Network Analysis
Engineering Data Science Objectives for Social Network AnalysisEngineering Data Science Objectives for Social Network Analysis
Engineering Data Science Objectives for Social Network Analysis
 
Network sampling, community detection
Network sampling, community detectionNetwork sampling, community detection
Network sampling, community detection
 
105575916 maths-edit-new
105575916 maths-edit-new105575916 maths-edit-new
105575916 maths-edit-new
 
Simplicial closure and higher-order link prediction (SIAMNS18)
Simplicial closure and higher-order link prediction (SIAMNS18)Simplicial closure and higher-order link prediction (SIAMNS18)
Simplicial closure and higher-order link prediction (SIAMNS18)
 
Lx3520322036
Lx3520322036Lx3520322036
Lx3520322036
 
15857 cse422 unsupervised-learning
15857 cse422 unsupervised-learning15857 cse422 unsupervised-learning
15857 cse422 unsupervised-learning
 
GraphDatabases
GraphDatabasesGraphDatabases
GraphDatabases
 
Introduction to graph databases in term of neo4j
Introduction to graph databases in term of neo4jIntroduction to graph databases in term of neo4j
Introduction to graph databases in term of neo4j
 
Lec 3.pptx
Lec 3.pptxLec 3.pptx
Lec 3.pptx
 
Group and Community Detection in Social Networks
Group and Community Detection in Social NetworksGroup and Community Detection in Social Networks
Group and Community Detection in Social Networks
 
Text clustering
Text clusteringText clustering
Text clustering
 
Data Curation and Debugging for Data Centric AI
Data Curation and Debugging for Data Centric AIData Curation and Debugging for Data Centric AI
Data Curation and Debugging for Data Centric AI
 
Cluster analysis using spss
Cluster analysis using spssCluster analysis using spss
Cluster analysis using spss
 
Clustering techniques
Clustering techniquesClustering techniques
Clustering techniques
 
Gradoop: Scalable Graph Analytics with Apache Flink @ FOSDEM 2016
Gradoop: Scalable Graph Analytics with Apache Flink @ FOSDEM 2016Gradoop: Scalable Graph Analytics with Apache Flink @ FOSDEM 2016
Gradoop: Scalable Graph Analytics with Apache Flink @ FOSDEM 2016
 
資料視覺化_透過Orange3進行_無須寫程式直接使用_碩士學程_202403.pdf
資料視覺化_透過Orange3進行_無須寫程式直接使用_碩士學程_202403.pdf資料視覺化_透過Orange3進行_無須寫程式直接使用_碩士學程_202403.pdf
資料視覺化_透過Orange3進行_無須寫程式直接使用_碩士學程_202403.pdf
 
Start From A MapReduce Graph Pattern-recognize Algorithm
Start From A MapReduce Graph Pattern-recognize AlgorithmStart From A MapReduce Graph Pattern-recognize Algorithm
Start From A MapReduce Graph Pattern-recognize Algorithm
 

Recently uploaded

“Building and Scaling AI Applications with the Nx AI Manager,” a Presentation...
“Building and Scaling AI Applications with the Nx AI Manager,” a Presentation...“Building and Scaling AI Applications with the Nx AI Manager,” a Presentation...
“Building and Scaling AI Applications with the Nx AI Manager,” a Presentation...
Edge AI and Vision Alliance
 
Infrastructure Challenges in Scaling RAG with Custom AI models
Infrastructure Challenges in Scaling RAG with Custom AI modelsInfrastructure Challenges in Scaling RAG with Custom AI models
Infrastructure Challenges in Scaling RAG with Custom AI models
Zilliz
 
Serial Arm Control in Real Time Presentation
Serial Arm Control in Real Time PresentationSerial Arm Control in Real Time Presentation
Serial Arm Control in Real Time Presentation
tolgahangng
 
How to use Firebase Data Connect For Flutter
How to use Firebase Data Connect For FlutterHow to use Firebase Data Connect For Flutter
How to use Firebase Data Connect For Flutter
Daiki Mogmet Ito
 
GraphSummit Singapore | Enhancing Changi Airport Group's Passenger Experience...
GraphSummit Singapore | Enhancing Changi Airport Group's Passenger Experience...GraphSummit Singapore | Enhancing Changi Airport Group's Passenger Experience...
GraphSummit Singapore | Enhancing Changi Airport Group's Passenger Experience...
Neo4j
 
“I’m still / I’m still / Chaining from the Block”
“I’m still / I’m still / Chaining from the Block”“I’m still / I’m still / Chaining from the Block”
“I’m still / I’m still / Chaining from the Block”
Claudio Di Ciccio
 
Microsoft - Power Platform_G.Aspiotis.pdf
Microsoft - Power Platform_G.Aspiotis.pdfMicrosoft - Power Platform_G.Aspiotis.pdf
Microsoft - Power Platform_G.Aspiotis.pdf
Uni Systems S.M.S.A.
 
Presentation of the OECD Artificial Intelligence Review of Germany
Presentation of the OECD Artificial Intelligence Review of GermanyPresentation of the OECD Artificial Intelligence Review of Germany
Presentation of the OECD Artificial Intelligence Review of Germany
innovationoecd
 
Goodbye Windows 11: Make Way for Nitrux Linux 3.5.0!
Goodbye Windows 11: Make Way for Nitrux Linux 3.5.0!Goodbye Windows 11: Make Way for Nitrux Linux 3.5.0!
Goodbye Windows 11: Make Way for Nitrux Linux 3.5.0!
SOFTTECHHUB
 
Why You Should Replace Windows 11 with Nitrux Linux 3.5.0 for enhanced perfor...
Why You Should Replace Windows 11 with Nitrux Linux 3.5.0 for enhanced perfor...Why You Should Replace Windows 11 with Nitrux Linux 3.5.0 for enhanced perfor...
Why You Should Replace Windows 11 with Nitrux Linux 3.5.0 for enhanced perfor...
SOFTTECHHUB
 
Best 20 SEO Techniques To Improve Website Visibility In SERP
Best 20 SEO Techniques To Improve Website Visibility In SERPBest 20 SEO Techniques To Improve Website Visibility In SERP
Best 20 SEO Techniques To Improve Website Visibility In SERP
Pixlogix Infotech
 
Mariano G Tinti - Decoding SpaceX
Mariano G Tinti - Decoding SpaceXMariano G Tinti - Decoding SpaceX
Mariano G Tinti - Decoding SpaceX
Mariano Tinti
 
GraphSummit Singapore | The Art of the Possible with Graph - Q2 2024
GraphSummit Singapore | The Art of the  Possible with Graph - Q2 2024GraphSummit Singapore | The Art of the  Possible with Graph - Q2 2024
GraphSummit Singapore | The Art of the Possible with Graph - Q2 2024
Neo4j
 
Video Streaming: Then, Now, and in the Future
Video Streaming: Then, Now, and in the FutureVideo Streaming: Then, Now, and in the Future
Video Streaming: Then, Now, and in the Future
Alpen-Adria-Universität
 
Driving Business Innovation: Latest Generative AI Advancements & Success Story
Driving Business Innovation: Latest Generative AI Advancements & Success StoryDriving Business Innovation: Latest Generative AI Advancements & Success Story
Driving Business Innovation: Latest Generative AI Advancements & Success Story
Safe Software
 
GraphRAG for Life Science to increase LLM accuracy
GraphRAG for Life Science to increase LLM accuracyGraphRAG for Life Science to increase LLM accuracy
GraphRAG for Life Science to increase LLM accuracy
Tomaz Bratanic
 
20240609 QFM020 Irresponsible AI Reading List May 2024
20240609 QFM020 Irresponsible AI Reading List May 202420240609 QFM020 Irresponsible AI Reading List May 2024
20240609 QFM020 Irresponsible AI Reading List May 2024
Matthew Sinclair
 
HCL Notes und Domino Lizenzkostenreduzierung in der Welt von DLAU
HCL Notes und Domino Lizenzkostenreduzierung in der Welt von DLAUHCL Notes und Domino Lizenzkostenreduzierung in der Welt von DLAU
HCL Notes und Domino Lizenzkostenreduzierung in der Welt von DLAU
panagenda
 
How to Get CNIC Information System with Paksim Ga.pptx
How to Get CNIC Information System with Paksim Ga.pptxHow to Get CNIC Information System with Paksim Ga.pptx
How to Get CNIC Information System with Paksim Ga.pptx
danishmna97
 
Uni Systems Copilot event_05062024_C.Vlachos.pdf
Uni Systems Copilot event_05062024_C.Vlachos.pdfUni Systems Copilot event_05062024_C.Vlachos.pdf
Uni Systems Copilot event_05062024_C.Vlachos.pdf
Uni Systems S.M.S.A.
 

Recently uploaded (20)

“Building and Scaling AI Applications with the Nx AI Manager,” a Presentation...
“Building and Scaling AI Applications with the Nx AI Manager,” a Presentation...“Building and Scaling AI Applications with the Nx AI Manager,” a Presentation...
“Building and Scaling AI Applications with the Nx AI Manager,” a Presentation...
 
Infrastructure Challenges in Scaling RAG with Custom AI models
Infrastructure Challenges in Scaling RAG with Custom AI modelsInfrastructure Challenges in Scaling RAG with Custom AI models
Infrastructure Challenges in Scaling RAG with Custom AI models
 
Serial Arm Control in Real Time Presentation
Serial Arm Control in Real Time PresentationSerial Arm Control in Real Time Presentation
Serial Arm Control in Real Time Presentation
 
How to use Firebase Data Connect For Flutter
How to use Firebase Data Connect For FlutterHow to use Firebase Data Connect For Flutter
How to use Firebase Data Connect For Flutter
 
GraphSummit Singapore | Enhancing Changi Airport Group's Passenger Experience...
GraphSummit Singapore | Enhancing Changi Airport Group's Passenger Experience...GraphSummit Singapore | Enhancing Changi Airport Group's Passenger Experience...
GraphSummit Singapore | Enhancing Changi Airport Group's Passenger Experience...
 
“I’m still / I’m still / Chaining from the Block”
“I’m still / I’m still / Chaining from the Block”“I’m still / I’m still / Chaining from the Block”
“I’m still / I’m still / Chaining from the Block”
 
Microsoft - Power Platform_G.Aspiotis.pdf
Microsoft - Power Platform_G.Aspiotis.pdfMicrosoft - Power Platform_G.Aspiotis.pdf
Microsoft - Power Platform_G.Aspiotis.pdf
 
Presentation of the OECD Artificial Intelligence Review of Germany
Presentation of the OECD Artificial Intelligence Review of GermanyPresentation of the OECD Artificial Intelligence Review of Germany
Presentation of the OECD Artificial Intelligence Review of Germany
 
Goodbye Windows 11: Make Way for Nitrux Linux 3.5.0!
Goodbye Windows 11: Make Way for Nitrux Linux 3.5.0!Goodbye Windows 11: Make Way for Nitrux Linux 3.5.0!
Goodbye Windows 11: Make Way for Nitrux Linux 3.5.0!
 
Why You Should Replace Windows 11 with Nitrux Linux 3.5.0 for enhanced perfor...
Why You Should Replace Windows 11 with Nitrux Linux 3.5.0 for enhanced perfor...Why You Should Replace Windows 11 with Nitrux Linux 3.5.0 for enhanced perfor...
Why You Should Replace Windows 11 with Nitrux Linux 3.5.0 for enhanced perfor...
 
Best 20 SEO Techniques To Improve Website Visibility In SERP
Best 20 SEO Techniques To Improve Website Visibility In SERPBest 20 SEO Techniques To Improve Website Visibility In SERP
Best 20 SEO Techniques To Improve Website Visibility In SERP
 
Mariano G Tinti - Decoding SpaceX
Mariano G Tinti - Decoding SpaceXMariano G Tinti - Decoding SpaceX
Mariano G Tinti - Decoding SpaceX
 
GraphSummit Singapore | The Art of the Possible with Graph - Q2 2024
GraphSummit Singapore | The Art of the  Possible with Graph - Q2 2024GraphSummit Singapore | The Art of the  Possible with Graph - Q2 2024
GraphSummit Singapore | The Art of the Possible with Graph - Q2 2024
 
Video Streaming: Then, Now, and in the Future
Video Streaming: Then, Now, and in the FutureVideo Streaming: Then, Now, and in the Future
Video Streaming: Then, Now, and in the Future
 
Driving Business Innovation: Latest Generative AI Advancements & Success Story
Driving Business Innovation: Latest Generative AI Advancements & Success StoryDriving Business Innovation: Latest Generative AI Advancements & Success Story
Driving Business Innovation: Latest Generative AI Advancements & Success Story
 
GraphRAG for Life Science to increase LLM accuracy
GraphRAG for Life Science to increase LLM accuracyGraphRAG for Life Science to increase LLM accuracy
GraphRAG for Life Science to increase LLM accuracy
 
20240609 QFM020 Irresponsible AI Reading List May 2024
20240609 QFM020 Irresponsible AI Reading List May 202420240609 QFM020 Irresponsible AI Reading List May 2024
20240609 QFM020 Irresponsible AI Reading List May 2024
 
HCL Notes und Domino Lizenzkostenreduzierung in der Welt von DLAU
HCL Notes und Domino Lizenzkostenreduzierung in der Welt von DLAUHCL Notes und Domino Lizenzkostenreduzierung in der Welt von DLAU
HCL Notes und Domino Lizenzkostenreduzierung in der Welt von DLAU
 
How to Get CNIC Information System with Paksim Ga.pptx
How to Get CNIC Information System with Paksim Ga.pptxHow to Get CNIC Information System with Paksim Ga.pptx
How to Get CNIC Information System with Paksim Ga.pptx
 
Uni Systems Copilot event_05062024_C.Vlachos.pdf
Uni Systems Copilot event_05062024_C.Vlachos.pdfUni Systems Copilot event_05062024_C.Vlachos.pdf
Uni Systems Copilot event_05062024_C.Vlachos.pdf
 

Book buyer network

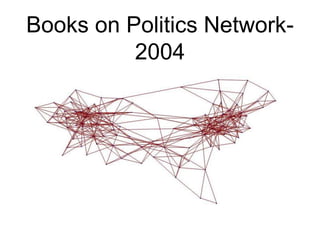
  • 1. Books on Politics Network- 2004
  • 2. Objective: To analyse a graphical representation of a network Coral reef food web, Cuba 233 vertices 3,753 edges Data: http://datadryad.org/resource/doi:10.5061/dryad.c213h
  • 3. Objective: To analyse a graphical representation of a network CMT111 Students, Cardiff 26 vertices 30 edges
  • 4. Objective: To analyse a graphical representation of a network Purchase of political books, USA 105 vertices 441 edges Data courtesy of Valdis Kreb available at: http://www-personal.umich.edu/~mejn/netdata/
  • 5. Limitations • Data limited: Number of purchases missing from database, date of purchase, buyer data e.g.way voted • No weights : Number of buyers who purchased both books • Mathematica’s definitions (hubs, k-cliques)
  • 6. Mathematica • Importing data • Will not read as wide a variety of CSV formats as Gephi • Can read .gml, .gv, .dot, .graphml, .gxl, .col, .g6, .s6, .gw, .net, .tgf • Use Map or create a rule to show links (->) from one column of a CSV onto another • Other attributes • More difficult to show vertex/edge attributes than in Gephi but still ppssiblt to highlight using HighlightGraph[g, x] • Built-in functions • Very intuitive and well documented: https://reference.wolfram.com/language/guide/GraphsAndNetworks.html
  • 7. Book frequent purchase of both books (endpoints) - from Amazon ‘people who bought this also bought’ NODE LINK
  • 8. This graph is unweighted: edges do not have associated weights undirected: all edges travel in both directions contains loops: no vertex is linked directly to itself simple: undirected, unweighted, loop-free and lacks multiple edges incomplete: each vertex is not connected to every other vertex cyclic: contains at least one cycle not bipartite: vertices cannot be divided into two disjoint sets UndirectedGraphQ[books] WeightedGraphQ[books] CompleteGraphQ[books] SimpleGraphQ[books] BipartiteGraphQ[books] LoopFreeGraphQ[books] AcyclicGraphQ[books]
  • 9. {6, 4, 4, 23, 8, 7, 11, 8, 25, 16, 15, 18, 25, 13, 9, 5, 3, 5, 3, 5, 10, 5, 7, 9, 9, 5, 9, 9, 3, 4, 20, 11, 5, 9, 5, 10, 5, 7, 7, 8, 18, 8, 6, 5, 5, 6, 4, 18, 4, 8, 3, 6, 5, 5, 6, 4, 4, 5, 13, 5, 6, 4, 6, 4, 9, 7, 21, 6, 4, 5, 7, 15, 22, 21, 16, 16, 13, 7, 5, 8, 4, 4, 9, 8, 23, 5, 14, 5, 5, 6, 5, 8, 3, 7, 7, 4, 6, 6, 5, 12, 12, 5, 4, 2, 3} VertexDegree[books] Vertex degrees: Histogram[VertexDegree[books], ChartStyle -> Blue, AxesLabel -> {HoldForm[Vertex degree], HoldForm[Frequency]}, PlotLabel -> None, LabelStyle -> {14, GrayLevel[0]}]
  • 11. Array plot: distance matrix ArrayPlot[GraphDistanceMatrix[books]]
  • 12. Max[Flatten[GraphDistanceMatrix[books]]] OR GraphDiameter[books] Diameter = 7 Radius = 4 GraphRadius[books] Maximum and minimum eccentricities of any vertex:
  • 13. Eccentricity Centrality HighlightGraph[books, VertexList[books], VertexSize -> Thread[VertexList[books] -> Rescale[EccentricityCentrality[books]]]] Increases as maximum distances to every other reachable node increases
  • 14. Closeness Centrality HighlightGraph[books, VertexList[books], VertexSize -> Thread[VertexList[books] -> Rescale[ClosenessCentrality[books]]]] Increases as average distance to other nodes increases
  • 15. Betweenness Centrality HighlightGraph[books, VertexList[books], VertexSize -> Thread[VertexList[books] -> Rescale[BetweennessCentrality[books]]]] Increases as node lies on more shortest paths between other node-pairs
  • 16. Degree Centrality HighlightGraph[books, VertexList[books], VertexSize -> Thread[VertexList[books] -> Rescale[DegreeCentrality[books]]]] Increases as vertex degree increases
  • 17. a = ListPlot[EccentricityCentrality[books], Filling -> Axis, PlotStyle -> Red] b = ListPlot[ClosenessCentrality[books], Filling -> Axis, PlotStyle -> Magenta] c = ListPlot[RadialityCentrality[books], Filling -> Axis, PlotStyle -> Cyan] d = ListPlot[DegreeCentrality[books], Filling -> Axis] gg = GraphicsGrid[{{a, b}, {c, d}}] Export["CentralityGrid.png", gg] Eccentricity Closeness Radiality Degree
  • 18. Dual Hub HighlightGraph[books, GraphHub[books]] Nodes with the highest vertex degree are returned
  • 21. Graph partition: minimises number of endpoints having edges in each part HighlightGraph[books,FindGraphPartition[books]]
  • 22. Graph communities: maximises edges joining nodes within communities with relatively fewer edges joining to nodes in other communities HighlightGraph[books, FindGraphCommunities[books]]
  • 23. Centrality - showing bifurcation partitioning based on edge centrality CommunityGraphPlot[books, FindGraphCommunities[books, Method -> "Centrality"]]
  • 24. ation - “Uncovering the overlapping community structure of comple Finds largest k- cliques first then reduces k CommunityGraphPlot[books, FindGraphCommunities[books, Method -> "CliquePercolation"]] [1] Palla et al., Nature 435, 814-818 (2005)
  • 25. Cliques Largest set of connected vertices HighlightGraph[books, Subgraph[books, FindClique[books]]]
  • 26. Cliques Largest set of connected vertices within 2 edges of each other HighlightGraph[books, Subgraph[books, FindKClique[books, 2]]]
  • 27. Cliques Largest set of connected vertices within 3 edges of each other HighlightGraph[books, Subgraph[books, FindKClique[books, 3]]]
  • 28. Cliques Largest set of connected vertices within 4 edges of each other HighlightGraph[books, Subgraph[books, FindKClique[books, 4]]]
  • 29. Cliques Largest set of connected vertices within 5 edges of each other HighlightGraph[books, Subgraph[books, FindKClique[books, 5]]]
  • 30. Cliques Largest set of connected vertices within 6 edges of each other HighlightGraph[books, Subgraph[books, FindKClique[books, 6]]]
  • 31. Cliques Largest set of connected vertices within 7 (=diameter) edges of each other HighlightGraph[books, Subgraph[books, FindKClique[books, 7]]]
  • 32. Lessons & Conclusions • Mathematica Vs Gephi on Data Visualization • Gephi struggles with larger datasets, crashes on OS X, cannot ‘undo’ • Gephi good a pulling apart larger datasets for easier visualisation, takes a wider range of input formats, can visualise ‘multiple graphs’ more easily • All the other functions within Mathematica at your disposal to aid network analysis e.g. Plot • Source of Data Sets • Working with a dataset of sufficient size but not so big that it cannot be comprehended. • Analysis of sub-networks