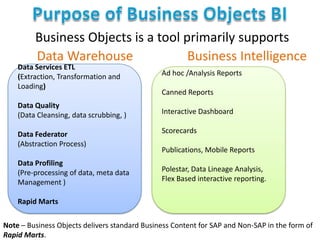
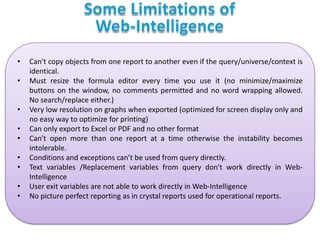
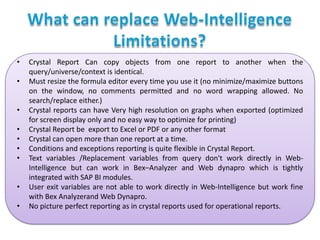
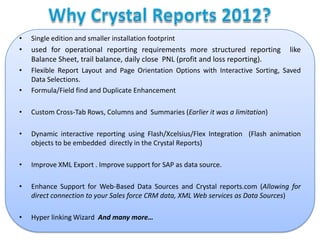
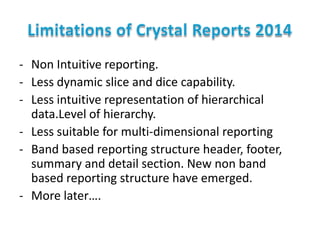
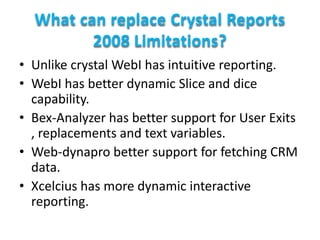
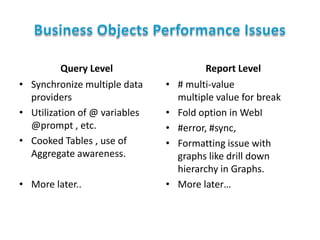
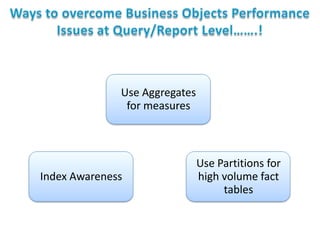
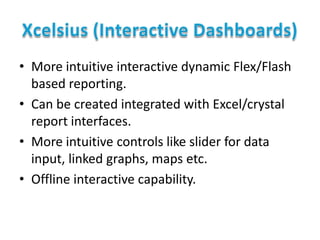
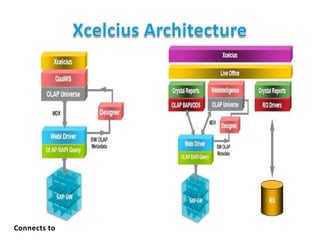
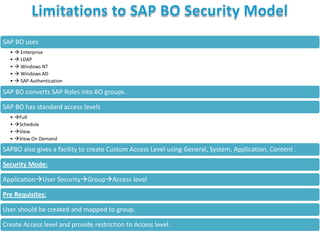
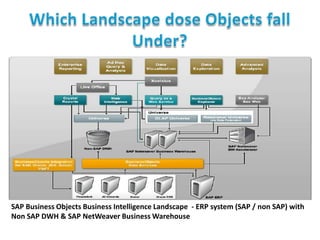
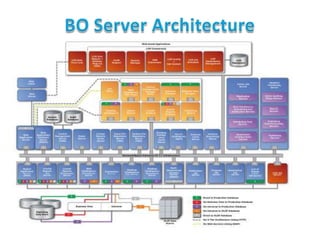
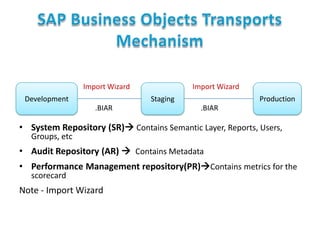
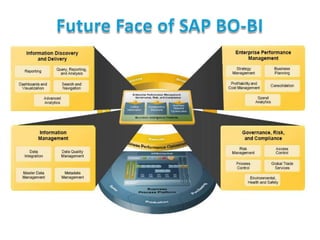
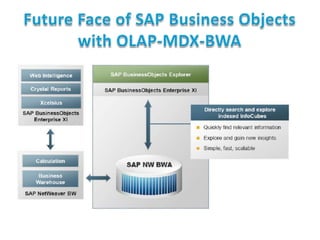
Overview SAP BO components, SAP BO Architecture, 16 reporting flavour of SAP BO,
More details: (blog: http://sandyclassic.wordpress.com ,
linkedin: https://www.linkedin.com/in/sandepsharma )
The presentation discusses the different aspects of Power BI like Power BI for O365, Data Discovery, Data Analysis, Data Visualization & Power Maps, Natural Language Search etc.
Its a business analytics solution presented by Netwoven at the Microsoft Power BI workshop held on Oct 30th at SVC Microsoft, Mountain View.
Configuring SharePoint 2013 for BI scenariosSPC Adriatics
Configuring SharePoint 2013 for BI is not just clicking next in the configuration wizard but it needs some special attention with configuring service applications and of course we cannot forget about configuring Kerberos delegation.
We take a look at configuring PerformancePoint, PowerPivot, Reporting Services in SharePoint integrated mode and everything you need to know to successfully configure BI services.
The Power of BI: A guided tour of Microsoft's Business Intelligence toolingJason Himmelstein
Having trouble keeping up with all of the changes in the BI space around SharePoint & Office 365? Feel like every time you think you understand what is going on Microsoft pivots (pun intended) yet again? You are not alone.
Now is the time to change all of that. Microsoft is investing heavily in how to make BI more efficient, repeatable, and with outputs that will make executives squeal with delight. From Excel to Power BI, the tooling is evolving so quickly that it takes real effort to keep up.
Power BI Report Server: a Deep Dive for PASS Business Analytics Virtual GroupLuca Gualtieri
Session Outline:
The presentation is for users who are familiar with the Power BI Report Server (PBIRS), are interested in more advanced topics, and want to go the extra mile.
In this presentation we are going to discuss basic topics including:
Different editions / licensing for PBIRS
Branding for PBIRS
Configuring Advanced Options through SSMS (SQL Server Management Studio)
Embedding PBIRS reports
Monitoring the Report Server catalog
Using the REST-API
PBIRS security, and
Custom roles in PBIRS.
We will also touch on more advanced concepts such as:
High availability
Disaster recovery, and
Configuring your report server to host Excel workbooks using Office Online Server.
Power BI Report Server: a Deep Dive for PBIUG VancouverLuca Gualtieri
Session Outline:
The presentation is for users who are familiar with the Power BI Report Server (PBIRS), are interested in more advanced topics, and want to go the extra mile.
In this presentation we are going to discuss basic topics including:
Different editions / licensing for PBIRS
Branding for PBIRS
Configuring Advanced Options through SSMS (SQL Server Management Studio)
Embedding PBIRS reports
Monitoring the Report Server catalog
Using the REST-API
PBIRS security, and
Custom roles in PBIRS.
We will also touch on more advanced concepts such as:
High availability
Disaster recovery, and
Configuring your report server to host Excel workbooks using Office Online Server.
Two of the tech industry’s essential front runners providing business intelligence solutions are Microsoft’s Power BI and Tableau. These leaders of data visualization help businesses narrow down and analyze their data with powerful built-in tools and clear visualizations. Each platform has distinctive strengths and weaknesses that should be considered before deciding on a business intelligence software.
Visual Guidance to build an optimized report for PowerBI
What are the components to be considered in your governance policy, how to make the report comprehensive in 1 glance and what should the report consumers get (a pretty report is not your spec...)
Power BI Single Page Applications Boise Code Camp 2017Stuart
Have lots of data? Need a dashboard powered by Microsoft Azure? Love Javascript? Learn how to use Javascript to integrate data-rich user experiences in PowerBI with your existing web applications. Featured for Boise Code Camp 2017.
Groupby -Power bi dashboard in hour by vishal pawar-Presentation Vishal Pawar
Power BI Dashboard in an hour with Various Slides.
Target Audience:
Useful for Develops and DBA those who want to know what is Power BI and How we can utilize various features.
Also session will be useful for anyone who wants learn Power BI from basic.
Abstract:
In this session, We will walk through various features of Power BI, How Power BI can transform your company’s data into rich visuals and Easy yet powerful Analytics solutions for your whole organization.
At end of session with following Power BI Dashboard example
sp_Blitz in Dashboard
SQL Server Info Dashboard
Twitter Dashboard
World Dashboard
Most important takeaways from session –
You will be learning basics of Power BI with the additional perk of analyzing sp_Blitz in Power BI.
Various features of Power BI making you from ZERO to HERO
After this session, you will be able to analyze data into Power BI
Starting in May 2010, with SQL Server 2008 R2, Microsoft began talking more and more about "Personal BI". The focus of this discussion was a paradigm shift moving business intelligence from being something a few BI professionals do with a data warehouse to a practice done by Information Workers every day in familiar tools like Microsoft Excel and SharePoint. Over the course of this session we will show you the improvements that Microsoft has made in the 2013 stack to take this new focus from being a “nice idea” to a truly powerful reality. We will explore the improvements made to Excel, PowerPivot & Power View, & Reporting Services. We will explain the underlying technology that makes the new features possible and walk through demos of some of the shinier toys. At the end of the session you will walk away with a better understanding of what is new in 2013 for business intelligence and an extreme desire to build reusable data model that will undoubtedly bring real value to your business.
The slide deck from data and analytics workshop for HR professionals. Presented in @hrtechgroup event in Microsoft Vancouver. The workshop was built around the HR sample partner data set
https://docs.microsoft.com/en-us/power-bi/sample-human-resources
Microsoft Power BI helps you stay up to date with the information that matters to you. With Power BI, dashboards help you keep a finger on the pulse of your business. Your dashboards display tiles that you can click to open reports for exploring further. Connect to multiple data sets to bring all of the relevant data together in one place.
Power BI Report Server Enterprise Architecture, Tools to Publish reports and ...Vishal Pawar
To improve the performance, sustainability, security and scalability of enterprise-grade Power BI implementations with constant velocity, we need to adhere best practices with sloid architecture.
In this session Vishal will go over Power BI Ecosystem with quick Example, Power BI report Server evolution from its inception till date with Architecture for Enterprise PBI RS and usage through various tool available to publish -SSDT SSRS, Power BI Desktop(Optimized Version), Report Builder and mobile report builder and various Best Practices for PBI Report Server.
SAP Business Objects Architecture
SAP Business Objects Universe Design
SAP Business Objects 12 Reporting Tools
SAP Business Objects Web intelligence Reporting Strength and limitations
SAP Business Objects Crystal Reports Architecture, Strength and limitations
SAP Business Objects Issues, performance Tuning.
SAP Business Objects Xcelcius Architecture, strength and weakness.
SAP Business Objects Universe Design Issues, performance tunning
SAP Business Objects SAP source Vs Non SAP source
SAP Business Objects Security
SAP Business Objects Application security lifecycle
SAP Business Objects Data Integrator, MDX, Cube
How city of chicago boosts their sap business objects environment prepares fo...Sebastien Goiffon
SAPinsider webinar ran by City of Chicago. How they streamline Business Objects using GB&SMITH 360Suite products around:
Business Objects backup disaster recovery
Business Objects security
Business Objects regression testing
Business Objects bi 4.2 migration
Business Objects audit
BusinessObjects backup disaster recovery
BusinessObjects security
BusinessObjects regression testing
BusinessObjects bi 4.2 migration
BusinessObjects audit
Software is eating the world and embedded analytics has grown in popularity over the last few years as a way to get simple, over-the-counter and distraction-free insights in front of software users. Before you start on your embedding journey it’s important to get the basics right to ensure you have the foundation for a successful delivery of over-the-counter data to your users.
When it comes to embedded analytics, it’s easy to see the advantages of providing more intuitive insights (the “why”), but much harder to plan the “how.” This webinar will provide you with the best practices and essentials needed to deliver reporting and dashboards to your users with our award-winning JavaScript API, TIBCO Jaspersoft® Visualize.js™.
Topics Covered:
Jaspersoft® Visualize.js basics – instantiation, authentication, rendering, parameters
Advantages over iFrames and REST APIs
Where to find examples and samples
Demos and Q&A session
Building Modern Data Platform with Microsoft AzureDmitry Anoshin
This presentation will cover Cloud history and Microsoft Azure Data Analytics capabilities. Moreover, it has a real-world example of DW modernization. Finally, we will check the alternative solution on Azure using Snowflake and Matillion ETL.
Join us as we take a deep dive into the architecture of the Salesforce1 Platform, explain how multitenancy actually works, and how it affects you as a developer. Showing the technology we use and the design principles we adhere to, you'll see how our platform teams manage three major upgrades a year without causing any issues to existing development. We'll cover the performance and security implications around the platform to give you an understanding of how limits have evolved. By the end of the session, you'll have a better grasp of the architecture underpinning Force.com and understand how to get the most out of it.
SAP BusinessObjects Web Intelligence Rich Client is a full-client reporting tool offered with Business Objects XI R3. This reporting tool is very similar to the Webi Java version that most end users are used to seeing in XI R2; however it offers a very important functionality of being able to work on reports offline without being connected to a CMS. It also provides equivalent report creation, editing, formatting, printing, and saving functionality that is found in Business Object’s original full-client reporting tool, Desktop Intelligence.
I am Murali.Below is a short summary on my professional experience,
Total years of experience - 13 (Releavant BO experience - 10 Years)
Technologies/Tools worked on : SAP BO 4.x - XI R2,BO Admin, Xcelsius Dashboard designing, Crystal Reports, SAP Design Studio, SAP BW 7,Unix,Oracle 10G PL/SQL, SQL Server and Microsoft Technologies(VB,ASP and VB.Net).
I am interested to take up new roles on different aspects in BO domain.
Smart TV Buyer Insights Survey 2024 by 91mobiles.pdf91mobiles
91mobiles recently conducted a Smart TV Buyer Insights Survey in which we asked over 3,000 respondents about the TV they own, aspects they look at on a new TV, and their TV buying preferences.
Transcript: Selling digital books in 2024: Insights from industry leaders - T...BookNet Canada
The publishing industry has been selling digital audiobooks and ebooks for over a decade and has found its groove. What’s changed? What has stayed the same? Where do we go from here? Join a group of leading sales peers from across the industry for a conversation about the lessons learned since the popularization of digital books, best practices, digital book supply chain management, and more.
Link to video recording: https://bnctechforum.ca/sessions/selling-digital-books-in-2024-insights-from-industry-leaders/
Presented by BookNet Canada on May 28, 2024, with support from the Department of Canadian Heritage.
GraphRAG is All You need? LLM & Knowledge GraphGuy Korland
Guy Korland, CEO and Co-founder of FalkorDB, will review two articles on the integration of language models with knowledge graphs.
1. Unifying Large Language Models and Knowledge Graphs: A Roadmap.
https://arxiv.org/abs/2306.08302
2. Microsoft Research's GraphRAG paper and a review paper on various uses of knowledge graphs:
https://www.microsoft.com/en-us/research/blog/graphrag-unlocking-llm-discovery-on-narrative-private-data/
Software Delivery At the Speed of AI: Inflectra Invests In AI-Powered QualityInflectra
In this insightful webinar, Inflectra explores how artificial intelligence (AI) is transforming software development and testing. Discover how AI-powered tools are revolutionizing every stage of the software development lifecycle (SDLC), from design and prototyping to testing, deployment, and monitoring.
Learn about:
• The Future of Testing: How AI is shifting testing towards verification, analysis, and higher-level skills, while reducing repetitive tasks.
• Test Automation: How AI-powered test case generation, optimization, and self-healing tests are making testing more efficient and effective.
• Visual Testing: Explore the emerging capabilities of AI in visual testing and how it's set to revolutionize UI verification.
• Inflectra's AI Solutions: See demonstrations of Inflectra's cutting-edge AI tools like the ChatGPT plugin and Azure Open AI platform, designed to streamline your testing process.
Whether you're a developer, tester, or QA professional, this webinar will give you valuable insights into how AI is shaping the future of software delivery.
UiPath Test Automation using UiPath Test Suite series, part 4DianaGray10
Welcome to UiPath Test Automation using UiPath Test Suite series part 4. In this session, we will cover Test Manager overview along with SAP heatmap.
The UiPath Test Manager overview with SAP heatmap webinar offers a concise yet comprehensive exploration of the role of a Test Manager within SAP environments, coupled with the utilization of heatmaps for effective testing strategies.
Participants will gain insights into the responsibilities, challenges, and best practices associated with test management in SAP projects. Additionally, the webinar delves into the significance of heatmaps as a visual aid for identifying testing priorities, areas of risk, and resource allocation within SAP landscapes. Through this session, attendees can expect to enhance their understanding of test management principles while learning practical approaches to optimize testing processes in SAP environments using heatmap visualization techniques
What will you get from this session?
1. Insights into SAP testing best practices
2. Heatmap utilization for testing
3. Optimization of testing processes
4. Demo
Topics covered:
Execution from the test manager
Orchestrator execution result
Defect reporting
SAP heatmap example with demo
Speaker:
Deepak Rai, Automation Practice Lead, Boundaryless Group and UiPath MVP
JMeter webinar - integration with InfluxDB and GrafanaRTTS
Watch this recorded webinar about real-time monitoring of application performance. See how to integrate Apache JMeter, the open-source leader in performance testing, with InfluxDB, the open-source time-series database, and Grafana, the open-source analytics and visualization application.
In this webinar, we will review the benefits of leveraging InfluxDB and Grafana when executing load tests and demonstrate how these tools are used to visualize performance metrics.
Length: 30 minutes
Session Overview
-------------------------------------------
During this webinar, we will cover the following topics while demonstrating the integrations of JMeter, InfluxDB and Grafana:
- What out-of-the-box solutions are available for real-time monitoring JMeter tests?
- What are the benefits of integrating InfluxDB and Grafana into the load testing stack?
- Which features are provided by Grafana?
- Demonstration of InfluxDB and Grafana using a practice web application
To view the webinar recording, go to:
https://www.rttsweb.com/jmeter-integration-webinar
"Impact of front-end architecture on development cost", Viktor TurskyiFwdays
I have heard many times that architecture is not important for the front-end. Also, many times I have seen how developers implement features on the front-end just following the standard rules for a framework and think that this is enough to successfully launch the project, and then the project fails. How to prevent this and what approach to choose? I have launched dozens of complex projects and during the talk we will analyze which approaches have worked for me and which have not.
Neuro-symbolic is not enough, we need neuro-*semantic*Frank van Harmelen
Neuro-symbolic (NeSy) AI is on the rise. However, simply machine learning on just any symbolic structure is not sufficient to really harvest the gains of NeSy. These will only be gained when the symbolic structures have an actual semantics. I give an operational definition of semantics as “predictable inference”.
All of this illustrated with link prediction over knowledge graphs, but the argument is general.
Accelerate your Kubernetes clusters with Varnish CachingThijs Feryn
A presentation about the usage and availability of Varnish on Kubernetes. This talk explores the capabilities of Varnish caching and shows how to use the Varnish Helm chart to deploy it to Kubernetes.
This presentation was delivered at K8SUG Singapore. See https://feryn.eu/presentations/accelerate-your-kubernetes-clusters-with-varnish-caching-k8sug-singapore-28-2024 for more details.
State of ICS and IoT Cyber Threat Landscape Report 2024 previewPrayukth K V
The IoT and OT threat landscape report has been prepared by the Threat Research Team at Sectrio using data from Sectrio, cyber threat intelligence farming facilities spread across over 85 cities around the world. In addition, Sectrio also runs AI-based advanced threat and payload engagement facilities that serve as sinks to attract and engage sophisticated threat actors, and newer malware including new variants and latent threats that are at an earlier stage of development.
The latest edition of the OT/ICS and IoT security Threat Landscape Report 2024 also covers:
State of global ICS asset and network exposure
Sectoral targets and attacks as well as the cost of ransom
Global APT activity, AI usage, actor and tactic profiles, and implications
Rise in volumes of AI-powered cyberattacks
Major cyber events in 2024
Malware and malicious payload trends
Cyberattack types and targets
Vulnerability exploit attempts on CVEs
Attacks on counties – USA
Expansion of bot farms – how, where, and why
In-depth analysis of the cyber threat landscape across North America, South America, Europe, APAC, and the Middle East
Why are attacks on smart factories rising?
Cyber risk predictions
Axis of attacks – Europe
Systemic attacks in the Middle East
Download the full report from here:
https://sectrio.com/resources/ot-threat-landscape-reports/sectrio-releases-ot-ics-and-iot-security-threat-landscape-report-2024/
Search and Society: Reimagining Information Access for Radical FuturesBhaskar Mitra
The field of Information retrieval (IR) is currently undergoing a transformative shift, at least partly due to the emerging applications of generative AI to information access. In this talk, we will deliberate on the sociotechnical implications of generative AI for information access. We will argue that there is both a critical necessity and an exciting opportunity for the IR community to re-center our research agendas on societal needs while dismantling the artificial separation between the work on fairness, accountability, transparency, and ethics in IR and the rest of IR research. Instead of adopting a reactionary strategy of trying to mitigate potential social harms from emerging technologies, the community should aim to proactively set the research agenda for the kinds of systems we should build inspired by diverse explicitly stated sociotechnical imaginaries. The sociotechnical imaginaries that underpin the design and development of information access technologies needs to be explicitly articulated, and we need to develop theories of change in context of these diverse perspectives. Our guiding future imaginaries must be informed by other academic fields, such as democratic theory and critical theory, and should be co-developed with social science scholars, legal scholars, civil rights and social justice activists, and artists, among others.
Epistemic Interaction - tuning interfaces to provide information for AI supportAlan Dix
Paper presented at SYNERGY workshop at AVI 2024, Genoa, Italy. 3rd June 2024
https://alandix.com/academic/papers/synergy2024-epistemic/
As machine learning integrates deeper into human-computer interactions, the concept of epistemic interaction emerges, aiming to refine these interactions to enhance system adaptability. This approach encourages minor, intentional adjustments in user behaviour to enrich the data available for system learning. This paper introduces epistemic interaction within the context of human-system communication, illustrating how deliberate interaction design can improve system understanding and adaptation. Through concrete examples, we demonstrate the potential of epistemic interaction to significantly advance human-computer interaction by leveraging intuitive human communication strategies to inform system design and functionality, offering a novel pathway for enriching user-system engagements.
2. Business Objects is a tool primarily supports
Data Warehouse
Business Intelligence
Data Services ETL
(Extraction, Transformation and
Loading)
Ad hoc /Analysis Reports
Data Quality
(Data Cleansing, data scrubbing, )
Interactive Dashboard
Data Federator
(Abstraction Process)
Data Profiling
(Pre-processing of data, meta data
Management )
Canned Reports
Scorecards
Publications, Mobile Reports
Polestar, Data Lineage Analysis,
Flex Based interactive reporting.
Rapid Marts
Note – Business Objects delivers standard Business Content for SAP and Non-SAP in the form of
Rapid Marts.
3. BusinessObjects Enterprise Framework
CORBA communication framework enables servers to interact
with each other.
Web Client
Also part of Crystal Reports, OLAP Intelligence, Business View
Manager, Universe Designer, Central Configuration Manager,
Publishing Wizard and Import Wizard enabling these
applications to also connect to BusinessObjects Enterprise
Windows-based Tools and Applications
Business
Views
Manager
Universe
Designer
Web Server
OLAP
System
Audit
Desktop
Intelligence
Web
Application
Server
Web
Component
Adapter
(WCA)
Central
Management
Server (CMS)
Event Server
Crystal Reports
Cache Server
Input File
Repository
Server (FRS)
Output File
Repository
Server (FRS)
OLAP
Intelligence
Designer
Import
Wizard
Desktop
Intelligence
Cache Server
Crystal
Reports
Designer
Publishing
Wizard
BusinessObjects Enterprise™ Infrastructure
Program Job
Server
Destination
Server
List of
Values (LOV)
Job Server
Crystal
Reports Job
Server
Crystal
Reports Page
Server
Report
Application
Server (RAS)
Web
Intelligence
Job
Server
Web
Intelligence
Report Server
Connection
Server
Universe / Business View
Reporting
Desktop
Intelligence
Job
Server
Desktop
Intelligence
Report Server
4.
5. - Intuitive zero foot print reporting.
- Slice and Dice capability.
- Multidimensional analysis on data cubes like
from SAP BI Infocube.
- Multiple data providers.
- Ability to change data representation on Fly.
- More useful for BI reports not suitable for
operational reports.
6.
7. •
•
•
•
•
•
•
•
•
Can't copy objects from one report to another even if the query/universe/context is
identical.
Must resize the formula editor every time you use it (no minimize/maximize
buttons on the window, no comments permitted and no word wrapping allowed.
No search/replace either.)
Very low resolution on graphs when exported (optimized for screen display only and
no easy way to optimize for printing)
Can only export to Excel or PDF and no other format
Can't open more than one report at a time otherwise the instability becomes
intolerable.
Conditions and exceptions can’t be used from query directly.
Text variables /Replacement variables from query don't work directly in WebIntelligence
User exit variables are not able to work directly in Web-Intelligence
No picture perfect reporting as in crystal reports used for operational reports.
8. •
•
•
•
•
•
•
•
•
Crystal Report Can copy objects from one report to another when the
query/universe/context is identical.
Must resize the formula editor every time you use it (no minimize/maximize buttons
on the window, no comments permitted and no word wrapping allowed. No
search/replace either.)
Crystal reports can have Very high resolution on graphs when exported (optimized
for screen display only and no easy way to optimize for printing)
Crystal Report be export to Excel or PDF or any other format
Crystal can open more than one report at a time.
Conditions and exceptions reporting is quite flexible in Crystal Report.
Text variables /Replacement variables from query don't work directly in WebIntelligence but can work in Bex–Analyzer and Web dynapro which is tightly
integrated with SAP BI modules.
User exit variables are not able to work directly in Web-Intelligence but work fine
with Bex Analyzerand Web Dynapro.
No picture perfect reporting as in crystal reports used for operational reports.
9. •
Single edition and smaller installation footprint
•
used for operational reporting requirements more structured reporting
Balance Sheet, trail balance, daily close PNL (profit and loss reporting).
•
•
Flexible Report Layout and Page Orientation Options with Interactive Sorting, Saved
Data Selections.
Formula/Field find and Duplicate Enhancement
•
Custom Cross-Tab Rows, Columns and Summaries (Earlier it was a limitation)
•
Dynamic interactive reporting using Flash/Xcelsius/Flex Integration (Flash animation
objects to be embedded directly in the Crystal Reports)
•
Improve XML Export . Improve support for SAP as data source.
•
Enhance Support for Web-Based Data Sources and Crystal reports.com (Allowing for
direct connection to your Sales force CRM data, XML Web services as Data Sources)
•
Hyper linking Wizard And many more…
like
11. - Non Intuitive reporting.
- Less dynamic slice and dice capability.
- Less intuitive representation of hierarchical
data.Level of hierarchy.
- Less suitable for multi-dimensional reporting
- Band based reporting structure header, footer,
summary and detail section. New non band
based reporting structure have emerged.
- More later….
12. What can replace Crystal Reports
2008 Limitations?
• Unlike crystal WebI has intuitive reporting.
• WebI has better dynamic Slice and dice
capability.
• Bex-Analyzer has better support for User Exits
, replacements and text variables.
• Web-dynapro better support for fetching CRM
data.
• Xcelcius has more dynamic interactive
reporting.
13. Query Level
• Synchronize multiple data
providers
• Utilization of @ variables
@prompt , etc.
• Cooked Tables , use of
Aggregate awareness.
• More later..
•
•
•
•
•
Report Level
# multi-value
multiple value for break
Fold option in WebI
#error, #sync,
Formatting issue with
graphs like drill down
hierarchy in Graphs.
More later…
15. • More intuitive interactive dynamic Flex/Flash
based reporting.
• Can be created integrated with Excel/crystal
report interfaces.
• More intuitive controls like slider for data
input, linked graphs, maps etc.
• Offline interactive capability.
22. Note - According to SAP , we can overcome the limitations of S AP
Universes by integrating Business Objects with Information Management
(Data Services) .
25. (Bringing SAP Roles to BO environment as groups)
SAPR3
SAPBW
View
Standard
Integration
BO- Central Management
Console
Authentication
Full
View on
Demand
Schedule
Access
Levels
Content
SAP
Manually
Custom
General
Role Import
Application
SAP ROLES
BO GROUPS
System
26.
27. • SAP BO uses
Enterprise
LDAP
Windows NT
Windows AD
SAP Authentication
• SAP BO converts SAP Roles into BO groups.
• SAP BO has standard access levels
Full
Schedule
View
View On Demand
• SAPBO also gives a facility to create Custom Access Level using General, System,
Application, Content .
Security Mode
ApplicationUser SecurityGroupAccess level
Pre Requisites
• User should be created and mapped to group.
• Create Access level and provide restriction to Access level.
28. SAP BO uses
• Enterprise
• LDAP
• Windows NT
• Windows AD
• SAP Authentication
SAP BO converts SAP Roles into BO groups.
SAP BO has standard access levels
• Full
• Schedule
• View
• View On Demand
SAPBO also gives a facility to create Custom Access Level using General, System, Application, Content .
Security Mode:
ApplicationUser SecurityGroupAccess level
Pre Requisites:
User should be created and mapped to group.
Create Access level and provide restriction to Access level.
29. How SAP BO Security Model is
associated with Business Warehouse?
30.
31.
32. SAP Business Objects Business Intelligence Landscape - ERP system (SAP / non SAP) with
Non SAP DWH & SAP NetWeaver Business Warehouse
33.
34. Import Wizard
Development
Import Wizard
Staging
.BIAR
Production
.BIAR
• System Repository (SR) Contains Semantic Layer, Reports, Users,
Groups, etc
• Audit Repository (AR) Contains Metadata
• Performance Management repository(PR)Contains metrics for the
scorecard
Note - Import Wizard
46. Future Face of SAP Business Objects
with OLAP-MDX-BWA
• SAP HANA
• In-Memory BI.
47. SAP Business Objects , BI More
details in other presentations
•
•
•
•
Universe Design issues.
BO Administration and deployment.
BO Server Architecture Design.
Each 16 reporting flavour in detail, Webi,
Crystal, xcelsius, polestar, quaas, voyager,
Dynapro, Bex analyser,
• Business Planning Simmulation SAP-BPS,
Business planning and consolidations SAP BPC.