Download to read offline
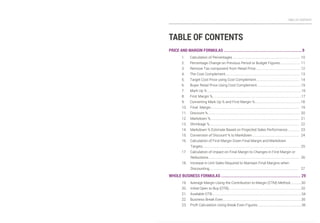
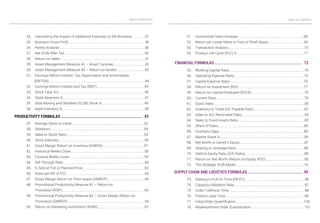
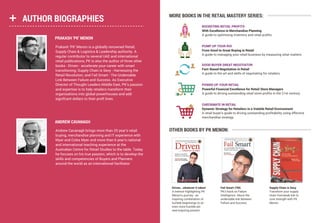


This document contains a table of contents for the book "Winning Formulas in Retail" by Prakash Menon and Andrew Cavanagh. The book contains over 100 retail formulas organized into sections on price and margin formulas, whole business formulas, productivity formulas, financial formulas, supply chain and logistics formulas, and store operations formulas. It also includes brief biographies of the authors, Prakash Menon and Andrew Cavanagh. Menon is a globally renowned retail expert and author of multiple books while Cavanagh's background is not provided. The book provides formulas to help retailers with calculations related to pricing, margins, business performance, productivity, finances, supply chain management, and store operations.