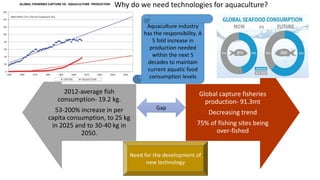
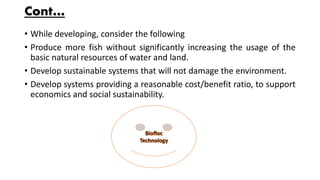
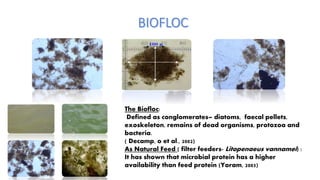
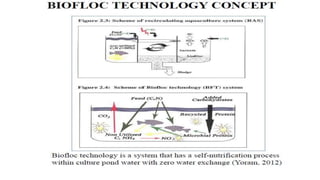
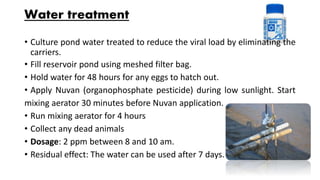
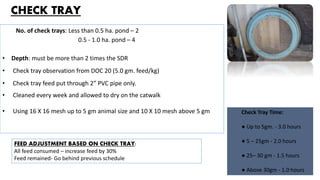
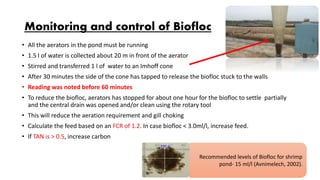
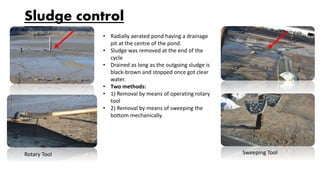
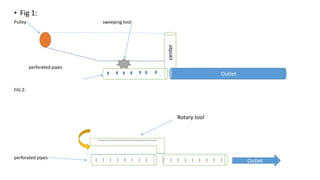
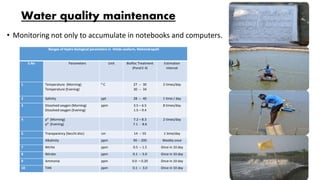
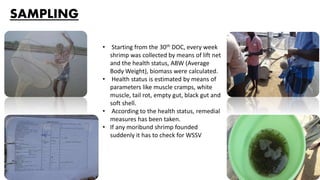
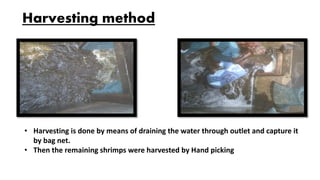
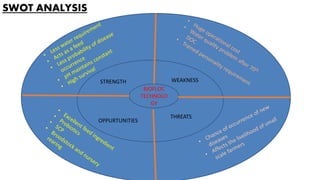
V. SANTHANA KUMAR
AEM-MA4-04
2012-average fish
consumption- 19.2 kg.
53-200% increase in per
capita consumption, to 25 kg
in 2025 and to 30-40 kg in
2050.
Global capture fisheries
production- 91.3mt
Decreasing trend
75% of fishing sites being
over-fished
Gap
Need for the development of
new technology
Aquaculture industry
has the responsibility. A
5 fold increase in
production needed
within the next 5
decades to maintain
current aquatic food
consumption levels
Why do we need technologies for aquaculture?
Cont…
• While developing, consider the following
• Produce more fish without significantly increasing the usage of the
basic natural resources of water and land.
• Develop sustainable systems that will not damage the environment.
• Develop systems providing a reasonable cost/benefit ratio, to support
economics and social sustainability.
The Biofloc:
Defined as conglomerates– diatoms, faecal pellets,
exoskeleton, remains of dead organisms, protozoa and
bacteria.
( Decamp, o et al., 2002)
As Natural Feed ( filter feeders- Litopenaeus vannamei) :
It has shown that microbial protein has a higher
availability than feed protein (Yoram, 2005)
SITE LOCATION
,
MAHENDRAPALLI, SIRKAZHI,
TAMILNADU
ORGANIZATION CHART
CEO
Manager
A &K Block
manager
B Block
manager
C Block
manager
D&E Block
manager
F&GBlock
manager
Block
supervisor
Block
supervisor
Block
supervisor
Block
supervisor
Block
supervisor
POND DESCRIPTION
 Shape: Rectangular with rounded at the corner.
 Area: 40*30 m^2 = 1200m^2
 Depth: 1.0 m.
 Type: Fully lined (side + bottom)
• Side lining is done with High Density Polyethylene Sheet
• Bottom lining is done with Kadapa slab
 Check tray: 2
 Pond centre cleaning system: Rotatory tool
 Outlet: Sluice type
 Inlet: Sieve type pipe
Pond construction
Sunlight drying
Water filling & water cultureFeeding boat
Catwalk installationStep
installation
Pond lining & bird netting
Water treatment
• Culture pond water treated to reduce the viral load by eliminating the
carriers.
• Fill reservoir pond using meshed filter bag.
• Hold water for 48 hours for any eggs to hatch out.
• Apply Nuvan (organophosphate pesticide) during low sunlight. Start
mixing aerator 30 minutes before Nuvan application.
• Run mixing aerator for 4 hours
• Collect any dead animals
• Dosage: 2 ppm between 8 and 10 am.
• Residual effect: The water can be used after 7 days.
WATER DRAINAGE
RESERVOIR INLET CANAL BIOFLOC POND
OUTLET SETTLEMENT TANK
OUTLET
CANAL
Biosecurity
• Seawater through passing through 250 micron screen.
• Crab fencing
• Bird netting
• Chlorine treatment to the pond & reservoir.
Aeration & Aerator Deployment
• 14 HP of paddle wheel aerators
• Placed in the periphery of the ponds at a distance of about 30% of the width of the
pond from the pond edge
• Aerators were directed to create a clockwise circular motion
• For vertical aeration aspirators were used to keep the solids in suspension
Stocking procedure
• Seeds were kept inside the FRP TANK along with the
hatchery water
• pH and salinity of the hatchery water has been noted
• Pond water sprayed from the shower into the tank until the
pH and salinity of the hatchery water becomes equal to the
pond water
• Released into the pond water
Stress test
Confirmation test
Biofloc development
Clear water
Algal bloom
Large amount of foam on the
surface of ponds due to
accumulating dissolved organic
material and inadequate bacterial
community
Change to brown colour
More molasses
application
Transition
period- 2 weeks
C/N RATIO
• The ratio of organic carbon to total nitrogen
• Pond received a regular feed of 35% protein
• At initial due to low amount of feed addition high C/N (15:1)was maintained
Pond fed with 100kg pellets with 35%
protein+ 70 kg molasses
Molasses contain 20% water.
Molasses as dry matter=56 kg
C=100*50%+56*50%=78 kgC
N= 35*15.5%*100=5.4 kg N.
C/N= 14.4
Increased feed
addition
Lowering the C/N
RATIO.
Bacterial
population
dropped
Decomposition
rate slowdown
Accumulation of
inorganic nitrogen
Increased
molasses
addition
Feeding method
● Up to DOC 30: follow feeding chart (estimate the survival using check
trays)
● After DOC 30: check tray, moulting condition, size of the shrimp and as
per % biomass
● In case there is doubt about Biomass, intestine colour check to find out
underfeeding or overfeeding
Feeding time:
● Range: 7-7.30 am, 12-1 pm, 4-5 pm and 7-8 pm
Feeding area – Margin area of the pond.
CHECK TRAY
No. of check trays: Less than 0.5 ha. pond – 2
0.5 - 1.0 ha. pond – 4
• Depth: must be more than 2 times the SDR
• Check tray observation from DOC 20 (5.0 gm. feed/kg)
• Check tray feed put through 2” PVC pipe only.
• Cleaned every week and allowed to dry on the catwalk
• Using 16 X 16 mesh up to 5 gm animal size and 10 X 10 mesh above 5 gm Check Tray Time:
● Up to 5gm. - 3.0 hours
● 5 – 25gm - 2.0 hours
● 25– 30 gm - 1.5 hours
● Above 30gm - 1.0 hours
FEED ADJUSTMENT BASED ON CHECK TRAY:
All feed consumed – increase feed by 30%
Feed remained- Go behind previous schedule
Monitoring and control of Biofloc
• All the aerators in the pond must be running
• 1.5 l of water is collected about 20 m in front of the aerator
• Stirred and transferred 1 l of water to an Imhoff cone
• After 30 minutes the side of the cone has tapped to release the biofloc stuck to the walls
• Reading was noted before 60 minutes
• To reduce the biofloc, aerators has stopped for about one hour for the biofloc to settle partially
and the central drain was opened and/or clean using the rotary tool
• This will reduce the aeration requirement and gill choking
• Calculate the feed based on an FCR of 1.2. In case biofloc < 3.0ml/l, increase feed.
• If TAN is > 0.5, increase carbon
Recommended levels of Biofloc for shrimp
pond- 15 ml/l (Avnimelech, 2002).
Sludge control
• Radially aerated pond having a drainage
pit at the centre of the pond.
• Sludge was removed at the end of the
cycle
• Drained as long as the outgoing sludge is
black-brown and stopped once got clear
water.
• Two methods:
• 1) Removal by means of operating rotary
tool
• 2) Removal by means of sweeping the
bottom mechanically.
1
2
Rotary Tool Sweeping Tool
• Fig 1:
Pulley sweeping tool
perforated pipes
FIG 2:
perforated pipes
center
Outlet
…………………………….........
…
…
…
…
…
…
…
…
…
…
…
…
…
…
…
…
…. Outlet
Rotary tool
Water quality maintenance
• Monitoring not only to accumulate in notebooks and computers.
Ranges of Hydro biological parameters in Hitide seafarm, Mahendrapalli
S.No Parameters Unit Biofloc Treatment
(Pond E 4)
Estimation
interval
1 Temperature (Morning)
Temperature (Evening)
0 C 27 -- 30
30 -- 34
2 times/day
2 Salinity ppt 28 -- 40 1 time / day
3 Dissolved oxygen (Morning)
Dissolved oxygen (Evening)
ppm 3.5 – 6.5
1.5 – 9.4
8 times/day
4 pH (Morning)
pH (Evening)
7.2 – 8.3
7.1 - 8.6
2 times/day
5 Transparency (Secchi disc) cm 14 -- 55 1 time/day
Alkalinity ppm 90 -- 200 Weekly once
7 Nitrite ppm 0.5 – 1.5 Once in 10 day
8 Nitrate ppm 0.1 -- 5.0 Once in 10 day
9 Ammonia ppm 0.0 – 0.20 Once in 10 day
10 TAN ppm 0.1 – 3.0 Once in 10 day
SAMPLING
• Starting from the 30th DOC, every week
shrimp was collected by means of lift net
and the health status, ABW (Average
Body Weight), biomass were calculated.
• Health status is estimated by means of
parameters like muscle cramps, white
muscle, tail rot, empty gut, black gut and
soft shell.
• According to the health status, remedial
measures has been taken.
• If any moribund shrimp founded
suddenly it has to check for WSSV
Harvesting method
• Harvesting is done by means of draining the water through outlet and capture it
by bag net.
• Then the remaining shrimps were harvested by Hand picking
SWOT ANALYSIS
STRESTRE
BIOFLOC
TECHNOLO
GY
STRENGTH
OPPURTUNITIES
THREATS
WEAKNESS
me

Biofloc technology

  • 1.
  • 2.
    2012-average fish consumption- 19.2kg. 53-200% increase in per capita consumption, to 25 kg in 2025 and to 30-40 kg in 2050. Global capture fisheries production- 91.3mt Decreasing trend 75% of fishing sites being over-fished Gap Need for the development of new technology Aquaculture industry has the responsibility. A 5 fold increase in production needed within the next 5 decades to maintain current aquatic food consumption levels Why do we need technologies for aquaculture?
  • 3.
    Cont… • While developing,consider the following • Produce more fish without significantly increasing the usage of the basic natural resources of water and land. • Develop sustainable systems that will not damage the environment. • Develop systems providing a reasonable cost/benefit ratio, to support economics and social sustainability.
  • 4.
    The Biofloc: Defined asconglomerates– diatoms, faecal pellets, exoskeleton, remains of dead organisms, protozoa and bacteria. ( Decamp, o et al., 2002) As Natural Feed ( filter feeders- Litopenaeus vannamei) : It has shown that microbial protein has a higher availability than feed protein (Yoram, 2005)
  • 6.
  • 7.
    ORGANIZATION CHART CEO Manager A &KBlock manager B Block manager C Block manager D&E Block manager F&GBlock manager Block supervisor Block supervisor Block supervisor Block supervisor Block supervisor
  • 8.
    POND DESCRIPTION  Shape:Rectangular with rounded at the corner.  Area: 40*30 m^2 = 1200m^2  Depth: 1.0 m.  Type: Fully lined (side + bottom) • Side lining is done with High Density Polyethylene Sheet • Bottom lining is done with Kadapa slab  Check tray: 2  Pond centre cleaning system: Rotatory tool  Outlet: Sluice type  Inlet: Sieve type pipe
  • 9.
    Pond construction Sunlight drying Waterfilling & water cultureFeeding boat Catwalk installationStep installation Pond lining & bird netting
  • 10.
    Water treatment • Culturepond water treated to reduce the viral load by eliminating the carriers. • Fill reservoir pond using meshed filter bag. • Hold water for 48 hours for any eggs to hatch out. • Apply Nuvan (organophosphate pesticide) during low sunlight. Start mixing aerator 30 minutes before Nuvan application. • Run mixing aerator for 4 hours • Collect any dead animals • Dosage: 2 ppm between 8 and 10 am. • Residual effect: The water can be used after 7 days.
  • 11.
    WATER DRAINAGE RESERVOIR INLETCANAL BIOFLOC POND OUTLET SETTLEMENT TANK OUTLET CANAL
  • 12.
    Biosecurity • Seawater throughpassing through 250 micron screen. • Crab fencing • Bird netting • Chlorine treatment to the pond & reservoir.
  • 13.
    Aeration & AeratorDeployment • 14 HP of paddle wheel aerators • Placed in the periphery of the ponds at a distance of about 30% of the width of the pond from the pond edge • Aerators were directed to create a clockwise circular motion • For vertical aeration aspirators were used to keep the solids in suspension
  • 14.
    Stocking procedure • Seedswere kept inside the FRP TANK along with the hatchery water • pH and salinity of the hatchery water has been noted • Pond water sprayed from the shower into the tank until the pH and salinity of the hatchery water becomes equal to the pond water • Released into the pond water Stress test Confirmation test
  • 15.
    Biofloc development Clear water Algalbloom Large amount of foam on the surface of ponds due to accumulating dissolved organic material and inadequate bacterial community Change to brown colour More molasses application Transition period- 2 weeks
  • 16.
    C/N RATIO • Theratio of organic carbon to total nitrogen • Pond received a regular feed of 35% protein • At initial due to low amount of feed addition high C/N (15:1)was maintained Pond fed with 100kg pellets with 35% protein+ 70 kg molasses Molasses contain 20% water. Molasses as dry matter=56 kg C=100*50%+56*50%=78 kgC N= 35*15.5%*100=5.4 kg N. C/N= 14.4 Increased feed addition Lowering the C/N RATIO. Bacterial population dropped Decomposition rate slowdown Accumulation of inorganic nitrogen Increased molasses addition
  • 17.
    Feeding method ● Upto DOC 30: follow feeding chart (estimate the survival using check trays) ● After DOC 30: check tray, moulting condition, size of the shrimp and as per % biomass ● In case there is doubt about Biomass, intestine colour check to find out underfeeding or overfeeding Feeding time: ● Range: 7-7.30 am, 12-1 pm, 4-5 pm and 7-8 pm Feeding area – Margin area of the pond.
  • 18.
    CHECK TRAY No. ofcheck trays: Less than 0.5 ha. pond – 2 0.5 - 1.0 ha. pond – 4 • Depth: must be more than 2 times the SDR • Check tray observation from DOC 20 (5.0 gm. feed/kg) • Check tray feed put through 2” PVC pipe only. • Cleaned every week and allowed to dry on the catwalk • Using 16 X 16 mesh up to 5 gm animal size and 10 X 10 mesh above 5 gm Check Tray Time: ● Up to 5gm. - 3.0 hours ● 5 – 25gm - 2.0 hours ● 25– 30 gm - 1.5 hours ● Above 30gm - 1.0 hours FEED ADJUSTMENT BASED ON CHECK TRAY: All feed consumed – increase feed by 30% Feed remained- Go behind previous schedule
  • 19.
    Monitoring and controlof Biofloc • All the aerators in the pond must be running • 1.5 l of water is collected about 20 m in front of the aerator • Stirred and transferred 1 l of water to an Imhoff cone • After 30 minutes the side of the cone has tapped to release the biofloc stuck to the walls • Reading was noted before 60 minutes • To reduce the biofloc, aerators has stopped for about one hour for the biofloc to settle partially and the central drain was opened and/or clean using the rotary tool • This will reduce the aeration requirement and gill choking • Calculate the feed based on an FCR of 1.2. In case biofloc < 3.0ml/l, increase feed. • If TAN is > 0.5, increase carbon Recommended levels of Biofloc for shrimp pond- 15 ml/l (Avnimelech, 2002).
  • 20.
    Sludge control • Radiallyaerated pond having a drainage pit at the centre of the pond. • Sludge was removed at the end of the cycle • Drained as long as the outgoing sludge is black-brown and stopped once got clear water. • Two methods: • 1) Removal by means of operating rotary tool • 2) Removal by means of sweeping the bottom mechanically. 1 2 Rotary Tool Sweeping Tool
  • 21.
    • Fig 1: Pulleysweeping tool perforated pipes FIG 2: perforated pipes center Outlet ……………………………......... … … … … … … … … … … … … … … … … …. Outlet Rotary tool
  • 22.
    Water quality maintenance •Monitoring not only to accumulate in notebooks and computers. Ranges of Hydro biological parameters in Hitide seafarm, Mahendrapalli S.No Parameters Unit Biofloc Treatment (Pond E 4) Estimation interval 1 Temperature (Morning) Temperature (Evening) 0 C 27 -- 30 30 -- 34 2 times/day 2 Salinity ppt 28 -- 40 1 time / day 3 Dissolved oxygen (Morning) Dissolved oxygen (Evening) ppm 3.5 – 6.5 1.5 – 9.4 8 times/day 4 pH (Morning) pH (Evening) 7.2 – 8.3 7.1 - 8.6 2 times/day 5 Transparency (Secchi disc) cm 14 -- 55 1 time/day Alkalinity ppm 90 -- 200 Weekly once 7 Nitrite ppm 0.5 – 1.5 Once in 10 day 8 Nitrate ppm 0.1 -- 5.0 Once in 10 day 9 Ammonia ppm 0.0 – 0.20 Once in 10 day 10 TAN ppm 0.1 – 3.0 Once in 10 day
  • 23.
    SAMPLING • Starting fromthe 30th DOC, every week shrimp was collected by means of lift net and the health status, ABW (Average Body Weight), biomass were calculated. • Health status is estimated by means of parameters like muscle cramps, white muscle, tail rot, empty gut, black gut and soft shell. • According to the health status, remedial measures has been taken. • If any moribund shrimp founded suddenly it has to check for WSSV
  • 24.
    Harvesting method • Harvestingis done by means of draining the water through outlet and capture it by bag net. • Then the remaining shrimps were harvested by Hand picking
  • 25.
  • 26.