Population growth in developing countries is increasing 9 times faster than developed countries by 2050
95% of growth in developing countries and will probably reach 7.5-10.8 billion people
Carrying capacity is the maximum population that a given area can sustain.
Carrying capacity of human is the maximum number of people who could live in reasonable freedom and comfort indefinitely, without decreasing the ability of the earth to sustain future generations.
Population growth in developing countries is increasing 9 times faster than developed countries by 2050
95% of growth in developing countries and will probably reach 7.5-10.8 billion people
Carrying capacity is the maximum popul
Population explosion,definition,causes of population explosion,high birth rate, low death rate, life expectancy,immigration,density of population,consequences of population explosion,overexploitation of natural resources,industrialisation and urbanisation, environmental pollution, poverty,malnutrition & famines,economic effect,social effect,population dyanamics of india,natality,mortality,emigration,immigration,age structure,sex ratio,dependency ratio,birth control methods. lastly question answer session and Thank You
This is the 10th lesson of the course 'Poverty and Environment ' taught at the Faculty of Social Sciences and Humanities, Rajarata University of Sri Lanka
Population : The word population has been derived from the Latin word “populatio” which means people.
The group of individual species which occupy a definite geographic area is defined as population.
Population Growth : The change in population per unit area at particular time is called population Growth.
Diabetes is a rapidly and serious health problem in Pakistan. This chronic condition is associated with serious long-term complications, including higher risk of heart disease and stroke. Aggressive treatment of hypertension and hyperlipideamia can result in a substantial reduction in cardiovascular events in patients with diabetes 1. Consequently pharmacist-led diabetes cardiovascular risk (DCVR) clinics have been established in both primary and secondary care sites in NHS Lothian during the past five years. An audit of the pharmaceutical care delivery at the clinics was conducted in order to evaluate practice and to standardize the pharmacists’ documentation of outcomes. Pharmaceutical care issues (PCI) and patient details were collected both prospectively and retrospectively from three DCVR clinics. The PCI`s were categorized according to a triangularised system consisting of multiple categories. These were ‘checks’, ‘changes’ (‘change in drug therapy process’ and ‘change in drug therapy’), ‘drug therapy problems’ and ‘quality assurance descriptors’ (‘timer perspective’ and ‘degree of change’). A verified medication assessment tool (MAT) for patients with chronic cardiovascular disease was applied to the patients from one of the clinics. The tool was used to quantify PCI`s and pharmacist actions that were centered on implementing or enforcing clinical guideline standards. A database was developed to be used as an assessment tool and to standardize the documentation of achievement of outcomes. Feedback on the audit of the pharmaceutical care delivery and the database was received from the DCVR clinic pharmacist at a focus group meeting.
"Understanding the Carbon Cycle: Processes, Human Impacts, and Strategies for...MMariSelvam4
The carbon cycle is a critical component of Earth's environmental system, governing the movement and transformation of carbon through various reservoirs, including the atmosphere, oceans, soil, and living organisms. This complex cycle involves several key processes such as photosynthesis, respiration, decomposition, and carbon sequestration, each contributing to the regulation of carbon levels on the planet.
Human activities, particularly fossil fuel combustion and deforestation, have significantly altered the natural carbon cycle, leading to increased atmospheric carbon dioxide concentrations and driving climate change. Understanding the intricacies of the carbon cycle is essential for assessing the impacts of these changes and developing effective mitigation strategies.
By studying the carbon cycle, scientists can identify carbon sources and sinks, measure carbon fluxes, and predict future trends. This knowledge is crucial for crafting policies aimed at reducing carbon emissions, enhancing carbon storage, and promoting sustainable practices. The carbon cycle's interplay with climate systems, ecosystems, and human activities underscores its importance in maintaining a stable and healthy planet.
In-depth exploration of the carbon cycle reveals the delicate balance required to sustain life and the urgent need to address anthropogenic influences. Through research, education, and policy, we can work towards restoring equilibrium in the carbon cycle and ensuring a sustainable future for generations to come.
Natural farming @ Dr. Siddhartha S. Jena.pptxsidjena70
A brief about organic farming/ Natural farming/ Zero budget natural farming/ Subash Palekar Natural farming which keeps us and environment safe and healthy. Next gen Agricultural practices of chemical free farming.
Characterization and the Kinetics of drying at the drying oven and with micro...Open Access Research Paper
The objective of this work is to contribute to valorization de Nephelium lappaceum by the characterization of kinetics of drying of seeds of Nephelium lappaceum. The seeds were dehydrated until a constant mass respectively in a drying oven and a microwawe oven. The temperatures and the powers of drying are respectively: 50, 60 and 70°C and 140, 280 and 420 W. The results show that the curves of drying of seeds of Nephelium lappaceum do not present a phase of constant kinetics. The coefficients of diffusion vary between 2.09.10-8 to 2.98. 10-8m-2/s in the interval of 50°C at 70°C and between 4.83×10-07 at 9.04×10-07 m-8/s for the powers going of 140 W with 420 W the relation between Arrhenius and a value of energy of activation of 16.49 kJ. mol-1 expressed the effect of the temperature on effective diffusivity.
UNDERSTANDING WHAT GREEN WASHING IS!.pdfJulietMogola
Many companies today use green washing to lure the public into thinking they are conserving the environment but in real sense they are doing more harm. There have been such several cases from very big companies here in Kenya and also globally. This ranges from various sectors from manufacturing and goes to consumer products. Educating people on greenwashing will enable people to make better choices based on their analysis and not on what they see on marketing sites.
WRI’s brand new “Food Service Playbook for Promoting Sustainable Food Choices” gives food service operators the very latest strategies for creating dining environments that empower consumers to choose sustainable, plant-rich dishes. This research builds off our first guide for food service, now with industry experience and insights from nearly 350 academic trials.
2. How Many People Can the Earth Support?
• We do not know how long we can continue
increasing the earth’s carrying capacity for humans
without seriously degrading the life-support system
that keeps us and many other species alive.
U.S. and World Population Clock
• https://www.census.gov/popclock/
3. Human Population Growth Continues but It
Is Unevenly Distributed (2)
• Population growth in developing countries is
increasing 9 times faster than developed countries
by 2050
• 95% of growth in developing countries and will
probably reach 7.5-10.8 billion people
• Carrying capacity is the maximum population that a
given area can sustain.
• Carrying capacity of human is the maximum number of
people who could live in reasonable freedom and comfort
indefinitely, without decreasing the ability of the earth to
sustain future generations.
4. Reasons for human population increase
1. Movement into new habitats and climate zones
2. Early and modern agriculture methods
3. Control of infectious diseases through
• Sanitation systems
• Antibiotics
• Vaccines
• Health care
• Most population growth occurred over last 100 years
due to drop in death rates
• Growing at a rate of 1.21% per year
9. Science Focus: Projecting Population Change
• Why range of 7.8-10.8 billion for 2050?
• Too many factors to consider
• Demographers must:
1. Determine reliability of current estimates
2. Make assumptions about fertility trends
3. Deal with different databases and sets of
assumptions
11. Fig. 6-B, p. 129
Natural Capital Degradation
Altering Nature to Meet Our Needs
Reducing biodiversity
Increasing use of net primary
productivity
Increasing genetic resistance in
pest species and disease-causing
bacteria
Eliminating many natural
predators
Introducing harmful species into
natural communities
Using some renewable resources
faster than they can be replenished
Disrupting natural chemical cycling
and energy flow
Relying mostly on polluting and
climate-changing fossil fuels
12. What Factors Influence the Size of the
Human Population?
• Population size increases because of births and
immigration, and decreases through deaths and
emigration.
• The average number of children born to women in a
population (total fertility rate) is the key factor that
determines population size.
13. The Human Population Can Grow,
Decline, or Remain Fairly Stable
• Population change
• Births: fertility
• Deaths: mortality
• Migration
• Population change =
(births + immigration) – (deaths + emigration)
• Crude birth rate: # live births/1000/year
• Crude death rate: # deaths/1000/year
14. Women Having Fewer Babies but Not Few
Enough to Stabilize the World’s Population
• Fertility rate
• number of children born to a woman during her
lifetime
• Replacement-level fertility rate
• Average number of children a couple must have to
replace themselves
• 2.1 in developed countries
• Up to 2.5 in developing countries
• Total fertility rate (TFR)
• Average number of children born to women in a
population
18. Several Factors Affect Birth Rates and
Fertility Rates
• Factors that affect birth and fertility rates
• Children as part of the labor force
• Cost of raising and educating children
• Availability of private and public pension
• Urbanization
• Educational and employment opportunities for women
• Average age of a woman at birth of first child
• Availability of legal abortions
• Availability of reliable birth control methods
• Religious beliefs, traditions, and cultural norms
20. Several Factors Affect Death Rates (1)
• Life expectancy
• Average number of years a newborn infant can be
expected to live
• Infant mortality rate
• Number of live births that die in first year
• People are living longer
• Increased food supply and distribution
• Better nutrition
• Medical advances
• Improved sanitation
21. Several Factors Affect Death Rates (2)
• High infant mortality rate is a measure of a country’s
quality of life
• U.S. is 54th in world for infant mortality rate
• U.S. infant mortality rate high due to
• Inadequate health care for poor women during
pregnancy and their infants
• Drug addiction among pregnant women
• High birth rate among teenagers
24. Migration Affects an Area’s Population
Size
• Migration
• The movement of people into (immigration) and out
of (emigration) specific geographic areas
• People migrate for many reasons i.e.
• Economic improvement
• Religious freedom
• Political freedom
• Wars
• Environmental refugees
25. A Population’s Age Structure Helps Us
Make Projections
• Age structure
• Numbers or percentages of males and females in
young, middle, and older age groups in a population
• Categories:
• Pre-reproductive ages (0-14)
• Reproductive ages (15-44)
• Post-reproductive ages (45 and older)
26. Fig. 6-12, p. 136
Generalized Population Age-Structure Diagrams
27. Fig. 6-13, p. 136
Population Structure by Age and Sex in Developing and
Developed Countries
29. Populations Made Up of Mostly Older
People Can Decline Rapidly
• Consequences of a large aging population
• Slow decline
• Manageable
• Rapid decline
• Severe economic problems
• How pay for services for elderly
• Proportionally fewer young people working
• Labor shortages
• Severe social problems
30. Fig. 6-15, p. 138
Some Problems with Rapid Population Decline
31. How Can We Slow Human Population
Growth?
• We can slow human population growth by reducing
poverty, elevating the status of women, and
encouraging family planning.
32. As Countries Develop, Their Populations
Tend to Grow More Slowly
• Demographic transition
• As countries become industrialized and economically
developed:
• First death rates decline
• Then birth rates decline
• Takes place in 4 stages
1. Preindustrial
2.Transitional
3.Industrial
4.Postindustrial
33. Fig. 6-17, p. 140
Four Stages of the Demographic Transition
34. Fig. 6-18, p. 140
TFR in Bangladesh and U.S., 1800-2010
35. What’s Behind Population Growth
• Three Factors
• Fertility
• Infant Mortality
• Longevity
• Animal Domestication
and Agriculture
• Provided for a few to feed
many
• Industrial Revolution
• Growth of Cities and
Infrastructure
• Water
• Energy
• Transportation
• Increased Productivity
• Nutrition
• Sanitation
• Medicine
36. Human Population Growth and the Environment
• Human Population - An Explosive Growth
• Human Needs - Limited Resources
• Our Natural Environment Under Attack
• Roles of Technology and Engineering
• An Uncertain Future
37. Environmental Impacts of population growth
Resource Limits - Land (7)
• Deforestation:
Deforesting to acquire
more arable land
• Would run out in next
century at current
yields
• Probably need to
double yields
38. Resource Limits - Water (8)
• In 1950 people used
half of accessible
water
• Are now dependent
on dams
• Pollution loses 33% of
potential water
• Getting close to limits
39. Energy Consumption (9)
• Energy growth
very high last
fifty years
• Mostly
hydrocarbon
fuels
• Nonrenewable
resource
consumption
and climate
change issues
40. Planet Earth is Impacted (12)
• Ecological Footprints
• United States - 5 hectares/person
• Developing nations - 0.5 hectare/person
• For everyone to live at today’s US footprint would
require 3 planet Earths
• Increasing affluence and population is damaging
Earth’s essential ecology
41. Biodiversity is in Danger (13)
• Humanity has spawned a species extinction to rival
the 5 great extinctions of 65 - 440 million years ago
• Recovery times from the great extinctions took 10’s
of millions of years
• Biodiversity is essential to life on Earth
42. Global Warming - A Good Example
• Atmospheric CO2 is increasing, and creates
greenhouse effect.(14)
• 3-5°C rise predicted by computer models for
this century would have major environmental
impact. (15)
• Observed change of 0.25-0.4°surface and 0.0-
0.2°C troposphere rise in last 20 years doesn’t
agree with models and may or may not be due
to CO2.(16)
• Humans - 6 billion tons/year of CO2 (up 500%
from 1950, and increasing) (17)
• Other sources 200B tons/year
• Total atmosphere load - 775B tons
• Total earth load with oceans - 42,000B tons
0.6°C rise in last 100
years
43. Our ‘Commons’ are in Danger
• Atmospheric pollution and climate change
• Water pollution, including ground aquifers
• Deforestation and loss of oxygenation
• The oceans, coral reefs and their bounty
• National parks, wildernesses and wetlands
• Nonrenewable natural resource depletion
• Fossil fuels, mineral ores, topsoil…..
44. Impacts
Developed and Developing countries have different impacts
most of the world lives in developing countries, but developed
countries consume more resources
ecological footprints and wealth gap
Affluence
Measure Impact using IPAT equation
Impact= population x affluence x technology
As a population grows resources need to be available to meet
the needs of the people
land use (housing and agriculture)
Sanitation and health care
Access to clean water
45. Solutions: Technology’s Roles
• Detailed explicit information and understanding of what
is occurring
• Sensors, data processing, computers, models,
predictions, communication, information…...
• Alternate technologies that mitigate and eliminate
deleterious effects
• Energy, water, transportation, communication…
• Sustainable Development
46. Engineers are vital
• Developing and applying
• the means by which to measure, analyze and predict
future conditions
• the technologies by which to mitigate and eliminate
undesired effects
• Describing, explaining and communicating
• To policy makers
• To the non-technical public
• Creating the framework for a sustainable
environment
47. More Solutions for slowing
population growth
• economic development
• reduction of poverty
• Education
• family planning
• reproductive health care
• empowering women
48. 4
8
family planning
helps couples choose how many children to have and when to have
them
educating men and women
birth spacing, birth control, health care for women and infants
the older a women is when she has her first child will decrease the
total number of children
reduces number of pregnancies and abortions (major decrease in
TFR)
lack of access to services hinders efforts
49. Problems with a growing
population
• “graying of a population” (Japan)
• Characteristic of highly developed countries
• Women choosing not to have children..pursue career instead
• who will care for the elders?
• income to provide for social services
• economic impacts (smaller workforce)
• some countries providing incentives to have more children
(Europe)
• may be balanced out with a large number of immigrants
50. Summary
• Major increases are occurring in human population
and affluence.
• Major stresses result in our society, natural
environment, and ecology.
• Technology and engineering are central to the
creation and the mitigation of problems.
• Predicting the future is difficult (17). The next twenty
five to fifty years will be decisive.
Editor's Notes
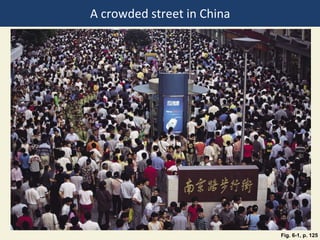
Figure 6.1: Hundreds of people crowd a street in China. Almost one of every five persons on the planet lives in China, and the country’s resource use per person is projected to grow rapidly as China becomes more modernized and wealthy.
Figure 1.18: Exponential growth: The J-shaped curve represents past exponential world population growth, with projections to 2100 showing possible population stabilization as the J-shaped curve of growth changes to an S-shaped curve. (This figure is not to scale.) (Data from the World Bank and United Nations, 2008; photo L. Yong/UNEP/Peter Arnold, Inc.)
Figure 6.3: Most of the world’s population growth between 1950 and 2010 took place in the world’s less-developed countries. This gap is projected to increase between 2010 and 2050. (Data from United Nations Population Division, The 2008 Revision and Population Reference Bureau, 2010 World Population Data Sheet)
Figure 6.4: This chart shows the populations of the world’s five most populous countries in 2010 and 2050 (projected). In 2010, more than one of every three persons on the earth lived in China (with 19% of the world’s population) or India (with 17%). (Data from United Nations Population Division)
Figure 6.A: This graph shows world population projections to 2050 from three different organizations: the UN, the U.S. Census Bureau, and IIASA. Note that the upper-most, middle, and lower-most curves of these five projections are all from the UN, each assuming a different level of fertility.
Figure 6.B: This list describes eight major ways in which we humans have altered natural systems to meet our growing population’s resource needs and wants.
Figure 6.5: This graph tracks the total fertility rate for both the more-developed and less-developed regions of the world, 1955–2010, with projections to 2050 (based on medium population projections). Although the world’s average TFR has dropped to 2.5, it will have to drop to around 2.1 to eventually halt the world’s population growth. (Data from United Nations Population Division)
Figure 6.9: These young girls are child laborers in the state of Rajasthan in India. They are weaving wool on looms to make carpets for export, and receive very little money for their work.
Figure 6.10: This graph tracks the infant mortality rates for the world’s more-developed countries and less-developed countries, 1950–2010, with projections to 2050 based on medium population projections. (Data from United Nations Population Division)
Figure 6.12: This chart represents the generalized population age-structure diagrams for countries with rapid (1.5–3%), slow (0.3–1.4%), zero (0–0.2%), and negative (declining) population growth rates. A population with a large proportion of its people in the prereproductive age group (far left) has a significant potential for rapid population growth. See an animation based on this figure at CengageNOW. Question: Which of these diagrams best represents the country where you live? (Data from Population Reference Bureau)
Figure 6.13: Global outlook: These charts illustrate population structure by age and sex in less-developed countries and more-developed countries for 2010. Question: If all girls under 15 were to have only one child during their lifetimes, how do you think these structures would change over time? (Data from United Nations Population Division and Population Reference Bureau)
Figure 6.15: Rapid population decline can cause several problems. Question: Which three of these problems do you think are the most important?
Figure 6.17: The demographic transition, which a country can experience as it becomes industrialized and more economically developed, can take place in four stages. See an animation based on this figure at CengageNOW. Question: At what stage is the country where you live?
Figure 6.18: This graph tracks demographic transition in terms of the average lifetime number of births per woman (TFR) in Bangladesh and in the United States, 1800–2010. Question: What role do you think economic development has played in the different paths that these two countries have taken toward making a demographic transition? (Data from Population Reference Bureau, World Population Data Sheet 2009 and 2010; Bangladesh: United Nations Demographic and Heath Surveys; United States: Ansley Coale and Melvin Zeinik and National Center for Health Statistics)