Download as PDF, PPTX


![{
%%rows:%[
%%{
%%%%x:%0,
%%%%y:%0,
%%%%vals:%[2],
%%%%dates:%[457]
%%},
%%{
%%%%x:%1,
%%%%y:%0,
%%%%vals:%[1,1,4],
%%%%dates:%[2,3,4]
%%%%}
%%]
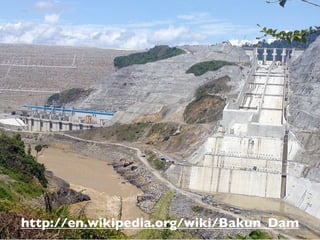
}](https://image.slidesharecdn.com/bigdatafromspacepdf-130605102300-phpapp02/85/Global-deforestation-through-time-Presentation-at-ESA-37-320.jpg)
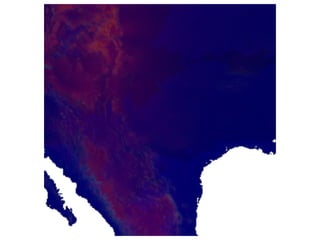
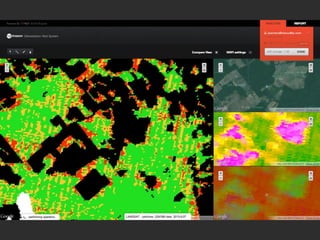
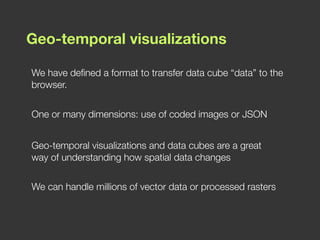

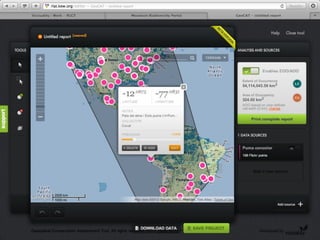
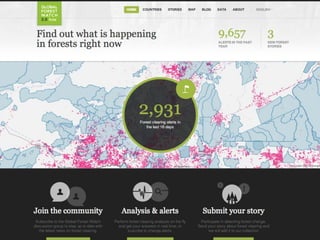
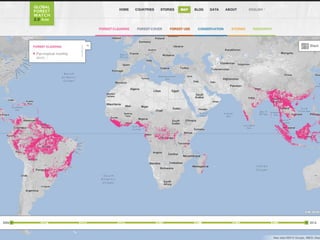
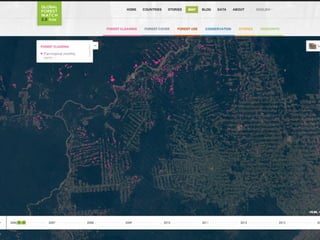
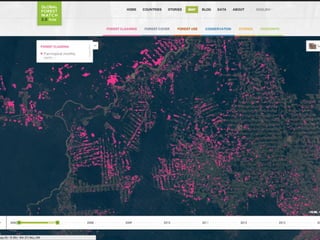
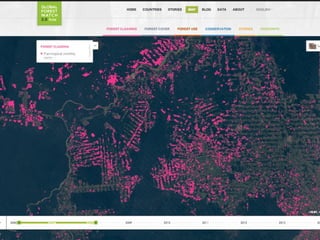
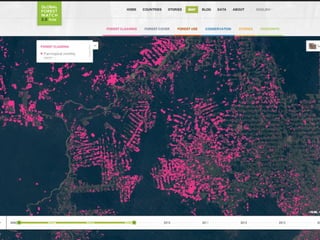
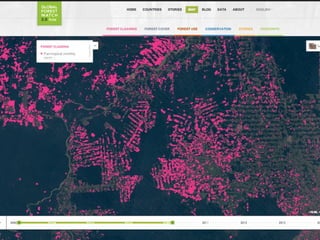
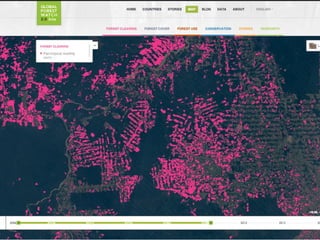
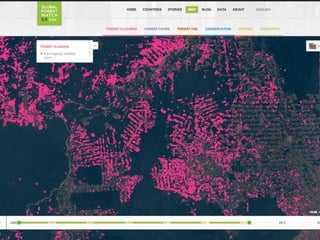
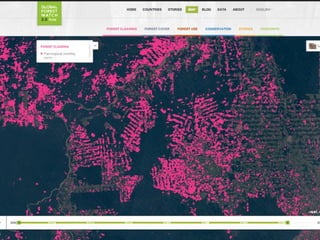
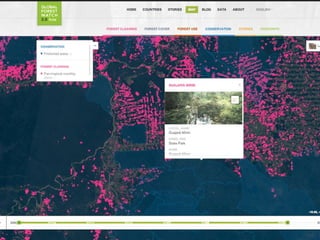
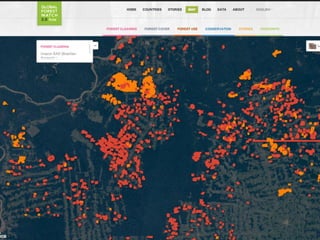
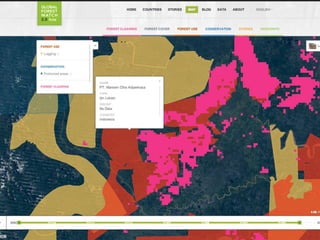
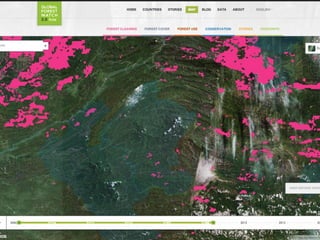
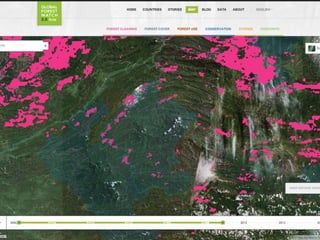
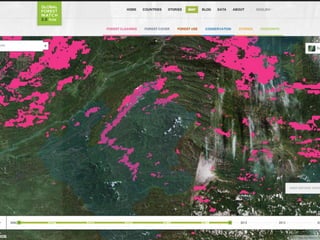
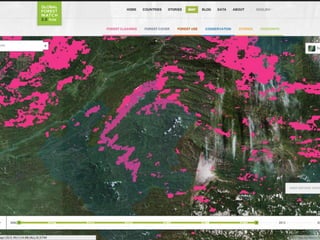
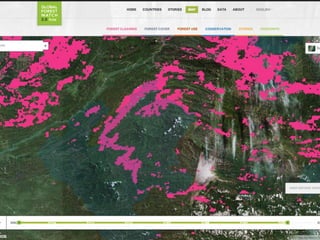
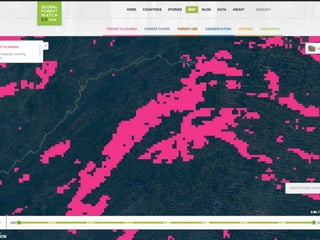
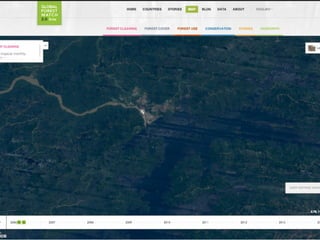
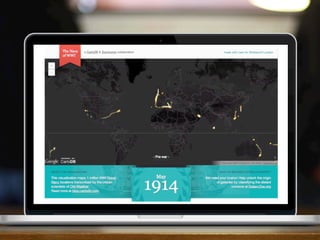
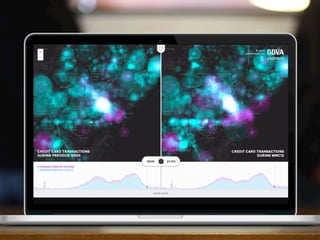
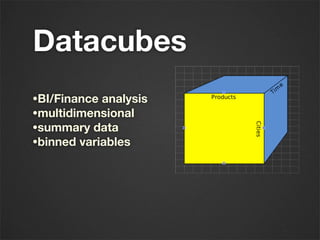
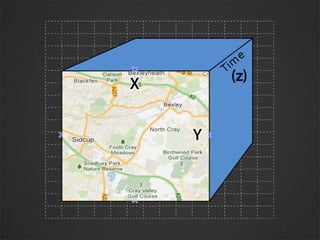
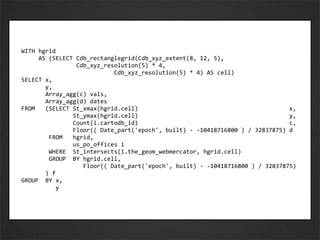
The document discusses using CartoDB and Torque to create geo-temporal visualizations of global deforestation over time using big data. It describes how datacubes can be used to analyze and summarize multidimensional data binned by variables. The document provides an example of aggregating postal office location and construction date data into a grid to visualize counts and dates over space and time in a compact JSON format that can be transferred to a browser. Geo-temporal visualizations and data cubes allow understanding how spatial data changes over millions of records.


![Deforestation Powerpoint[1]](https://cdn.slidesharecdn.com/ss_thumbnails/deforestationpowerpoint1-1223304643711663-9-thumbnail.jpg?width=640&height=640&fit=bounds)