Downloaded 169 times

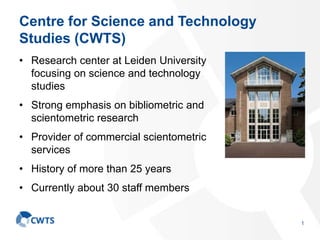
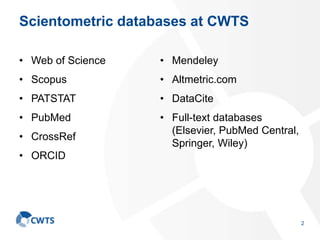
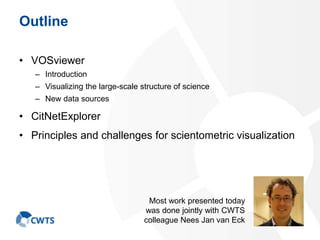
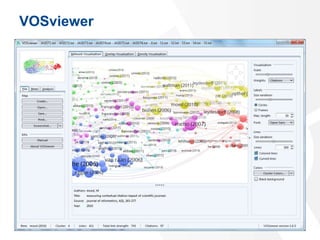
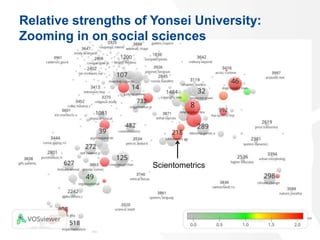
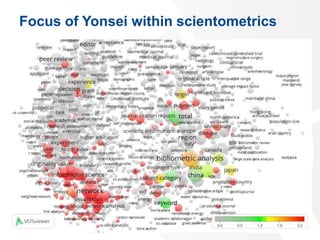
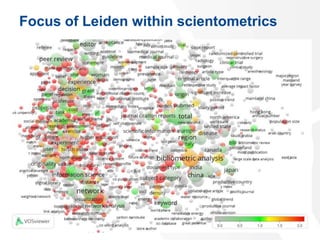
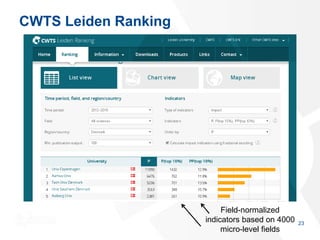

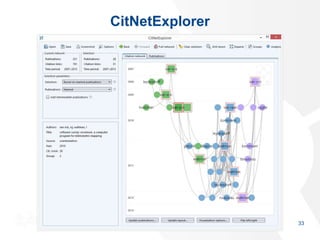

The document discusses bibliometric visualization techniques using VOSviewer, developed by the Centre for Science and Technology Studies at Leiden University. It highlights the center's expertise in scientometric research, its collaboration with various databases, and the introduction of new data sources for enhanced visualization. Key challenges and principles for effective scientometric visualization are also outlined.


![谷歌留痕技术 [ 𝙩𝙤𝙥 𝟮𝟯𝟯. 𝙘 𝙤𝙢 ]](https://cdn.slidesharecdn.com/ss_thumbnails/top233-260130174328-3833018c-thumbnail.jpg?width=640&height=640&fit=bounds)


