Download as PDF, PPTX
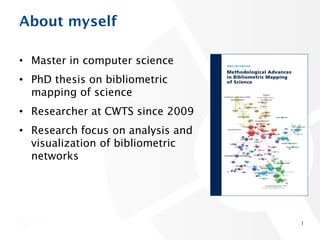
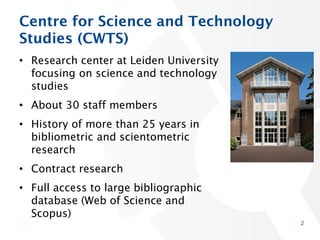
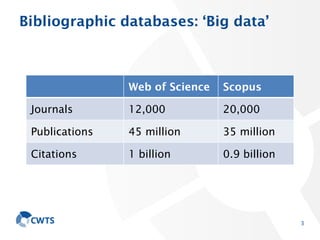
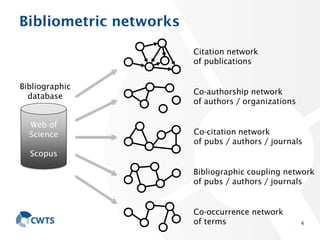
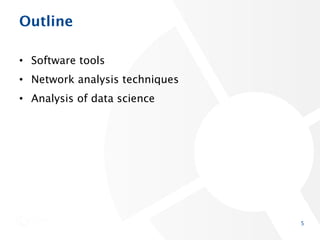

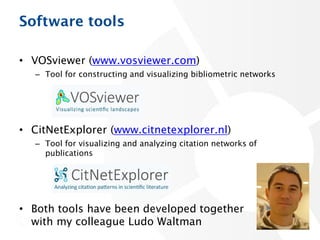
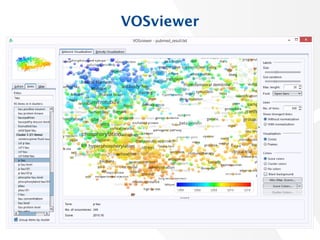
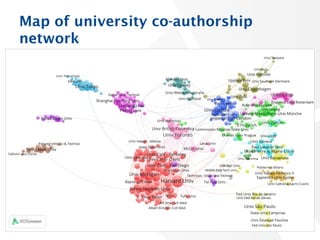
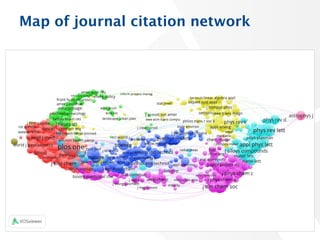
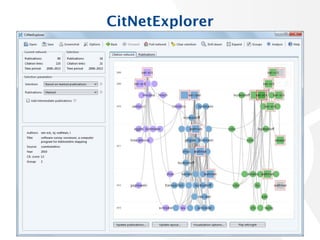

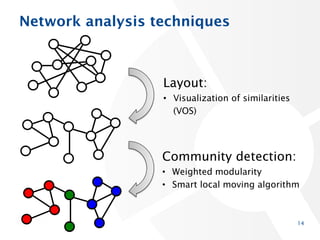
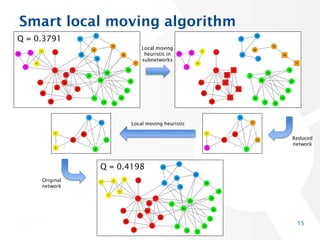
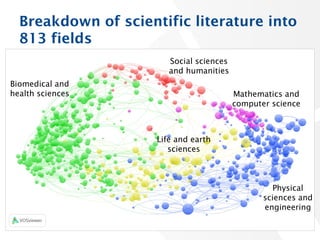
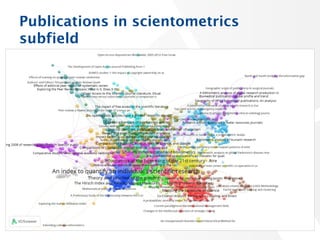
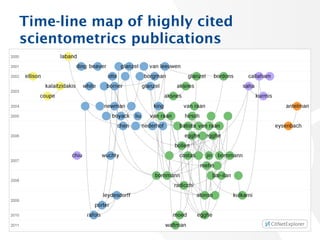

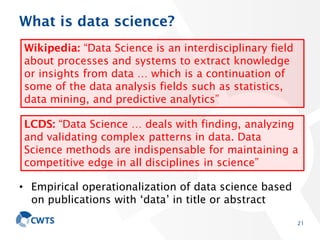
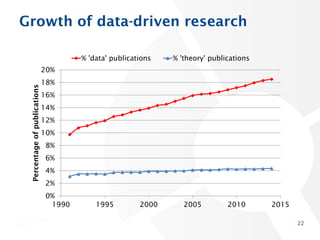

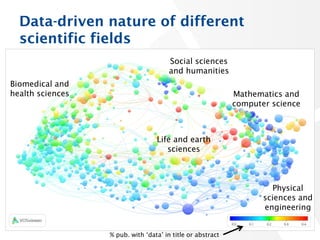
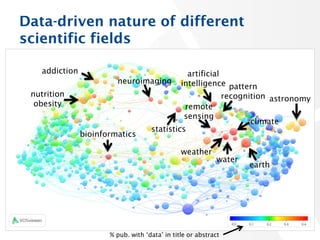
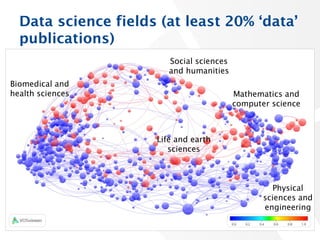
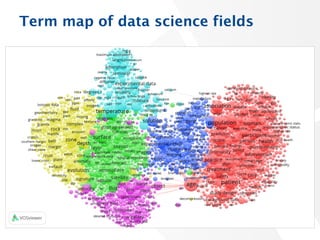
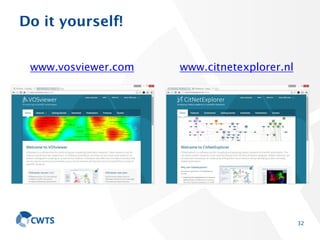

This document summarizes a presentation about analyzing large bibliometric data sources. It discusses the speaker's background in bibliometrics and their research center CWTS. CWTS has access to large bibliographic databases and focuses on bibliometric and scientometric research. Software tools for constructing and analyzing bibliometric networks are described, including VOSviewer and CitNetExplorer which were developed by the speaker. Network analysis techniques like community detection and layout algorithms are also covered. Finally, the document analyzes the field of data science using bibliometric methods by identifying publications related to data and mapping the growth and structure of data-driven research fields.


![谷歌留痕技术 [ 𝙩𝙤𝙥 𝟮𝟯𝟯. 𝙘 𝙤𝙢 ]](https://cdn.slidesharecdn.com/ss_thumbnails/top233-260130174328-3833018c-thumbnail.jpg?width=640&height=640&fit=bounds)


