Downloaded 559 times


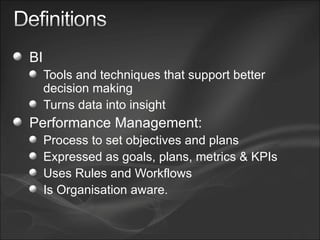
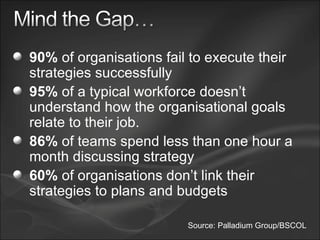

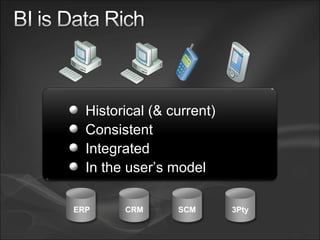


The document discusses business intelligence (BI) tools and techniques that support better decision making. It notes that 90% of organizations fail to execute strategies successfully and 95% of employees do not understand how organizational goals relate to their jobs. It then provides examples of different types of BI tools, including reporting, analyzing, forecasting, and planning tools. These tools use data from sources like ERP, CRM, and SCM systems to turn data into insights. Dimensional data models and online analytical processing (OLAP) are discussed as traditional BI techniques.


![How Microsoft Secures its Online Services [WHITEPAPER]](https://cdn.slidesharecdn.com/ss_thumbnails/microsoftonlinesecurity-100122154531-phpapp01-thumbnail.jpg?width=640&height=640&fit=bounds)


