This study used computational methods to predict the UV-vis absorption spectra of anthocyanin molecules under different pH conditions and with/without water solvent. Calculations showed that increasing pH decreased excitation energy, causing absorption in the visible region, while decreasing pH dramatically increased excitation energy, shifting absorption to the ultraviolet region. Adding an implicit water solvent also impacted the predicted spectra, with absorption maximum shifting to shorter wavelengths. Understanding these structure-property relationships could help optimize anthocyanins for applications in solar energy conversion.
FT-NIR as a real-time QC tool for polymer manufacturingGalaxy Scientific
Near infrared spectroscopy has been used widely in the polymer industry. Compared to traditional methods such as wet chemistry and chromatographic methods, NIR spectroscopy provides considerable advantages in process and quality control applications through fundamental benefits such as low to no cost of consumables such as solvents, columns, reagents; real time analysis - generally less than 10 seconds measurement time; multiple components per analysis; elimination of sample preparation time; and elimination of many sources of systematic error.
This presentation will present three FT-NIR polymer applications: 1) at line polyether polyols’ hydroxyl value analysis; 2) real time isocyanate number monitoring during a polyurethane reaction; and 3) off-line quality control of percentage styrene in styrene copolymers.
Nanoscale IR spectroscopy (AFM-IR Spectroscopy)bungasirisha
Nanoscale IR spectroscopy or AFM-IR spectroscopy is type of hyphenated techniques in the field of analytical chemistry where it is useful for both chemical and structural analysis of the compound with resolution at Nano level. It combines the advantages of the microscope with spectral characteristics of IR spectroscopy. We can Correlate microscopy with spectroscopy and can interpret the data to FTIR also.
Complete detail about the Radiopharmaceutical, General Introduction, Radioactive substance, Radioactive rays like alpha, beta and gamma rays. All the Measurement method to determine the radioactivity of any element and widely used instrument Geiger Muller Counter. And some Radiopharmaceutical product used in many diagnosis , treatment such like sodium iodide solution & capsule, Rose Bengal I 131 and Application of Radiopharmaceuticals.
Presented by Yonas Asmare, ILRI, at the Workshop on Identifying Investment Opportunities for Livestock Feed Resources Development in the Eastern Africa Sub-Region, ILRI Addis, 13–15 December 2017
Carlos Afonso, Université de Rouen, Laboratoire COBRA, Plateau technique C2iorga
In this presentation, Carlos Afonso describes the analysis of polymers and petroleum by ion mobility mass spectrometry and utilises novel sample introduction techniques such as the Atmospheric Solids Analysis Probe (ASAP).
A sensor that integrates a biological element with a physiochemical transducer to produce an electronic signal proportional to a single analyte which is then conveyed to a detector.
1. I would like to thank the department of Chemistry and
Biochemistry, the McNair Scholar’s Program, and Dr. Jarvis for their
support and guidance.
1Margalit, Yair, Ph.D. Concepts in Wine Chemistry. Third ed. San
Francisco, CA: Wine Appreciation Guild, 2004. 127. Print.
Acknowledgements
References
Computational Predictions of UV-vis Spectra of Anthocyanin Molecules
Kevin Calvelo and Emily Jarvis, Ph. D.
Department of Chemistry and Biochemistry at Loyola Marymount University
Discussion
Conclusion & Future Work
Abstract Materials & Methods
Background
Results
Anthocyanins are pigments found in plants that serve both as
sunblock and antioxidant, protecting plants against reactive oxygen
species that can damage cells. These molecules are of interest due
to their ability to convert light energy into electronic energy and
they display dramatic absorption spectra for wavelengths in the UV
and visible region of the electromagnetic spectrum. Our
calculations showed some sensitivity to the inclusion of implicit
water solvent effects and dramatic impact according to the pH. For
example, in comparing the anthocyanin malvidin with and without
a water solvent, the maximum absorbance wavelength decreased
from 496 nm to 473. In addition, a general malvidin molecule has
an excitation energy of 499 nm with a broad peak over the visible
region in its UV-vis spectra. Under more basic pH conditions, the
predicted excitation wavelength increases from 499 nm to 518 nm.
Conversely, under more acidic conditions, the excitation energy
increases dramatically with the peak wavelength shifting from 499
nm to 279 nm. These trends are similar to those observed
experimentally for these forms of malvidin. Understanding the
relationship between the chemical structure and the calculated
electronic properties of these anthocyanins could aid the predictive
optimization of their UV-vis absorption properties for use as
photosensitizers in dye-sensitized solar cells.
• Anthocyanins are pigments found in plants that serve both as
sunblock and antioxidant, protecting plants against reactive
oxygen species that can damage cells.
• These molecules are of interest due to their ability to convert
light energy into electronic energy.
• Understanding the relationship between the chemical structure
and the calculated electronic properties of these anthocyanins
could aid the predictive optimization of their UV-vis absorption
properties for use as photosensitizers in dye-sensitized solar
cells.
Computational methods:
• Employed computational methods such as the Density
Functional Theory (DFT) and the Time-Dependent Density
Functional Theory (TD-DFT)
• DFT was used to calculate the ground state wavefunction.
• TD-DFT was used to predict the UV-vis absorption spectra with
different R-groups and under different pH conditions
• Software program used: Gaussian 09
• Basis set used: 6-31g (d,p)
• Exchange correlation potential: B3LYP
• Implicit water solvent
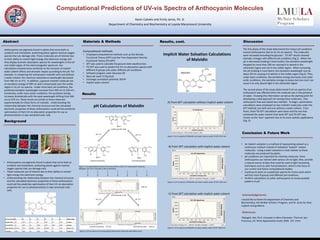
The first phase of this study determined the impact pH conditions
around anthocyanins had on its UV-vis spectra. The molecules
were recreated excluding the glucose1. TD-DFT results showed
dramatic changes with different pH conditions (Fig.1). When the
pH is decreased (making it more acidic), the excitation wavelength
dropped by more than 200 nm causing it to absorb in the
ultraviolet region and not in the visible region. When increasing
the pH (making it more basic), the excitation wavelength rose by
about 20 nm causing it to absorb in the visible region (Fig.2). Thus,
under basic conditions, the excitation energy decreases and under
acidic conditions, the excitation energy increases but too much can
cause it to only absorb light in the ultraviolet region.
The second phase of the study determined if UV-vis spectra of an
anthocyanin was affected when the molecule was in the presence
of water. Knowing this information served as the starting point for
developing a solid approach for testing these molecules. One
anthocyanin that was tested was malvidin. To begin, optimization
calculations were employed on two malvidin molecules under the
DFT method, one with and one without a water solvent. From
there, three TD-DFT calculations were done and the one that
contained the water solvent from both DFT and TD-DFT was
chosen as the ‘best’ approach due to its more realistic applications
(Fig. 5).
• An implicit solvation is a method of representing solvent as a
continuous medium instead of individual “explicit” solvent
molecules. Using a water solvation is most realistic as these
molecules are produced by plants.
• pH conditions are important for intensity measures. Since
anthocyanins can interact with various UV-vis light, they provide
a natural source of dyes that could be used in light harvesting
techniques such as solar fuel production, which is the focus of
our current and future computational studies.
• Continue to work on a predictive spectra for future work which
will test more R-groups and different pH conditions.
• Perform calculations on other anthocyanins to reveal possible
patterns in pH.
Anthocyanidin R1 R2 R3 R4 R5 R6 R7 main color
Apigeninidin -H -OH -H -H -OH -H -OH orange
Aurantinidin -H -OH -H -OH -OH -OH -OH orange
Capensinidin OCH3 -OH OCH3 -OH OCH3 -H -OH bluish-red
Cyanidin -OH -OH -H -OH -OH -H -OH magenta
pH: 4.3pH: 2.6
pH: 4.3pH: 2.6
Anthocyanidin (red)
Quinodal (purple)Carbinol (colorless)
Anthocyanidin (red)
Quinodal (purple)Carbinol (colorless)
Results, cont.
Malvidin
Figure 4: UV-vis spectra of Malvidin w/o water solvent under TD-DFT (495 nm).
Figure 3: UV-vis spectra of Malvidin w/o water solvent under TD-DFT (473 nm).
Figure 5: UV-vis spectra of Malvidin w/ water solvent under TD-DFT (460 nm).
C) From DFT calculation with implicit water solvent
Figure 1: Corresponding theoretical pH values with its color of an anthocyanin molecule.
(Margalit, Yair, Ph.D. Concepts in Wine Chemistry).
Figure 2: UV-vis spectra of corresponding anthocyanin molecules with different pH.
279 nm 518 nm
499 nm
B) From DFT calculation with implicit water solvent
A) From DFT calculation without implicit water solvent
Implicit Water Solvation Calculations
of Malvidin
pH Calculations of Malvidin