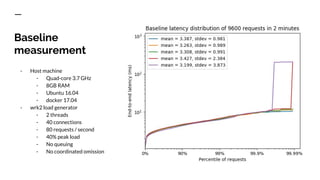
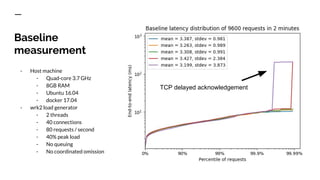
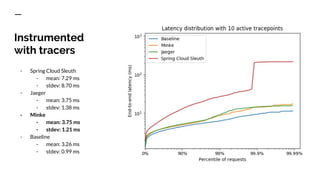
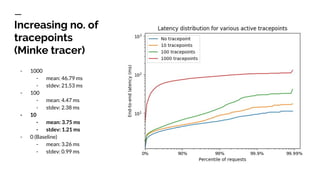
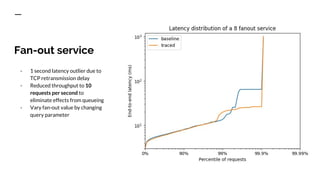
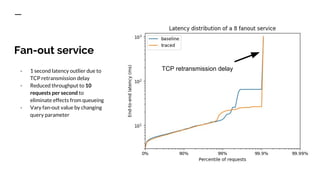
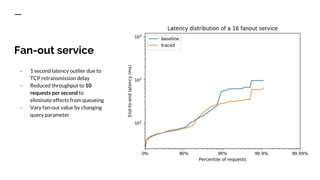
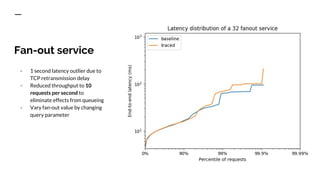
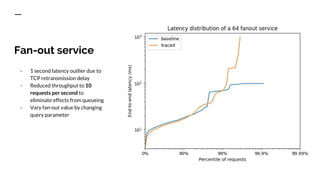
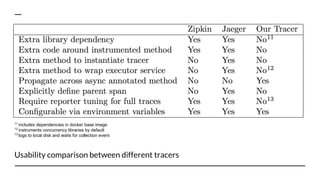
Benchmarking
distributed tracers
Han Qiao
Imperial College London
What is tracing?
- Follows a web request along its
critical path
- Records runtime parameters
that contribute to high latency
Source: Zipkin.io
Motivation
- Current web architecture makes
tail latency issues pervasive and
difficult to diagnose
- Microservice
architecture
- Asynchronous RPCs
Source: The Tail at Scale by Jeff Dean
Benchmark
Application
- EchoService
- Acts as a database
- HelloService
- Concatenates results
from 3 requests to
EchoService
- All requests are
asynchronous
- Written as Spring Boot
applications and deployed on
docker swarm
Methodology
- Single host
- Baseline measurement
- Minimize network fluctuation
- Measure instrumentation overhead only
- Multi-node cluster
- More realistic to real world deployment
- Load balanced service (replicas)
- Fan-out service (search engine)
Baseline
measurement
- Host machine
- Quad-core 3.7 GHz
- 8GB RAM
- Ubuntu 16.04
- docker 17.04
- wrk2 load generator
- 2 threads
- 40 connections
- 80 requests / second
- 40% peak load
- No queuing
- No coordinated omission
Baseline
measurement
- Host machine
- Quad-core 3.7 GHz
- 8GB RAM
- Ubuntu 16.04
- docker 17.04
- wrk2 load generator
- 2 threads
- 40 connections
- 80 requests / second
- 40% peak load
- No queuing
- No coordinated omission
TCP delayed acknowledgement
Instrumented
with tracers
- Spring Cloud Sleuth
- mean: 7.29 ms
- stdev: 8.70 ms
- Jaeger
- mean: 3.75 ms
- stdev: 1.38 ms
- Minke
- mean: 3.75 ms
- stdev: 1.21 ms
- Baseline
- mean: 3.26 ms
- stdev: 0.99 ms
Increasing no. of
tracepoints
(Minke tracer)
- 1000
- mean: 46.79 ms
- stdev: 21.53 ms
- 100
- mean: 4.47 ms
- stdev: 2.38 ms
- 10
- mean: 3.75 ms
- stdev: 1.21 ms
- 0 (Baseline)
- mean: 3.26 ms
- stdev: 0.99 ms
Increasing no. of
tracepoints
(mean latency)
- Enclose instrumented method in
a for loop and vary loop count
- Biased towards logging
and instrumentation
overhead
- 12.5 ms wait time between
every request
- 4.47 ms mean response time @
100 tracepoints (server handles
only one request at a time)
- 46.79 ms mean response time @
1000 tracepoints (combined
effect of higher overhead and
queueing of requests)
Load balanced service
Load balanced
service
- 90% requests complete within
20 ms @ 1000 tracepoints
- 90% requests took more than
50 ms on a single host
- The reduced mean response
time is likely a result of
distributing logging activities
across more nodes
Fan-out service
Fan-out service
- 1 second latency outlier due to
TCP retransmission delay
- Reduced throughput to 10
requests per second to
eliminate effects from queueing
- Vary fan-out value by changing
query parameter
Fan-out service
- 1 second latency outlier due to
TCP retransmission delay
- Reduced throughput to 10
requests per second to
eliminate effects from queueing
- Vary fan-out value by changing
query parameter
TCP retransmission delay
Fan-out service
- 1 second latency outlier due to
TCP retransmission delay
- Reduced throughput to 10
requests per second to
eliminate effects from queueing
- Vary fan-out value by changing
query parameter
Fan-out service
- 1 second latency outlier due to
TCP retransmission delay
- Reduced throughput to 10
requests per second to
eliminate effects from queueing
- Vary fan-out value by changing
query parameter
Fan-out service
- 1 second latency outlier due to
TCP retransmission delay
- Reduced throughput to 10
requests per second to
eliminate effects from queueing
- Vary fan-out value by changing
query parameter
Usability comparison between different tracers
11
includes dependencies in docker base image
12
instruments concurrency libraries by default
13
logs to local disk and waits for collection event
Open source benchmarks
- https://github.com/sweatybridge/spring-jaeger
- https://github.com/sweatybridge/spring-zipkin
- https://github.com/sweatybridge/minke (coming soon)

Benchmarking distributed tracers

  • 1.
  • 2.
    What is tracing? -Follows a web request along its critical path - Records runtime parameters that contribute to high latency Source: Zipkin.io
  • 3.
    Motivation - Current webarchitecture makes tail latency issues pervasive and difficult to diagnose - Microservice architecture - Asynchronous RPCs Source: The Tail at Scale by Jeff Dean
  • 4.
    Benchmark Application - EchoService - Actsas a database - HelloService - Concatenates results from 3 requests to EchoService - All requests are asynchronous - Written as Spring Boot applications and deployed on docker swarm
  • 5.
    Methodology - Single host -Baseline measurement - Minimize network fluctuation - Measure instrumentation overhead only - Multi-node cluster - More realistic to real world deployment - Load balanced service (replicas) - Fan-out service (search engine)
  • 6.
    Baseline measurement - Host machine -Quad-core 3.7 GHz - 8GB RAM - Ubuntu 16.04 - docker 17.04 - wrk2 load generator - 2 threads - 40 connections - 80 requests / second - 40% peak load - No queuing - No coordinated omission
  • 7.
    Baseline measurement - Host machine -Quad-core 3.7 GHz - 8GB RAM - Ubuntu 16.04 - docker 17.04 - wrk2 load generator - 2 threads - 40 connections - 80 requests / second - 40% peak load - No queuing - No coordinated omission TCP delayed acknowledgement
  • 8.
    Instrumented with tracers - SpringCloud Sleuth - mean: 7.29 ms - stdev: 8.70 ms - Jaeger - mean: 3.75 ms - stdev: 1.38 ms - Minke - mean: 3.75 ms - stdev: 1.21 ms - Baseline - mean: 3.26 ms - stdev: 0.99 ms
  • 9.
    Increasing no. of tracepoints (Minketracer) - 1000 - mean: 46.79 ms - stdev: 21.53 ms - 100 - mean: 4.47 ms - stdev: 2.38 ms - 10 - mean: 3.75 ms - stdev: 1.21 ms - 0 (Baseline) - mean: 3.26 ms - stdev: 0.99 ms
  • 10.
    Increasing no. of tracepoints (meanlatency) - Enclose instrumented method in a for loop and vary loop count - Biased towards logging and instrumentation overhead - 12.5 ms wait time between every request - 4.47 ms mean response time @ 100 tracepoints (server handles only one request at a time) - 46.79 ms mean response time @ 1000 tracepoints (combined effect of higher overhead and queueing of requests)
  • 11.
  • 12.
    Load balanced service - 90%requests complete within 20 ms @ 1000 tracepoints - 90% requests took more than 50 ms on a single host - The reduced mean response time is likely a result of distributing logging activities across more nodes
  • 13.
  • 14.
    Fan-out service - 1second latency outlier due to TCP retransmission delay - Reduced throughput to 10 requests per second to eliminate effects from queueing - Vary fan-out value by changing query parameter
  • 15.
    Fan-out service - 1second latency outlier due to TCP retransmission delay - Reduced throughput to 10 requests per second to eliminate effects from queueing - Vary fan-out value by changing query parameter TCP retransmission delay
  • 16.
    Fan-out service - 1second latency outlier due to TCP retransmission delay - Reduced throughput to 10 requests per second to eliminate effects from queueing - Vary fan-out value by changing query parameter
  • 17.
    Fan-out service - 1second latency outlier due to TCP retransmission delay - Reduced throughput to 10 requests per second to eliminate effects from queueing - Vary fan-out value by changing query parameter
  • 18.
    Fan-out service - 1second latency outlier due to TCP retransmission delay - Reduced throughput to 10 requests per second to eliminate effects from queueing - Vary fan-out value by changing query parameter
  • 19.
    Usability comparison betweendifferent tracers 11 includes dependencies in docker base image 12 instruments concurrency libraries by default 13 logs to local disk and waits for collection event
  • 20.
    Open source benchmarks -https://github.com/sweatybridge/spring-jaeger - https://github.com/sweatybridge/spring-zipkin - https://github.com/sweatybridge/minke (coming soon)