Download as PDF, PPTX


![Area of Interest [Port of Singapore]
12/11/18 7
Convex Hull Area
Geohash Area](https://image.slidesharecdn.com/bd2018ibrahim-181211233531/85/Bd-2018-ibrahim-7-320.jpg)


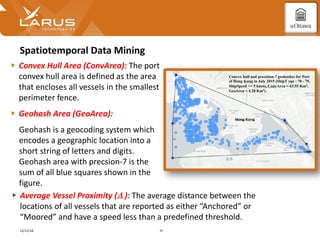


![Port Congestion Indicators (PCI) [1/2]
12/11/18 15
‣ Spatial Complexity (SpComplexity): is calculated after mining the convex
hull area (ConvArea) and the average vessel proximity (D ) as presented in
Algorithm 1 and Algorithm 3.
• i is the hour index from all hours (I) in January and February of 2018.
• G(i) denotes the number of unique geohashes at the ith aggregation period.](https://image.slidesharecdn.com/bd2018ibrahim-181211233531/85/Bd-2018-ibrahim-15-320.jpg)
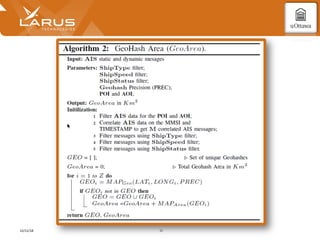
![Port Congestion Indicators (PCI) [2/2]
12/11/18 16
‣ Spatial Density (SpDensity) calculated after mining the convex hull area
(ConvArea) and the Geohash area (GeoArea) as presented in Algorithm 1
and Algorithm 2.
• i is the hour index from all hours (I) in January and February of 2018.](https://image.slidesharecdn.com/bd2018ibrahim-181211233531/85/Bd-2018-ibrahim-16-320.jpg)


The document presents a data-driven approach to forecasting average vessel service time using long short-term memory recurrent neural networks, addressing the challenge of maritime port congestion which leads to financial losses. It introduces various indicators derived from Automatic Identification System (AIS) data, such as spatial complexity and spatial density, to improve disruption management by providing actionable insights for port authorities. The results demonstrate the effectiveness of LSTM models in predicting service times based on mined spatiotemporal characteristics and congestion indicators.


![[DSC Europe 25] Stefan Brankovic - #ResumeIsDead. AI-Powered Interviews and C...](https://cdn.slidesharecdn.com/ss_thumbnails/qnmbsv0xq3uysdrq3sev-2-stefan-brankovic-job-bolt-260114111931-a065aa3d-thumbnail.jpg?width=640&height=640&fit=bounds)
![[DSC Europe 25] Dragan Jerosimovic - The Anatomy of a Narrative Simulation.pdf](https://cdn.slidesharecdn.com/ss_thumbnails/vzputuprdqr6zwbrwdcw-1-dragan-jerosimovic-the-anatomy-of-a-narrative-simulation-260114111931-9d04fba2-thumbnail.jpg?width=640&height=640&fit=bounds)


![[DSC Europe 25] Elena Menshikova - AI-Powered Operational Excellence: Revolut...](https://cdn.slidesharecdn.com/ss_thumbnails/es6nholbqy3zaao2c2yd-2-elena-menshikova-data-ai-in-decision-making-260115093812-4fba8b38-thumbnail.jpg?width=640&height=640&fit=bounds)


![[DSC Europe 25] Mijat Kustudic - Building Financial Intelligence with AI Agen...](https://cdn.slidesharecdn.com/ss_thumbnails/38y2lb5lse6wstegtvas-3-mijat-kustudic-building-financial-intelligence-with-ai-agents-260114111931-1a4783ce-thumbnail.jpg?width=640&height=640&fit=bounds)
![[DSC Europe 25] Ivan Lukovic & Marija Djukic - From Data to Value: Why Maturi...](https://cdn.slidesharecdn.com/ss_thumbnails/ahrfps8xr6knowwhacxh-1-ivan-marija-dsc-2025-ld-v1-presentation-260115093812-be21adfc-thumbnail.jpg?width=640&height=640&fit=bounds)
