Download as PDF, PPTX

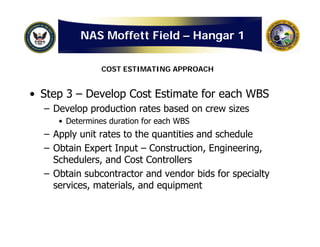
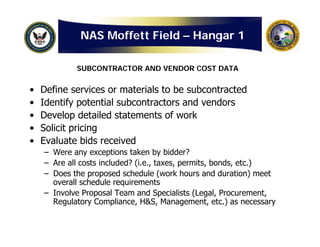
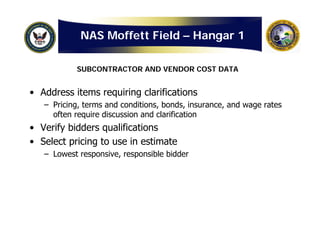
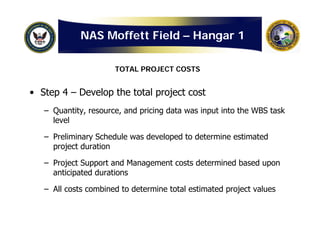
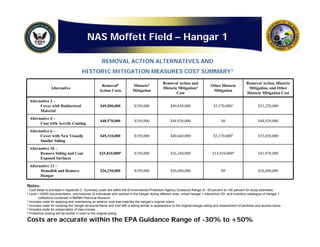
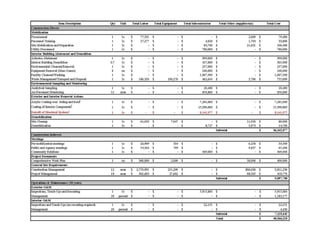

The document provides a detailed cost analysis for Hangar 1 at NAS Moffett Field, highlighting the extensive evaluation process undertaken by the Navy in collaboration with regulatory agencies and NASA. It outlines the cost estimating approach, including remediation and long-term maintenance costs for various alternatives. Each alternative has been analyzed to present a comprehensive total project cost.


