BAYESIAN CLASSIFICATION OF FABRICS USING BINARY CO-OCCURRENCE MATRIX

Classification of fabrics is usually performed manually which requires considerable human efforts. The goal of this paper is to recognize and classify the types of fabrics, in order to identify a weave pattern automatically using image processing system. In this paper, fabric texture feature is extracted using Grey Level Co-occurrence Matrices as well as Binary Level Co-occurrence Matrices. The Co-occurrence matrices functions characterize the texture of an image by calculating how often pairs of pixel with specific values and in a specified spatial relationship occur in an image, and then extracting statistical measures from this matrix. The extracted features from GLCM and BLCM are used to classify the texture by Bayesian classifier to compare their effectiveness.
![International Journal of Information Sciences and Techniques (IJIST) Vol.2, No.2, March 2012
2
The texture analysis has already been applied to fabric recognition but it still cannot recognize all
types of fabrics and textures through the computer vision. Therefore, in the present work an
attempt has been made to recognize fabric based on probabilistic approach. Section II of this
paper provides related work, Section III about the pre processing steps, Section IV describes the
proposed texture classification, Section V provides results and discussion of the proposed work.
A brief Conclusion is given in Section VI.
2. RELATED WORK
The issue of fabric recognition has seen many algorithms based on Grey level Co-Occurrence
Matrix (or) GLCM also known as spatially dependencies matrix and has been known as a
powerful method [1] to represent the textures. Textures can be described as patterns of “non-
uniform spatial distribution” of grey scale pixel intensities. Practical application of GLCM in
image classification and retrieval include iris recognition[2], image Segmentation [3] and CBIR
in videos[4], Allam et. Al [5],citing wezka et al [6],and conners and Haralick [7] achieved a
success rate of approximately 84% by using the extraction and calculation of summary statistics
of the GLCM found in Grey scale images, having an advantage in speed compared with other
methods. Based on the good acceptance of GLCM approaches compared to texture recognition,in
this research,the use of GLCM as the basis for textile recognition.GLCM based texture
recognition have been used in combination with other techniques,including combining its
statistical features with other methods such as genetic algorithms[8]. Another identification
method uses warp and weft floats to determine the weave patterns [9-12]. However, due to
differences in yarn material, count, and density, different fabrics have diverse geometric shapes
for warp and weft floats, that makes the recognition a difficult mission.
For use in colour textures, Avis et al.,[13] have introduced the multispectral variation to the
GLCM calculation that supports multiple colour channels, by separating each pixel’s colour into
RGB space into RGB components and uses pairings of individual colour channels to construct
multiple co-occurrence matrices.
Multispectral co-occurrences matrices are generated by separating each pixel colour into Red,
Green, Blue components.RGB colour space selected as opposed to others such as YUV and HSV
as it yields a reasonable [14] rate of success. The orthogonal polynomial moments for these six
matrices are used as descriptors for the matrices in the place of summary statistics such as
Haralick’s measures.Other approaches to textile recognition includes using regular texel
geometry[15].
3.PRE-PROCESSING
Usually the sample fabric images are not suitable for classification because of various factors,
such as the noise and the lighting variations and requires pre-processing steps.The pre-processing
steps consists of the following digital image processing operations:
• Filtering the image by a median filtering to reduce the
noise.
• Contrast enhancement by histogram
equalization.
• Adjusting the image intensity values.](data:image/gif;base64,R0lGODlhAQABAIAAAAAAAP///yH5BAEAAAAALAAAAAABAAEAAAIBRAA7)
Recommended
Recommended
More Related Content
What's hot
What's hot (18)
Similar to BAYESIAN CLASSIFICATION OF FABRICS USING BINARY CO-OCCURRENCE MATRIX
Similar to BAYESIAN CLASSIFICATION OF FABRICS USING BINARY CO-OCCURRENCE MATRIX (20)
More from ijistjournal
More from ijistjournal (20)
Recently uploaded
Recently uploaded (20)
BAYESIAN CLASSIFICATION OF FABRICS USING BINARY CO-OCCURRENCE MATRIX
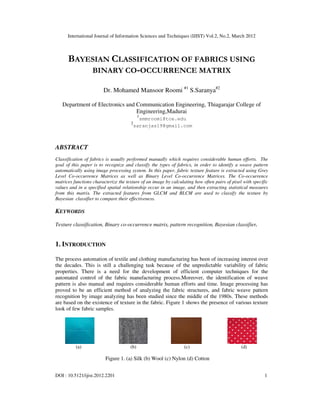
- 1. International Journal of Information Sciences and Techniques (IJIST) Vol.2, No.2, March 2012 DOI : 10.5121/ijist.2012.2201 1 BAYESIAN CLASSIFICATION OF FABRICS USING BINARY CO-OCCURRENCE MATRIX Dr. Mohamed Mansoor Roomi #1 S.Saranya#2 Department of Electronics and Communication Engineering, Thiagarajar College of Engineering,Madurai 1 smmroomi@tce.edu 2 saranjas19@gmail.com ABSTRACT Classification of fabrics is usually performed manually which requires considerable human efforts. The goal of this paper is to recognize and classify the types of fabrics, in order to identify a weave pattern automatically using image processing system. In this paper, fabric texture feature is extracted using Grey Level Co-occurrence Matrices as well as Binary Level Co-occurrence Matrices. The Co-occurrence matrices functions characterize the texture of an image by calculating how often pairs of pixel with specific values and in a specified spatial relationship occur in an image, and then extracting statistical measures from this matrix. The extracted features from GLCM and BLCM are used to classify the texture by Bayesian classifier to compare their effectiveness. KEYWORDS Texture classification, Binary co-occurrence matrix, pattern recognition, Bayesian classifier. 1. INTRODUCTION The process automation of textile and clothing manufacturing has been of increasing interest over the decades. This is still a challenging task because of the unpredictable variability of fabric properties. There is a need for the development of efficient computer techniques for the automated control of the fabric manufacturing process.Moreover, the identification of weave pattern is also manual and requires considerable human efforts and time. Image processing has proved to be an efficient method of analyzing the fabric structures, and fabric weave pattern recognition by image analyzing has been studied since the middle of the 1980s. These methods are based on the existence of texture in the fabric. Figure 1 shows the presence of various texture look of few fabric samples. (a) (b) (c) (d) Figure 1. (a) Silk (b) Wool (c) Nylon (d) Cotton
- 2. International Journal of Information Sciences and Techniques (IJIST) Vol.2, No.2, March 2012 2 The texture analysis has already been applied to fabric recognition but it still cannot recognize all types of fabrics and textures through the computer vision. Therefore, in the present work an attempt has been made to recognize fabric based on probabilistic approach. Section II of this paper provides related work, Section III about the pre processing steps, Section IV describes the proposed texture classification, Section V provides results and discussion of the proposed work. A brief Conclusion is given in Section VI. 2. RELATED WORK The issue of fabric recognition has seen many algorithms based on Grey level Co-Occurrence Matrix (or) GLCM also known as spatially dependencies matrix and has been known as a powerful method [1] to represent the textures. Textures can be described as patterns of “non- uniform spatial distribution” of grey scale pixel intensities. Practical application of GLCM in image classification and retrieval include iris recognition[2], image Segmentation [3] and CBIR in videos[4], Allam et. Al [5],citing wezka et al [6],and conners and Haralick [7] achieved a success rate of approximately 84% by using the extraction and calculation of summary statistics of the GLCM found in Grey scale images, having an advantage in speed compared with other methods. Based on the good acceptance of GLCM approaches compared to texture recognition,in this research,the use of GLCM as the basis for textile recognition.GLCM based texture recognition have been used in combination with other techniques,including combining its statistical features with other methods such as genetic algorithms[8]. Another identification method uses warp and weft floats to determine the weave patterns [9-12]. However, due to differences in yarn material, count, and density, different fabrics have diverse geometric shapes for warp and weft floats, that makes the recognition a difficult mission. For use in colour textures, Avis et al.,[13] have introduced the multispectral variation to the GLCM calculation that supports multiple colour channels, by separating each pixel’s colour into RGB space into RGB components and uses pairings of individual colour channels to construct multiple co-occurrence matrices. Multispectral co-occurrences matrices are generated by separating each pixel colour into Red, Green, Blue components.RGB colour space selected as opposed to others such as YUV and HSV as it yields a reasonable [14] rate of success. The orthogonal polynomial moments for these six matrices are used as descriptors for the matrices in the place of summary statistics such as Haralick’s measures.Other approaches to textile recognition includes using regular texel geometry[15]. 3.PRE-PROCESSING Usually the sample fabric images are not suitable for classification because of various factors, such as the noise and the lighting variations and requires pre-processing steps.The pre-processing steps consists of the following digital image processing operations: • Filtering the image by a median filtering to reduce the noise. • Contrast enhancement by histogram equalization. • Adjusting the image intensity values.
- 3. International Journal of Information Sciences and Techniques (IJIST) Vol.2, No.2, March 2012 3 4. PROPOSED METHOD OF TEXTURE CLASSIFICATION After pre-processing, the features are extracted from the images using BLCM. The extracted features are given to the Bayesian Classifier.Figure 2 shows the flow chart of proposed method of texture classification: Figure 2. Flow chart of proposed method of texture classification 4.1 BLCM FEATURE EXTRACTION A new second order statistical feature to be used in the image retrieval is binary co- occurrence matrix. Suppose that each pixel in an image is represented by 8 bits. Imagine that the image is composed of eight 1-bit planes, ranging from bit-plane 0 for the least significant bit to bitplane 7 for the most significant bit. Figure 3 shows the Bit plane representation of an 8-bit image: Figure 3.Bit plane representation In terms of 8-bit bytes, plane 0 contains all the lowest order bits in the bytes comprising the pixels in the image and plane 7 contains all the high-order bits.Note that the higher-order bits (especially the top four) contain the majority of the visually significant data.The other bit planes contribute to more subtle details in the image.After that,the 5th and 4th bit plane are given as an input to the Co- occurrence matrices for our applications. Input image Pre-processing Feature Extraction Using BLCM Bayesian Classifier Cotton Nylon Silk Wool
- 4. International Journal of Information Sciences and Techniques (IJIST) Vol.2, No.2, March 2012 4 4.2 GLCM FEATURE EXTRACTION The texture may be defined respecting the global properties of an image or the repeating units that compose it. The feature extraction is based on the specific properties of pixels in the image or their texture. In this work gray level co-occurrence matrix extracts the texture from a woven Figure 4. Texture of an image with offset varying in distance and orientation. Two parameters affect the calculation of the co-occurrence matrix [16]; D is the distance between two pixels, and θ, the position angle between two pixels (p,q) and (j,k).Figure 4 shows the four directions for the position angle: the horizontal position θ = 0°, the right diagonal position direction θ = 45°, the vertical direction θ = 90° and the left diagonal direction θ =135°. All the values of the co-occurrence matrices need to be normalized; this step is very importing because without it the results will dropped away.After normalization, the co-occurrence matrices, can be expressed as: ∑∑ = = = N m N n mn mn mn M M C 0 0 (1) Although Haralick defined from these co-occurrence matrices fourteen parameters to analyze textures, we will be satisfied with four descriptive parameters since we noted that these parameters give good results with the proposed classifiers. Table 1 shows the four feature parameters: Parameters Description Contrast Measures the local variation in the Grey level Co-occurrence matrices Correlation Measures the joint probability occurence of the specified pixel pair Angular Second Moment (Energy) Provides the sum of squared elements in GLCM. Also known as Uniformity. Homogeneity Measures the closeness of the distribution of elements in the GLCM to the GLCM diagonal. Table 1. Haralick parameters
- 5. International Journal of Information Sciences and Techniques (IJIST) Vol.2, No.2, March 2012 5 Angular Second Moment ∑∑ − = − = = 1 0 1 0 2 N m N n mn C ASM (2) Contrast ∑∑ − = − = − = 1 0 1 0 2 ) ( N m N n mn c n m CON (3) Correlation mn N m N n y x y x C COR ∑∑ − = − = − − = 1 0 1 0 ) 1 )( 1 ( σ σ µ µ (4) Where ∑∑ − = − = = 1 0 1 0 N m N n mn x mC µ (5) ∑∑ − = − = = 1 0 1 0 N m N n mn y nC µ (6) ∑∑ − = − = − = 1 0 1 0 2 ) 1 ( N m N n mn x x C µ σ (7) mn y y C 2 ) 1 ( µ σ − = (8) Homogeneity ∑∑ − = − = − + = 1 0 1 0 1 N m N n mn n m C ENT (9) 4.3 BAYESIAN CLASSIFIER A Baye’s classifier [18,19] is a simple probabilistic classifier based on applying Bayes' theorem (from Bayesian statistics) with strong (naive) independence assumptions. A more descriptive term for the underlying probability model would be "independent feature model".In simple terms, a naive Bayes classifier assumes that the presence (or absence) of an particular feature of a class is unrelated to the presence (or absence) of any other feature. The naive Bayesian classifier works as follows: 1.Let T be a training set of samples, each with their class labels. There are k classes, C1,C2, . . . ,Ck. Each sample is represented by an n-dimensional vector, X = {x1, x2, . . . , xn}, depicting n measured values of the n attributes,A1,A2,........An respectively. 2.Given a sample X, the classifier will predict that X belongs to the class having the highest a posteriori probability, conditioned on X. That is X is predicted to belong to the class Ci if and only if P(Ci|X) > P(Cj |X) for 1≤ j≤ m, j≠i
- 6. International Journal of Information Sciences and Techniques (IJIST) Vol.2, No.2, March 2012 6 Thus we find the class that maximizes P(Ci|X). The class Ci for which P(Ci|X) is maximized is called the maximum posterior hypothesis. By Bayes’ theorem ( ) ( ) X P C P C X P X C P i i i = (10) 3.As P(X) is the same for all classes, only P(X|Ci)P(Ci) need be maximized. If the class a priori probabilities, P(Ci), are not known, then it is commonly assumed that the classes are equally likely, that is, P(C1) = P(C2) = . . . = P(Ck), and we would therefore maximize P(X|Ci). Otherwise we maximize P(X|Ci)P(Ci). Note that the class a priori probabilities may be estimated by P(Ci) = freq(Ci, T)/|T|. 4. Given data sets with many attributes, it would be computationally expensive to compute P(X|Ci). In order to reduce computation in evaluating P(X|Ci) P(Ci),the naive assumption of class conditional independence is made. This presumes that the values of the attributes are conditionally independent of one another, given the class label of the sample. Mathematically this means that ∏ = ≈ 1 K i k i C x P C X P (11) The probabilities P(x1|Ci), P(x2|Ci), . . . , P(xn|Ci) can easily be estimated from the training set. Recall that here xk refers to the value of attribute Ak for sample X. (a) If Ak is categorical, then P(xk|Ci) is the number of samples of class Ci in T having the value xk for attribute Ak, divided by freq(Ci, T), the number of sample of class Ci in T. (b) If Ak is continuous-valued, then we typically assume that the values have a Gaussian distribution with a mean µ and standard deviation defined by 2 2 2 ) ( exp 2 1 ) , , ( σ µ πσ σ µ − − = x x g (12) so that ) , , ( i i C C k i k x g C x P σ µ = (13) We need to compute mean and standard deviation,of attribute Ak for training samples of class Ci. 5. In order to predict the class label of X, P(X|Ci)P(Ci) is evaluated for each class Ci. The classifier predicts that the class label of X is Ci if and only if it is the class that maximizes P(X|Ci)P(Ci). Comparing classification algorithms have found that the naive Bayesian classifier to be comparable in performance with high accuracy and speed. 5.RESULTS AND DISCUSSION Four types of fabrics namely Silk, Nylon, Cotton, Wool constituting nearly 120 images are taken for analysis of proposed work. Images are of size 200x765 with Pixel Depth 24.The features of training and testing images are extracted using the Binary level co-occurrence method.Here 80
- 7. International Journal of Information Sciences and Techniques (IJIST) Vol.2, No.2, March 2012 7 images are used for training and 40 images are used for testing the classifier and algorithm is implemented in Matlab 7.9. Figure 5 and 6 shows some of the training and testing images.Four features are taken for this project as these give better results than the remaining parameters, as there is no much difference in values for different fabric images.Based on the matching of the testing image using Bayes classifier, the type of fabric is identified.Based on the results observed,BLCM method performs well when compared to GLCM.The accuracy rate calculations are given as below: Accuracy = Figure 5.Some of training images Figure 6.Some of testing images The Bit plane representation of a binary image output is shown below: Bit-plane 7 Bit-plane 6 Bit-plane 5 Bit-plane 4 Bit-plane 3 Bit-plane 2 Bit-plane 1 Bit-plane 0 The Textural parameters such as Energy, Entropy, Contrast and Homogeneity computed on test images using GLCM and BLCM methods are shown in Table 2. Fabric Samples Contrast Energy Entropy Homogeneity GLCM BLCM GLCM BLCM GLCM BLCM GLCM BLCM Cotton 0.3875 15.0176 0.2842 0.2645 1.3248 0.2676 0.8063 0.5783 Cotton 0.5102 11.5933 0.2096 0.3837 1.8977 0.4355 0.7778 0.6930 TP+FP+FN+TN TP+TN
- 8. International Journal of Information Sciences and Techniques (IJIST) Vol.2, No.2, March 2012 8 Cotton 0.4774 18.075 0.2763 0.2500 1.6786 0.2656 0.8177 0.6719 Nylon 0.4314 4.8850 0.2263 0.7980 1.8603 0.4166 0.8255 0.9128 7Nylon 0.2818 7.6877 0.3248 0.6861 1.5221 0.3679 0.8608 0.8627 Silk 0.1837 4.4140 0.5899 0.5397 0.9672 0.7223 0.9090 0.9212 Silk 0.1972 7.3505 0.3193 0.6695 1.7499 0.4187 0.9194 0.8687 Silk 0.1396 10.3665 0.6160 0.5769 0.9907 0.3332 0.9441 0.8149 Wool 0.9336 18.6179 0.1096 0.0323 2.6221 0.2523 0.7449 0.5783 Wool 0.7727 20.9073 0.2521 0.1460 1.5525 0.2557 0.6636 0.6267 Table 2. GLCM and BLCM Feature Values It is observed from the above that, Homogeneity is high for smooth textures such as Nylon and Silk and it is low for rough textures such as Wool. Considering the running time of the algorithm as well as the accuracy, the BLCM and Bayes classifier give the best results compared to the GLCM. The fusion among proposed methods like GLCM + Bayes classifier leads to an accuracy of 92.75% whereas the fusion of BLCM+Bayes classifier leads to 95.5%. and is shown in Table 3. Method Samples Accuracy BLCM+Bayes classifier 120 95.5% GLCM+Bayes classifier 120 92.75% Table 3. Results of fusion of methods 6.CONCLUSION This paper illustrates the development of texture classification for recognizing fabrics. The texture of fabrics can be characterized by the spatial co-occurrence of their color components making the BLCM a suitable method for our analysis. Four parameters like contrast, homogeneity, energy, correlation have been used for calculating the fabric textures. Comparing feature extraction method with GLCM, the proposed BLCM exhibits better performance in terms of accuracy and speed when applied to large databases. References [1] Davis,L.S,”Image texture analysis techniques:a survey in Digital image processing”,1981 [2] Zaim,A.et al,”A new method fir iris recognition using grey level co-occurence matrices”,2006. [3] Abutaleb,A.S.,”Automatic thresholding Of Grey level pictures using two dimensional entropies”,computer vision graphics image processing,1989.
- 9. International Journal of Information Sciences and Techniques (IJIST) Vol.2, No.2, March 2012 9 [4] Kim, K. et. Al.,”Efficient video image retrieval by using co-occurrence matrix texture features and normalized correlation”,proceedings of IEEE 10th conference,1999. [5] Allam S.M.Adel andP.Refrieger,”Fast algorithm for texture discrimination by use of separable orthonormal decomposition of the co-occurrence matrices”.Applied optics1997. [6] Weszka,J.S,”A comparative study of texture for terrain classification”,IEEE trans,on sys.,1976. [7] Haralick and I.Dinstein,”Textural features for image classification”,1973. [8] Walker,R.F.”Recent developments in the use of co-occurrencematrices for texture recognition”,International conference in DSP,1997. [9] Boong, S.J. & Ji H.B., ”Automatic recognition of woven fabric patterns by an artificial neural network”, Textile Res. J.,2003. [10] Kang, T. J., Kin, S. M., and choi, S. H.,”Automatic recognition of fabric weave patterns by digital image analysis”, Textile Res. J.,1999. [11] Huang, C. C., Liu, S. C., and Yu, W. H,”Woven Fabric Analysis by Image Processing, Part I:identification of weave patterns’’, Textile Res. J..,2000. [12] Chung-Feng, J. K., Cheng-chih, T.,”Automatic Recognition of Fabric Nature by Using the Approach of Texture Analysis”, Textile Res. J.,2006. [13] Arvis,et.,al,”Generalisation of co-occurrence matrices for color images:application to color texture classification”,2004. [14] Chindaro,“Texture classification using color space fusion”,2005. [15] Han,J.”Classifiying and comparing regular textures for retrieval using texel geometry”,International conference on computer vision theory and Applications,2009. [16] http://www.fp.ucalgary.ca/mhallbey/tutorial.htm, GLCM texture tutorial. [17] C. F. J. Kuo, C. Y. Shih, and J. Y. Lee,”Automatic recognition of fabric weave patterns by a fuzzy C-means clustering method”, Textile Research Journal, 2004. [18] Friedman, N., Geiger, D., Goldszmidt, M.,”Bayesian network classifiers”, Mach. Learn.,1997. [19] K.Ming Leung,”Naive Bayesian Classifier”,Department of Computer Science Engineering,2007. Authors S.Mohamed Mansoor Roomi received his B.E degree in Electronics and communication Engineering from Madurai Kamarajar University, in 1990 and the M.E (Power systems) & ME (Communication Systems) from Thiagarajar College of Engineering, Madurai in 1992 & 1997 and PhD in 2009 from Madurai Kamarajar University . His primary Research Interests include Image Enhancement and Analysis. S.Saranya received her B.E degree in Electronics and communication Engineering in 2009 from Arulmigu Kalasalingam College of Engineering and doing M.E in Communication systems at Thiagarajar College Of Engineering, Madurai, India