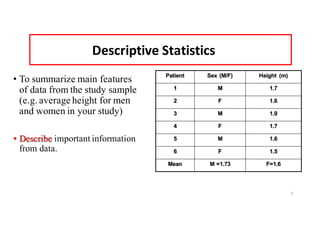
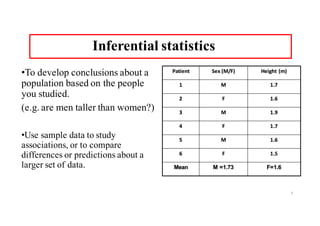
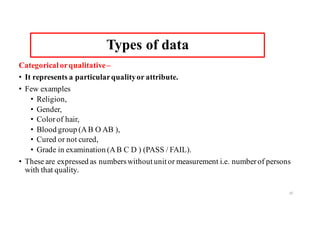
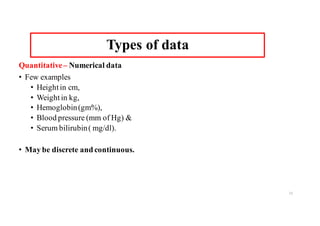
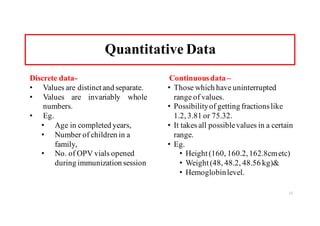
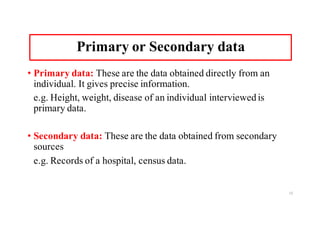
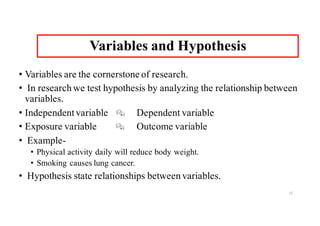
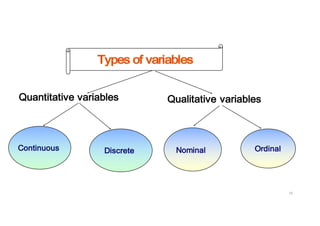
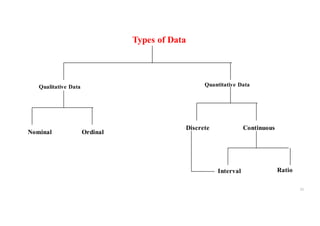
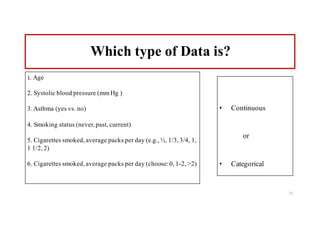
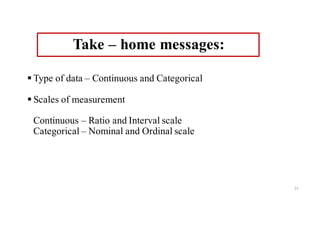
Basics for beginners in statistics
Statistics is a branch of science that deals with the study of collection, compilation, analysis, interpretation and presentation of data.
Lecture on Introduction to Descriptive Statistics - Part 1 and Part 2. These slides were presented during a lecture at the Colombo Institute of Research and Psychology.
As continuation of Lesson 2 (where we contextualize data) in this lesson we define basic terms in statistics as we continue to explore data. These basic terms include the universe, variable, population and sample. In detail we will discuss other concepts in relation to a variable.
Statistical methods and analyses are used to communicate research findings and give credibility to research methodology and conclusions. It is important for researchers and also consumers of research to understand statistics so that they can be informed, evaluate the credibility and usefulness of information, and make appropriate decisions.
This will help you to understand the basic statistics particularly Discriptive Statistics.
Basic terminologies used in statistics,measure of central tendancy,measure of frequency,measure of dispersion.
#nafeesupdates
#nafeesmedicos
Define the terms: Statistics and Biostatistics
Discuss the importance of Biostatistics
Differentiate between Population & Sample, Parameter & Statistics
Identify the various sources of data collection
Explain the types of variables
Explore the different types of Measurement scales
Methods of Presenting the data
Tabular Presentation
Textual Presentation
Graphical Presentation
Statistics
Collection, Classification, Organization, Summarization, analysis, Presentation, and Interpretation of the data / information.
Biostatistics
Collection, Classification, Organization, Summarization, Presentation, and Interpretation of the data / information.
If related to Biological or Health sciences called “Biostatistics”
Why do we need to study Biostatistics course?
To learn how to deal with numbers.
To assess evidence from different studies.
To understand published scientific papers.
To do research and write papers in journals.
Population
The set of all the measurements of interest to the investigator.
Monthly income of households in Pakistan
Number of TB Patients in Pakistan
Sample
It is a group of subjects selected from a population
A random sample is a good representative of population
Example
A survey of 1,000 households taken from all parts of Pakistan to assess their monthly income
Parameter
– The characteristics of interest to the researcher in the population is called a parameter.
E.g. average household size and percent of households with modern sanitation as reported in the 1998 census of Karachi
Statistic
– The characteristics of interest to the researcher in the sub-set of population is called a statistic.
E.g. average household size and percent of households as reported from a sample survey of 6,000 households in Karachi, 2010
Descriptive Statistic :
Consists of the collection, organization, summarization and presentation of data.
Inferential Statistic :
Consists of generalizing from samples to populations, performing estimations and hypothesis tests, determining relationships among variables
A Variable is simply what is being observed or measured
The dependent variable is the outcome of interest
The independent variable is the intervention or what is being manipulated
Data
The set of values collected for the variable of each of the elements belonging to the sample
Qualitative Variable:
Variables that can be placed into distinct categories, according to some characteristic or attribute.
Quantitative variables
That have are measured on a numeric
or quantitative scale. Interval and ratio scales are quantitative
Nominal Scale
- It is the first level of measurement
- Named variables
Ordinal Scale
-Data measured at this level can be placed into categories, and these categories can be ordered, or ranked.
Interval scale:
Differences between values have meaning.
Ordered with proportionate difference between variables
Arbitrary Zero (0 will have a meaning)
Ratio scale:
Differences between values have meaning. Absolute Zero (absence)
Statistics is a scientific study of numerical data based on natural phenomena.
It is also the science of collecting, organizing, interpreting and reporting data.
Indian Dental Academy: will be one of the most relevant and exciting training center with best faculty and flexible training programs for dental professionals who wish to advance in their dental practice,Offers certified courses in Dental implants,Orthodontics,Endodontics,Cosmetic Dentistry, Prosthetic Dentistry, Periodontics and General Dentistry.
Health: “a state of complete physical, mental and social well being and not merely an absence of disease or infirmity”.
Health is fundamental human right and nation has a responsibility for the health of its people.
The health problems of India may be conveniently listed under the following heads:
1. Communicable disease problems
2. Noncommunicable disease problems
2. Nutritional problems
3. Environmental sanitation problems
4. Medical care problems
5. Population problems
The science and art of preventing disease, prolonging life, and promoting physical and mental health and efficiency through organized community efforts for the sanitation of the environment, the control of community infections, the education of the individual in principles of personal hygiene, the organization of medical and nursing service for the early diagnosis and preventive treatment of disease, and the development of the social machinery, which will ensure to every individual in the community a standard of living adequate for the maintenance of health.
Demography addresses human populations as population per se, that is, their sizes and structures.
It is the scientific study of human population.
Demographic processes :
1. fertility 4. migration &
2. mortality 5. social mobility
3. marriage
Indicator is a variable which gives an indication of a given situation or a reflection of that situation.
Health Indicator is a variable, susceptible to direct measurement, that reflects the state of health of persons in a community.
Indicators help to measure the extent to which the objectives and targets of a programme are being attained.
Immunization is a process of protecting an individual from a disease through introduction of live attenuated, killed or organisms or antibodies in the individual system.
Immunization is the process of protecting an individual by active or passive method.
The immunizing agents are
Vaccines, Immunoglobulins and antisera
Why vaccination?
Prevention of deadly and debilitating diseases.
Keeps child from suffering through a preventable illness.
Less doctor visits
No hospitalization
The unusual occurrence in a community or region of disease, specific health related behaviour (eg. Smoking) or other health related events (eg. Traffic accidents) clearly in excess of “expected occurrence.
Observingthedistributionofdiseaseorhealth related events in human population.
• Identify the characteristics with which the disease is associated.
• Basically 3 questions are asked who, when and where.
• Who means the person affected, where means the place and when is the time distribution.
As per John M. Last (1988) Epidemiology is the study of the distribution and determinants of health related states or events in specified populations, and the application of this study to the control of health problems.
The orderly process defining national Health problems, identifying the unmeet needs, surveying the resources to meet them, and establishing the priority goals to accomplish the purpose of proposed Programme.
National programme for prevention and control of cancer, diabetes, CVDs and s...Dr Lipilekha Patnaik
NCDs are surpassing the burden of communicable diseases in India, need for National Programme on Prevention and Control of Cancer, Diabetes, Cardiovascular Diseases and Stroke was envisaged.
On 19 November 1985, GOI renamed EPI program, modifying the schedule as ‘Universal Immunization Program’ dedicated to the memory of Late Prime Minister Mrs Indira Gandhi.
UIP has two vital components: immunization of pregnant women against tetanus, and immunization of children
A process aimed at encouraging people to want to be healthy, to know how to stay healthy, to do what they can individually and collectively to maintain health and to seek help when needed.
ICD-10 is a statistical classification, which means that it contains a limited number of mutually exclusive code categories, which describe all disease concepts.
HOT NEW PRODUCT! BIG SALES FAST SHIPPING NOW FROM CHINA!! EU KU DB BK substit...GL Anaacs
Contact us if you are interested:
Email / Skype : kefaya1771@gmail.com
Threema: PXHY5PDH
New BATCH Ku !!! MUCH IN DEMAND FAST SALE EVERY BATCH HAPPY GOOD EFFECT BIG BATCH !
Contact me on Threema or skype to start big business!!
Hot-sale products:
NEW HOT EUTYLONE WHITE CRYSTAL!!
5cl-adba precursor (semi finished )
5cl-adba raw materials
ADBB precursor (semi finished )
ADBB raw materials
APVP powder
5fadb/4f-adb
Jwh018 / Jwh210
Eutylone crystal
Protonitazene (hydrochloride) CAS: 119276-01-6
Flubrotizolam CAS: 57801-95-3
Metonitazene CAS: 14680-51-4
Payment terms: Western Union,MoneyGram,Bitcoin or USDT.
Deliver Time: Usually 7-15days
Shipping method: FedEx, TNT, DHL,UPS etc.Our deliveries are 100% safe, fast, reliable and discreet.
Samples will be sent for your evaluation!If you are interested in, please contact me, let's talk details.
We specializes in exporting high quality Research chemical, medical intermediate, Pharmaceutical chemicals and so on. Products are exported to USA, Canada, France, Korea, Japan,Russia, Southeast Asia and other countries.
The prostate is an exocrine gland of the male mammalian reproductive system
It is a walnut-sized gland that forms part of the male reproductive system and is located in front of the rectum and just below the urinary bladder
Function is to store and secrete a clear, slightly alkaline fluid that constitutes 10-30% of the volume of the seminal fluid that along with the spermatozoa, constitutes semen
A healthy human prostate measures (4cm-vertical, by 3cm-horizontal, 2cm ant-post ).
It surrounds the urethra just below the urinary bladder. It has anterior, median, posterior and two lateral lobes
It’s work is regulated by androgens which are responsible for male sex characteristics
Generalised disease of the prostate due to hormonal derangement which leads to non malignant enlargement of the gland (increase in the number of epithelial cells and stromal tissue)to cause compression of the urethra leading to symptoms (LUTS
Title: Sense of Taste
Presenter: Dr. Faiza, Assistant Professor of Physiology
Qualifications:
MBBS (Best Graduate, AIMC Lahore)
FCPS Physiology
ICMT, CHPE, DHPE (STMU)
MPH (GC University, Faisalabad)
MBA (Virtual University of Pakistan)
Learning Objectives:
Describe the structure and function of taste buds.
Describe the relationship between the taste threshold and taste index of common substances.
Explain the chemical basis and signal transduction of taste perception for each type of primary taste sensation.
Recognize different abnormalities of taste perception and their causes.
Key Topics:
Significance of Taste Sensation:
Differentiation between pleasant and harmful food
Influence on behavior
Selection of food based on metabolic needs
Receptors of Taste:
Taste buds on the tongue
Influence of sense of smell, texture of food, and pain stimulation (e.g., by pepper)
Primary and Secondary Taste Sensations:
Primary taste sensations: Sweet, Sour, Salty, Bitter, Umami
Chemical basis and signal transduction mechanisms for each taste
Taste Threshold and Index:
Taste threshold values for Sweet (sucrose), Salty (NaCl), Sour (HCl), and Bitter (Quinine)
Taste index relationship: Inversely proportional to taste threshold
Taste Blindness:
Inability to taste certain substances, particularly thiourea compounds
Example: Phenylthiocarbamide
Structure and Function of Taste Buds:
Composition: Epithelial cells, Sustentacular/Supporting cells, Taste cells, Basal cells
Features: Taste pores, Taste hairs/microvilli, and Taste nerve fibers
Location of Taste Buds:
Found in papillae of the tongue (Fungiform, Circumvallate, Foliate)
Also present on the palate, tonsillar pillars, epiglottis, and proximal esophagus
Mechanism of Taste Stimulation:
Interaction of taste substances with receptors on microvilli
Signal transduction pathways for Umami, Sweet, Bitter, Sour, and Salty tastes
Taste Sensitivity and Adaptation:
Decrease in sensitivity with age
Rapid adaptation of taste sensation
Role of Saliva in Taste:
Dissolution of tastants to reach receptors
Washing away the stimulus
Taste Preferences and Aversions:
Mechanisms behind taste preference and aversion
Influence of receptors and neural pathways
Impact of Sensory Nerve Damage:
Degeneration of taste buds if the sensory nerve fiber is cut
Abnormalities of Taste Detection:
Conditions: Ageusia, Hypogeusia, Dysgeusia (parageusia)
Causes: Nerve damage, neurological disorders, infections, poor oral hygiene, adverse drug effects, deficiencies, aging, tobacco use, altered neurotransmitter levels
Neurotransmitters and Taste Threshold:
Effects of serotonin (5-HT) and norepinephrine (NE) on taste sensitivity
Supertasters:
25% of the population with heightened sensitivity to taste, especially bitterness
Increased number of fungiform papillae
Lung Cancer: Artificial Intelligence, Synergetics, Complex System Analysis, S...Oleg Kshivets
RESULTS: Overall life span (LS) was 2252.1±1742.5 days and cumulative 5-year survival (5YS) reached 73.2%, 10 years – 64.8%, 20 years – 42.5%. 513 LCP lived more than 5 years (LS=3124.6±1525.6 days), 148 LCP – more than 10 years (LS=5054.4±1504.1 days).199 LCP died because of LC (LS=562.7±374.5 days). 5YS of LCP after bi/lobectomies was significantly superior in comparison with LCP after pneumonectomies (78.1% vs.63.7%, P=0.00001 by log-rank test). AT significantly improved 5YS (66.3% vs. 34.8%) (P=0.00000 by log-rank test) only for LCP with N1-2. Cox modeling displayed that 5YS of LCP significantly depended on: phase transition (PT) early-invasive LC in terms of synergetics, PT N0—N12, cell ratio factors (ratio between cancer cells- CC and blood cells subpopulations), G1-3, histology, glucose, AT, blood cell circuit, prothrombin index, heparin tolerance, recalcification time (P=0.000-0.038). Neural networks, genetic algorithm selection and bootstrap simulation revealed relationships between 5YS and PT early-invasive LC (rank=1), PT N0—N12 (rank=2), thrombocytes/CC (3), erythrocytes/CC (4), eosinophils/CC (5), healthy cells/CC (6), lymphocytes/CC (7), segmented neutrophils/CC (8), stick neutrophils/CC (9), monocytes/CC (10); leucocytes/CC (11). Correct prediction of 5YS was 100% by neural networks computing (area under ROC curve=1.0; error=0.0).
CONCLUSIONS: 5YS of LCP after radical procedures significantly depended on: 1) PT early-invasive cancer; 2) PT N0--N12; 3) cell ratio factors; 4) blood cell circuit; 5) biochemical factors; 6) hemostasis system; 7) AT; 8) LC characteristics; 9) LC cell dynamics; 10) surgery type: lobectomy/pneumonectomy; 11) anthropometric data. Optimal diagnosis and treatment strategies for LC are: 1) screening and early detection of LC; 2) availability of experienced thoracic surgeons because of complexity of radical procedures; 3) aggressive en block surgery and adequate lymph node dissection for completeness; 4) precise prediction; 5) adjuvant chemoimmunoradiotherapy for LCP with unfavorable prognosis.
ARTIFICIAL INTELLIGENCE IN HEALTHCARE.pdfAnujkumaranit
Artificial intelligence (AI) refers to the simulation of human intelligence processes by machines, especially computer systems. It encompasses tasks such as learning, reasoning, problem-solving, perception, and language understanding. AI technologies are revolutionizing various fields, from healthcare to finance, by enabling machines to perform tasks that typically require human intelligence.
micro teaching on communication m.sc nursing.pdfAnurag Sharma
Microteaching is a unique model of practice teaching. It is a viable instrument for the. desired change in the teaching behavior or the behavior potential which, in specified types of real. classroom situations, tends to facilitate the achievement of specified types of objectives.
Ozempic: Preoperative Management of Patients on GLP-1 Receptor Agonists Saeid Safari
Preoperative Management of Patients on GLP-1 Receptor Agonists like Ozempic and Semiglutide
ASA GUIDELINE
NYSORA Guideline
2 Case Reports of Gastric Ultrasound
1. BASICS
FOR BEGINNERS IN
BIOSTATISTICS
Dr Lipilekha Patnaik
Professor, Community Medicine
Institute of Medical Sciences & SUM Hospital
Siksha ‘O’Anusandhan deemed to be University
Bhubaneswar, Odisha, India
Email: drlipilekha@yahoo.co.in
2. Session Objectives
• Data, information and statistics
• Variable – concept, types
• Qualitative and quantitative data
• Scales of measurement
2
3. DATA
v Data:- “Factsor figures from which conclusions can be
drawn".
v Data can relate to an enormous variety of aspects, for example:
v Weight and height measurementsof students in a class
v Blood pressure and pulse recording of patients at regular
interval
v The temperature of a city (measured every hour) for a
one-week period.
3
5. INFORMATION
v “Data when processed(recorded, classified, organized and
interpreted) to give a meaning”.
v Information, can take various forms:
v The no. of studentswith high BMI;
v The no. of personshaving high BP, no. of personswith irregularpulses
v The numberof days during theweek when the temperature went above
30°C.
5
6. STATISTICS
• Statistics is a branch of science that deals with the study of
collection, compilation, analysis, interpretation and
presentation of data.
• Biostatistics is branch of science that deals with study of
data derived from biological sciences.
6
7. • Descriptive statistics – Gives numerical and graphic
procedures to summarize a collection of data in a clear and
understandable way.
• Inferential statistics – provides procedures to draw
inferences about a population from a sample.
7
Types of STATISTICS
8. Patient Sex (M/F) Height (m)
1 M 1.7
2 F 1.6
3 M 1.9
4 F 1.7
5 M 1.6
6 F 1.5
Mean M =1.73 F=1.6
8
• To summarize main features
of data from the study sample
(e.g. average height for men
and women in your study)
• Describe important information
from data.
Descriptive Statistics
9. Inferential statistics
•To develop conclusions about a
population based on the people
you studied.
(e.g. are men taller than women?)
•Use sample data to study
associations, or to compare
differences or predictions about a
larger set of data.
Patient Sex (M/F) Height (m)
1 M 1.7
2 F 1.6
3 M 1.9
4 F 1.7
5 M 1.6
6 F 1.5
Mean M =1.73 F=1.6
9
10. Types of data
Categorical orqualitative–
• It represents a particularqualityor attribute.
• Few examples
• Religion,
• Gender,
• Colorof hair,
• Blood group (AB O AB ),
• Cured or not cured,
• Grade in examination (AB C D ) (PASS / FAIL).
• These are expressed as numberswithout unit or measurement i.e. numberof persons
with that quality.
10
11. Types of data
Quantitative– Numerical data
• Few examples
• Height in cm,
• Weight in kg,
• Hemoglobin(gm%),
• Blood pressure (mm of Hg) &
• Serum bilirubin( mg/dl).
• May be discrete and continuous.
11
12. Quantitative Data
Discrete data-
• Values are distinct and separate.
• Values are invariably whole
numbers.
• Eg.
• Age in completed years,
• Number of children in a
family,
• No. of OPV vials opened
during immunization session
Continuousdata –
• Those which have uninterrupted
range of values.
• Possibilityof getting fractionslike
1.2, 3.81 or 75.32.
• It takes all possiblevalues in a certain
range.
• Eg.
• Height (160, 160.2,162.8cmetc)
• Weight (48, 48.2, 48.56 kg)&
• Hemoglobinlevel.
12
13. Primary or Secondary data
• Primary data: These are the data obtained directly from an
individual. It gives precise information.
e.g. Height, weight, disease of an individual interviewed is
primary data.
• Secondary data: These are the data obtained from secondary
sources
e.g. Records of a hospital, census data.
13
15. Variables and Hypothesis
• Variables are the cornerstone of research.
• In research we test hypothesis by analyzing the relationship between
variables.
• Independentvariable ® Dependent variable
• Exposure variable ® Outcome variable
• Example-
• Physical activity daily will reduce body weight.
• Smoking causes lung cancer.
• Hypothesis state relationships between variables.
15
17. Why continuous variables should not be made categorical
1. There is a loss of accuracy; precise data (e.g. 26) get smeared across
a class interval (e.g. 20-29).
2. Membership in the same or different class intervals may not be
logical (e.g. 19 in 10-19 vs 20 in 20-29 vs 29 in 20-29).
3. The boundaries of the class intervals are usually arbitrary (why 10,
20, 30 and not 17, 24, 31?).
4. The statistical tests are less powerful.
17
18. When continuous variables can be made categorical
1. When the categories are necessary for administrative or
practical purposes
ØE.g. Paediatric VsAdult Vs Geriatric
ØE.g. Mild Vs Moderate Vs Severe hypertension.
2. When the raw data are approximations
ØE.g. for age, as in a rural sample.
18
19. Scales of measurements
Nominal scale – When measured by this scale, one simply names or
categorizes responses. They do not imply any ordering among the
responses.
• The information fits into one of the categories.
Eg –gender, religion, blood group, smoking status
Ordinal or rank scale- Characteristic can be put in ordered “natural
categories.”
• Eg –Disease staging systems ( advanced, moderate, mild, none) and
degree of pain (severe, moderate, mild, none), Socio-economic status
scale.
19
20. Interval scale – The differences between values can be quantified in
absolute terms and is meaningful.
• Ex- Dates are measured by interval scale since the differences can be
measured in years, Temperature- the difference 80 deg C and 70 deg C is
same as difference between 70 deg C and 60 deg C.
Ratio scale – Permits the comparison of differences of values.
• Ex- Height, weight. Ratio of wt. of 4g is twice that of 2 g. but a temp. of 80
deg C is not twice as hot as 40 deg C.
20
Scales of measurements
21. Types of Data
Qualitative Data Quantitative Data
Nominal Ordinal
Discrete Continuous
Interval Ratio
21
22. Which type of Data is?
1. Age
2. Systolic blood pressure (mm Hg )
3. Asthma (yes vs. no)
4. Smoking status (never, past, current)
5. Cigarettes smoked, average packs per day (e.g., ½, 1/3, 3/4, 1,
1 1/2, 2)
6. Cigarettes smoked, average packs per day (choose: 0, 1-2, >2)
22
• Continuous
or
• Categorical
23. Take – home messages:
§ Type of data – Continuous and Categorical
§ Scales of measurement
Continuous – Ratio and Interval scale
Categorical – Nominal and Ordinal scale
23