Download to read offline


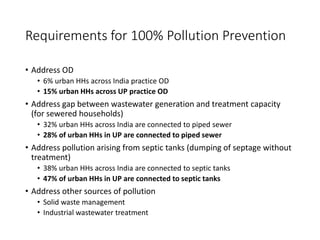
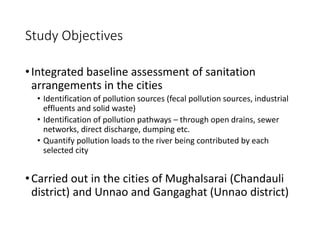
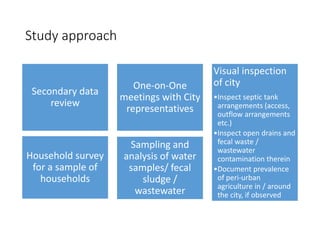

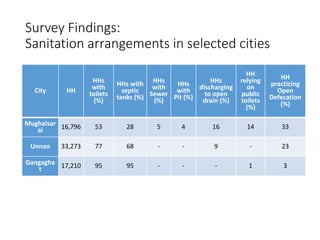


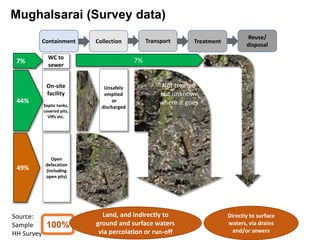

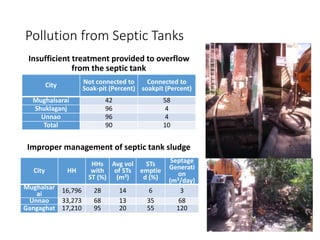

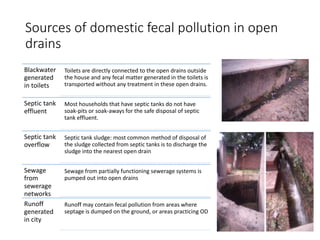


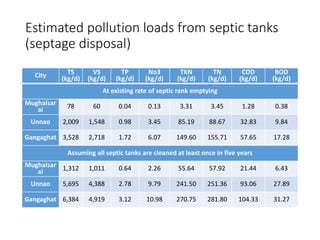


The document discusses a baseline pollution assessment conducted in the cities of Mughalsarai, Unnao, and Gangaghat located along the Ganga River in Uttar Pradesh, India. It finds that sanitation coverage and infrastructure is poor, with most households relying on septic tanks that are often unsafely emptied into open drains. The cities contribute significant pollution loads to the river in the form of fecal sludge from septic tanks and untreated domestic sewage via open drains. Mughalsarai's drains receive flows from outside the city limits as well. The direct discharge of Gangaghat's flows to the river means it contributes a large pollution load despite its smaller size.


