Download as PDF, PPTX
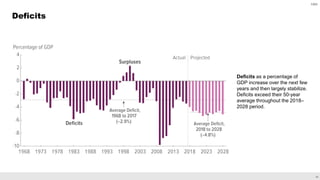
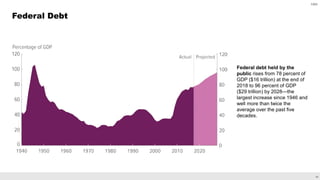
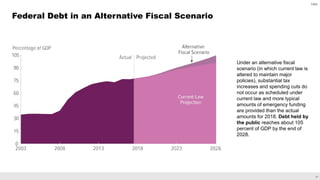

The Congressional Budget Office (CBO) provides Congress with budget and economic analyses. The CBO develops a baseline budget projection using its economic forecast and assuming current laws remain in place. The baseline includes projections for mandatory spending, discretionary spending, revenues, interest costs, deficits, and federal debt over 10 years. The CBO's current baseline projects that deficits will increase in coming years, federal debt will rise significantly, and debt held by the public will reach 96% of GDP by 2028 under current law.


