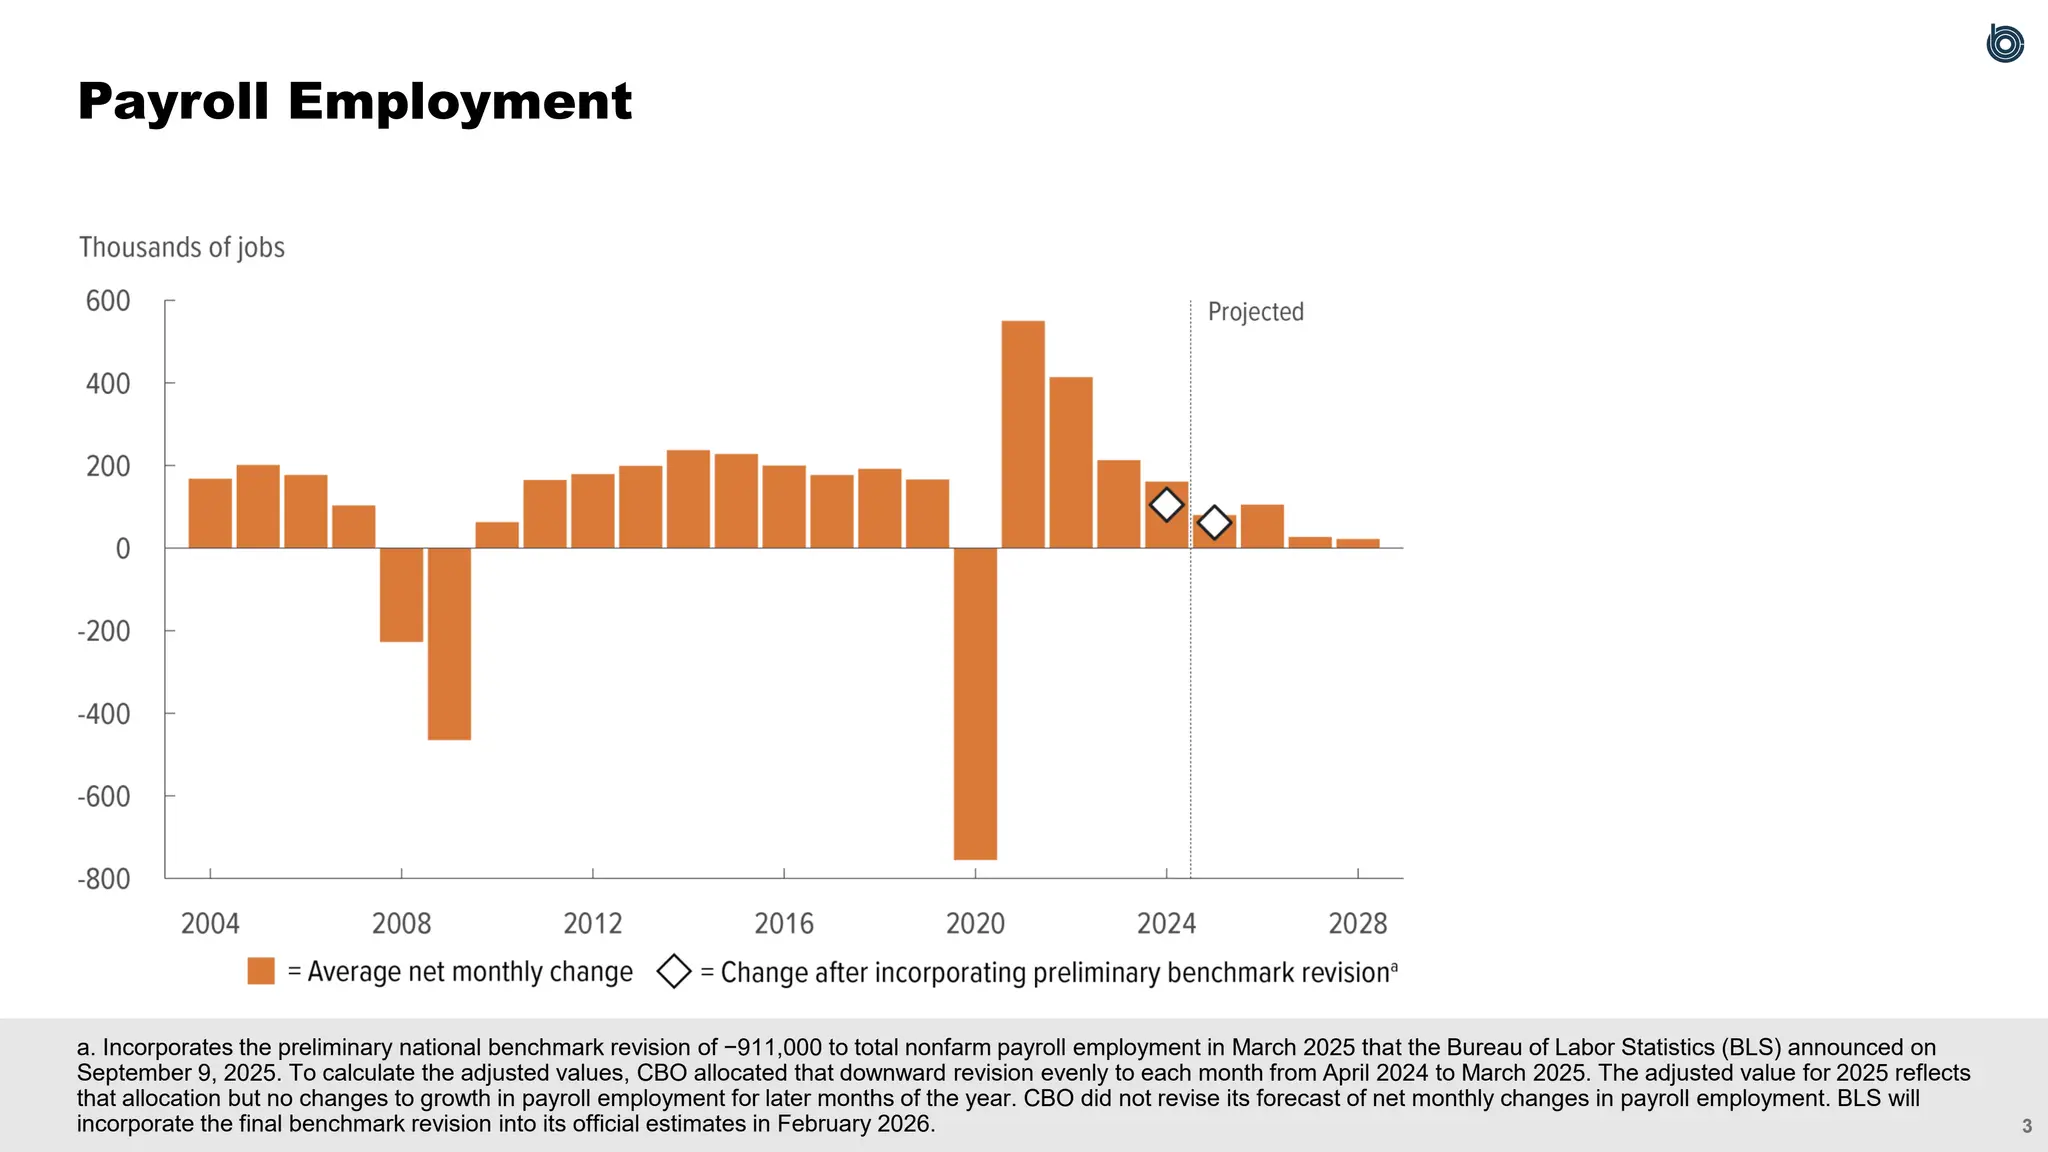
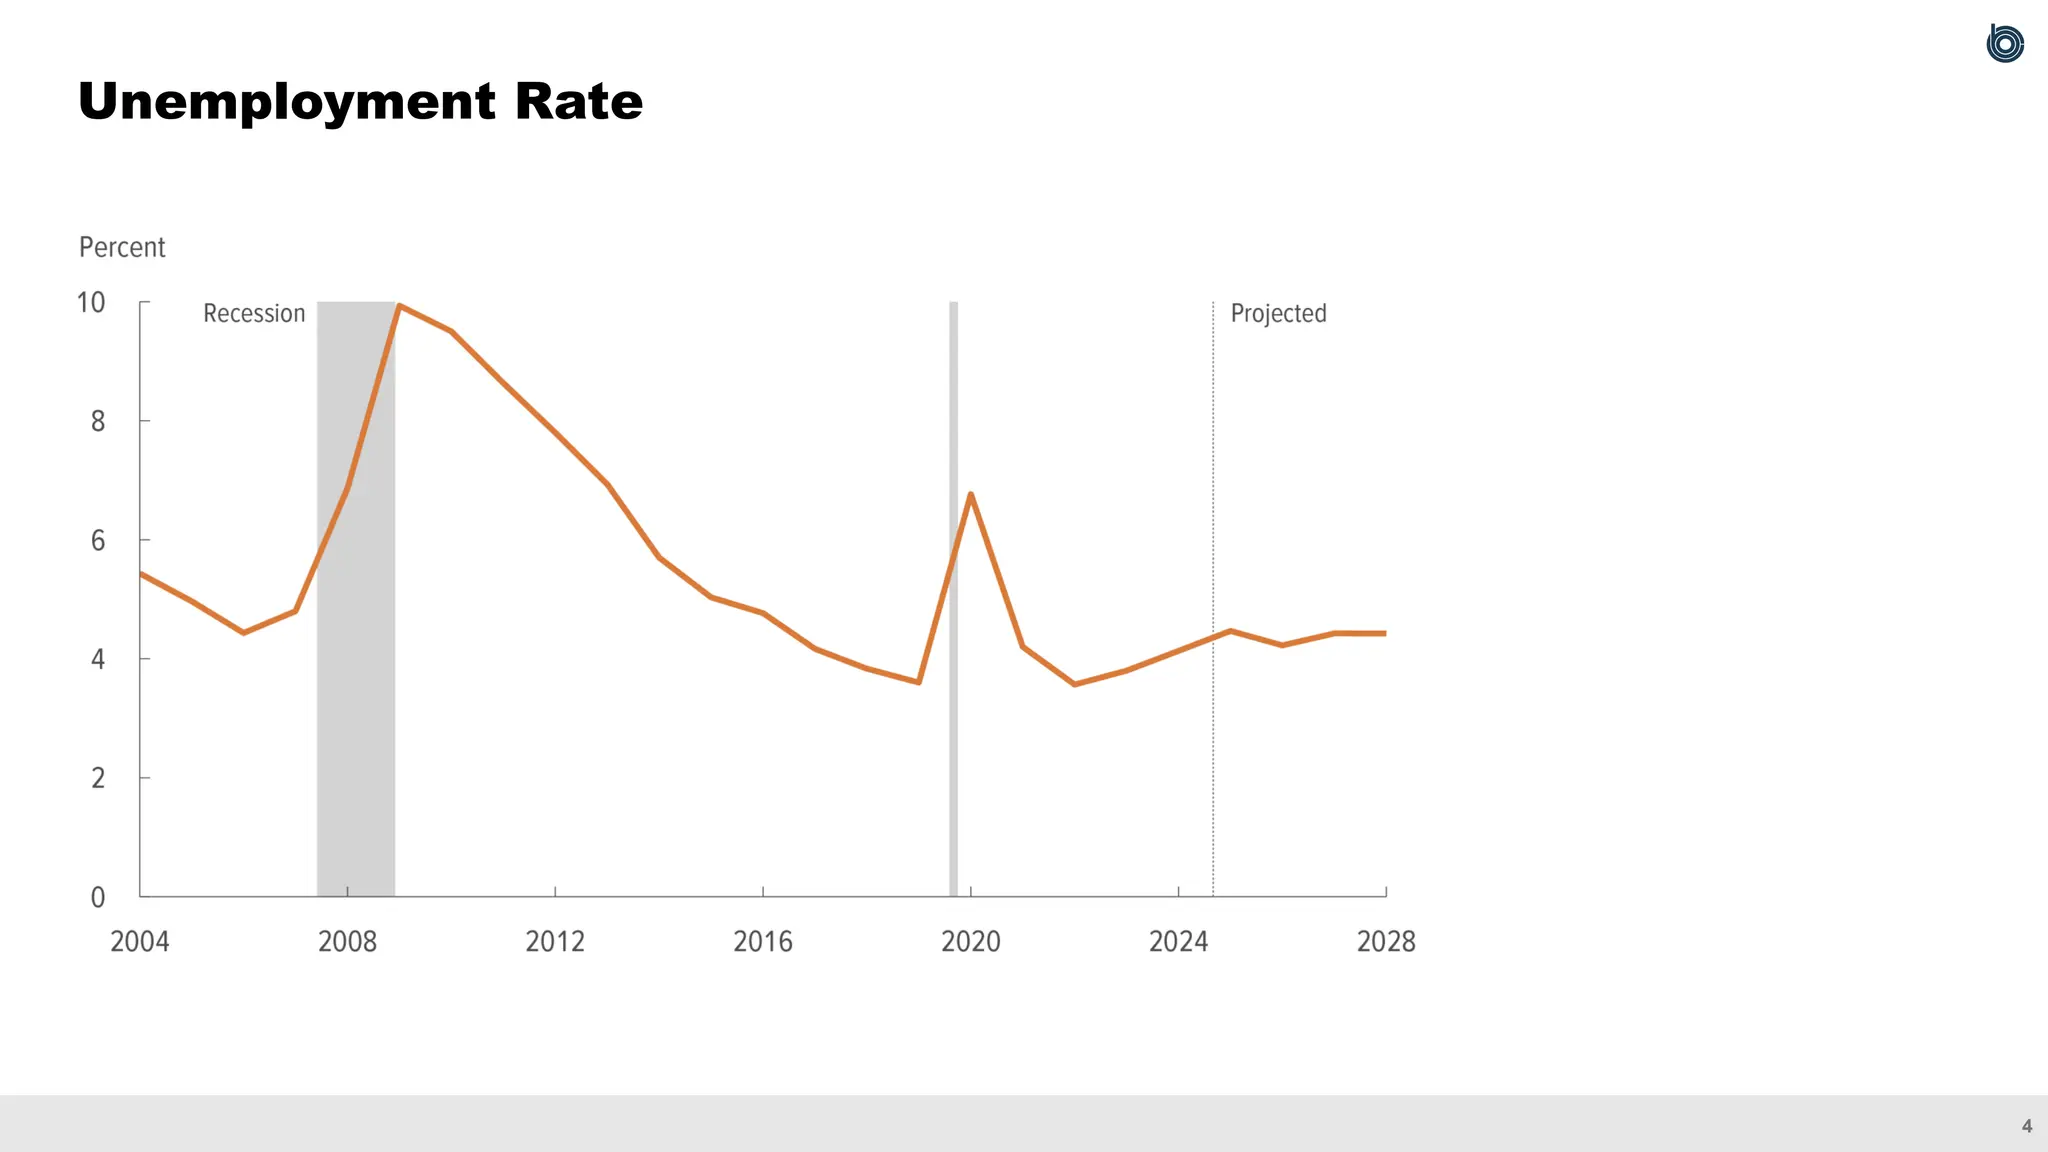
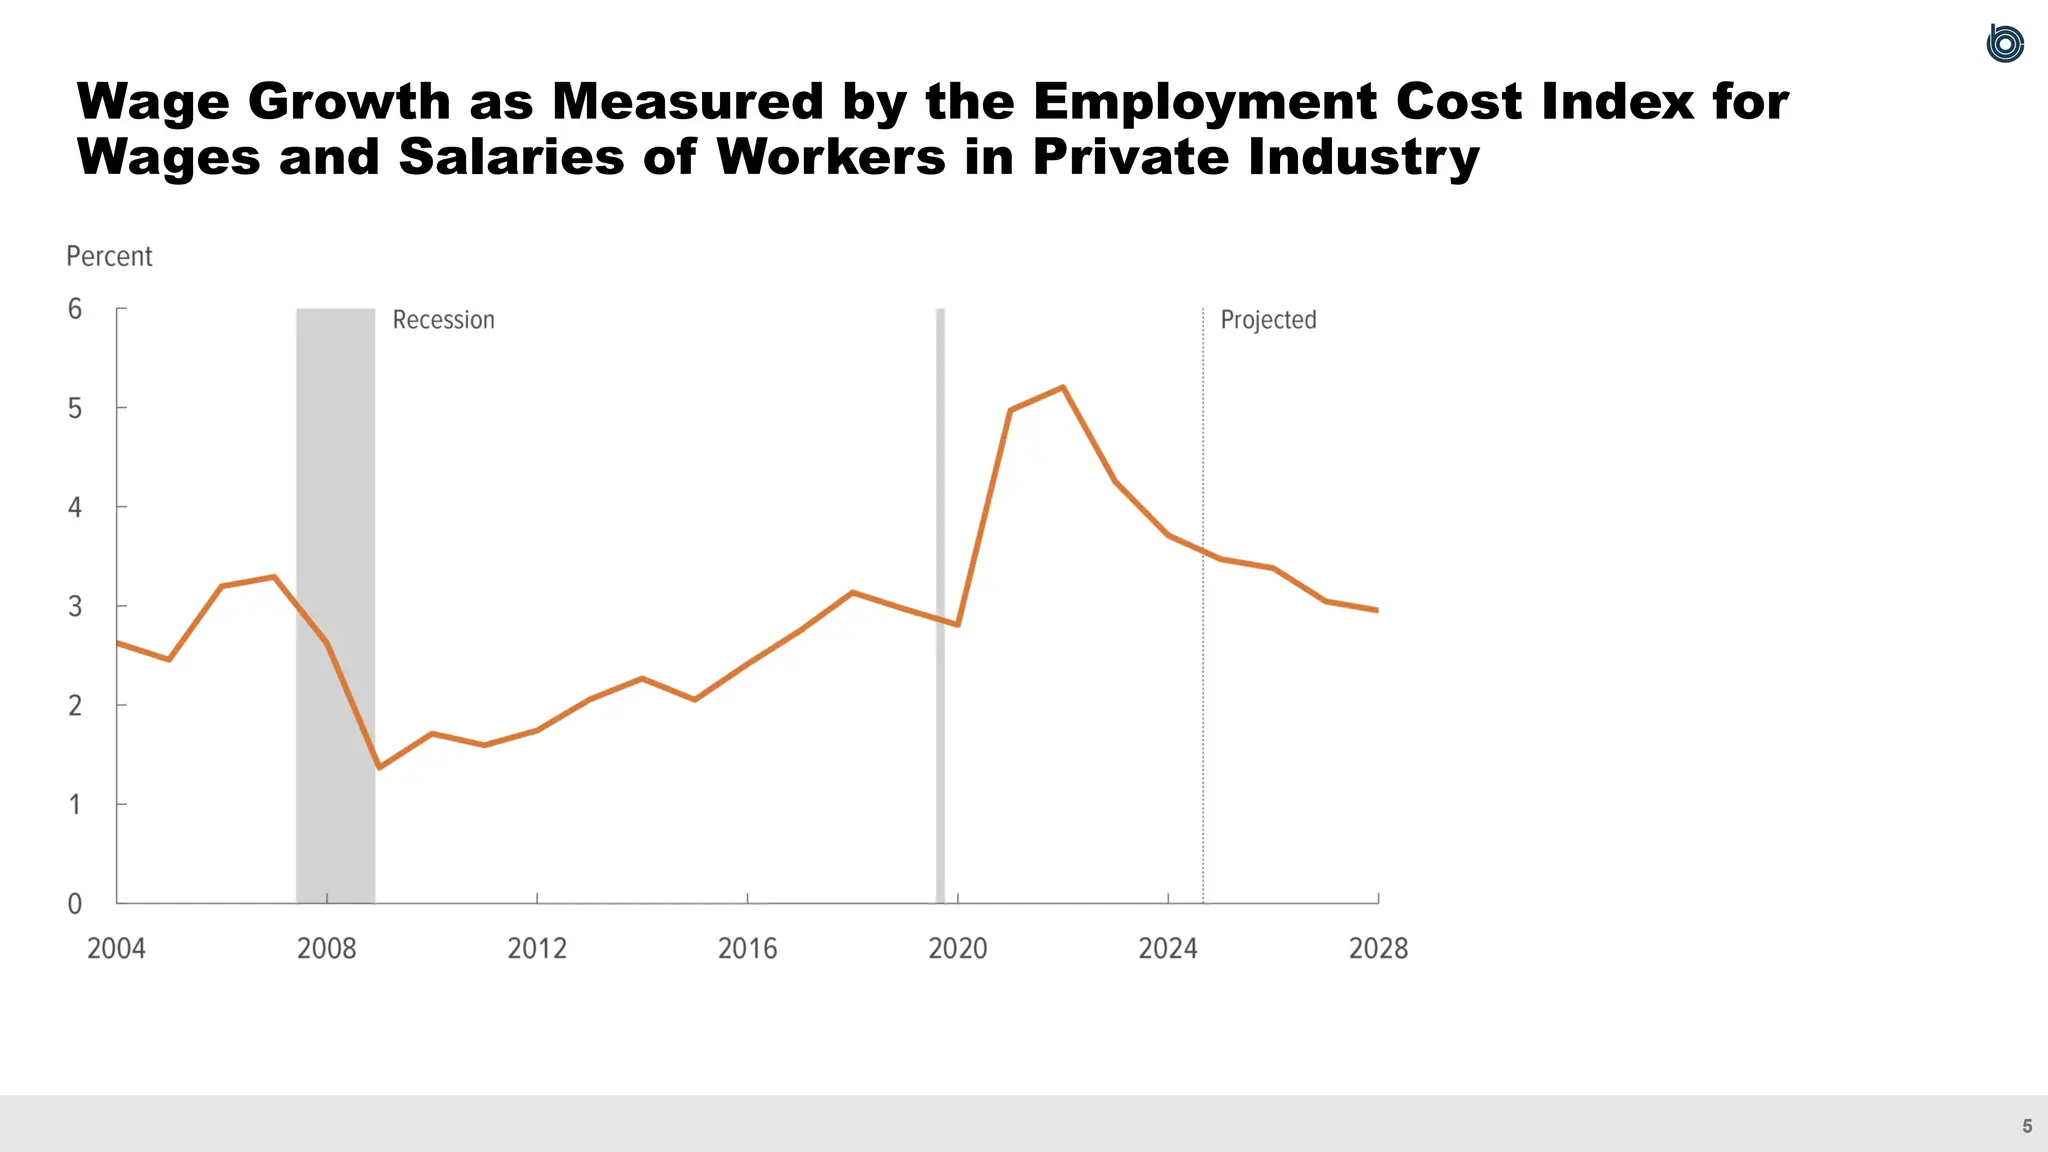
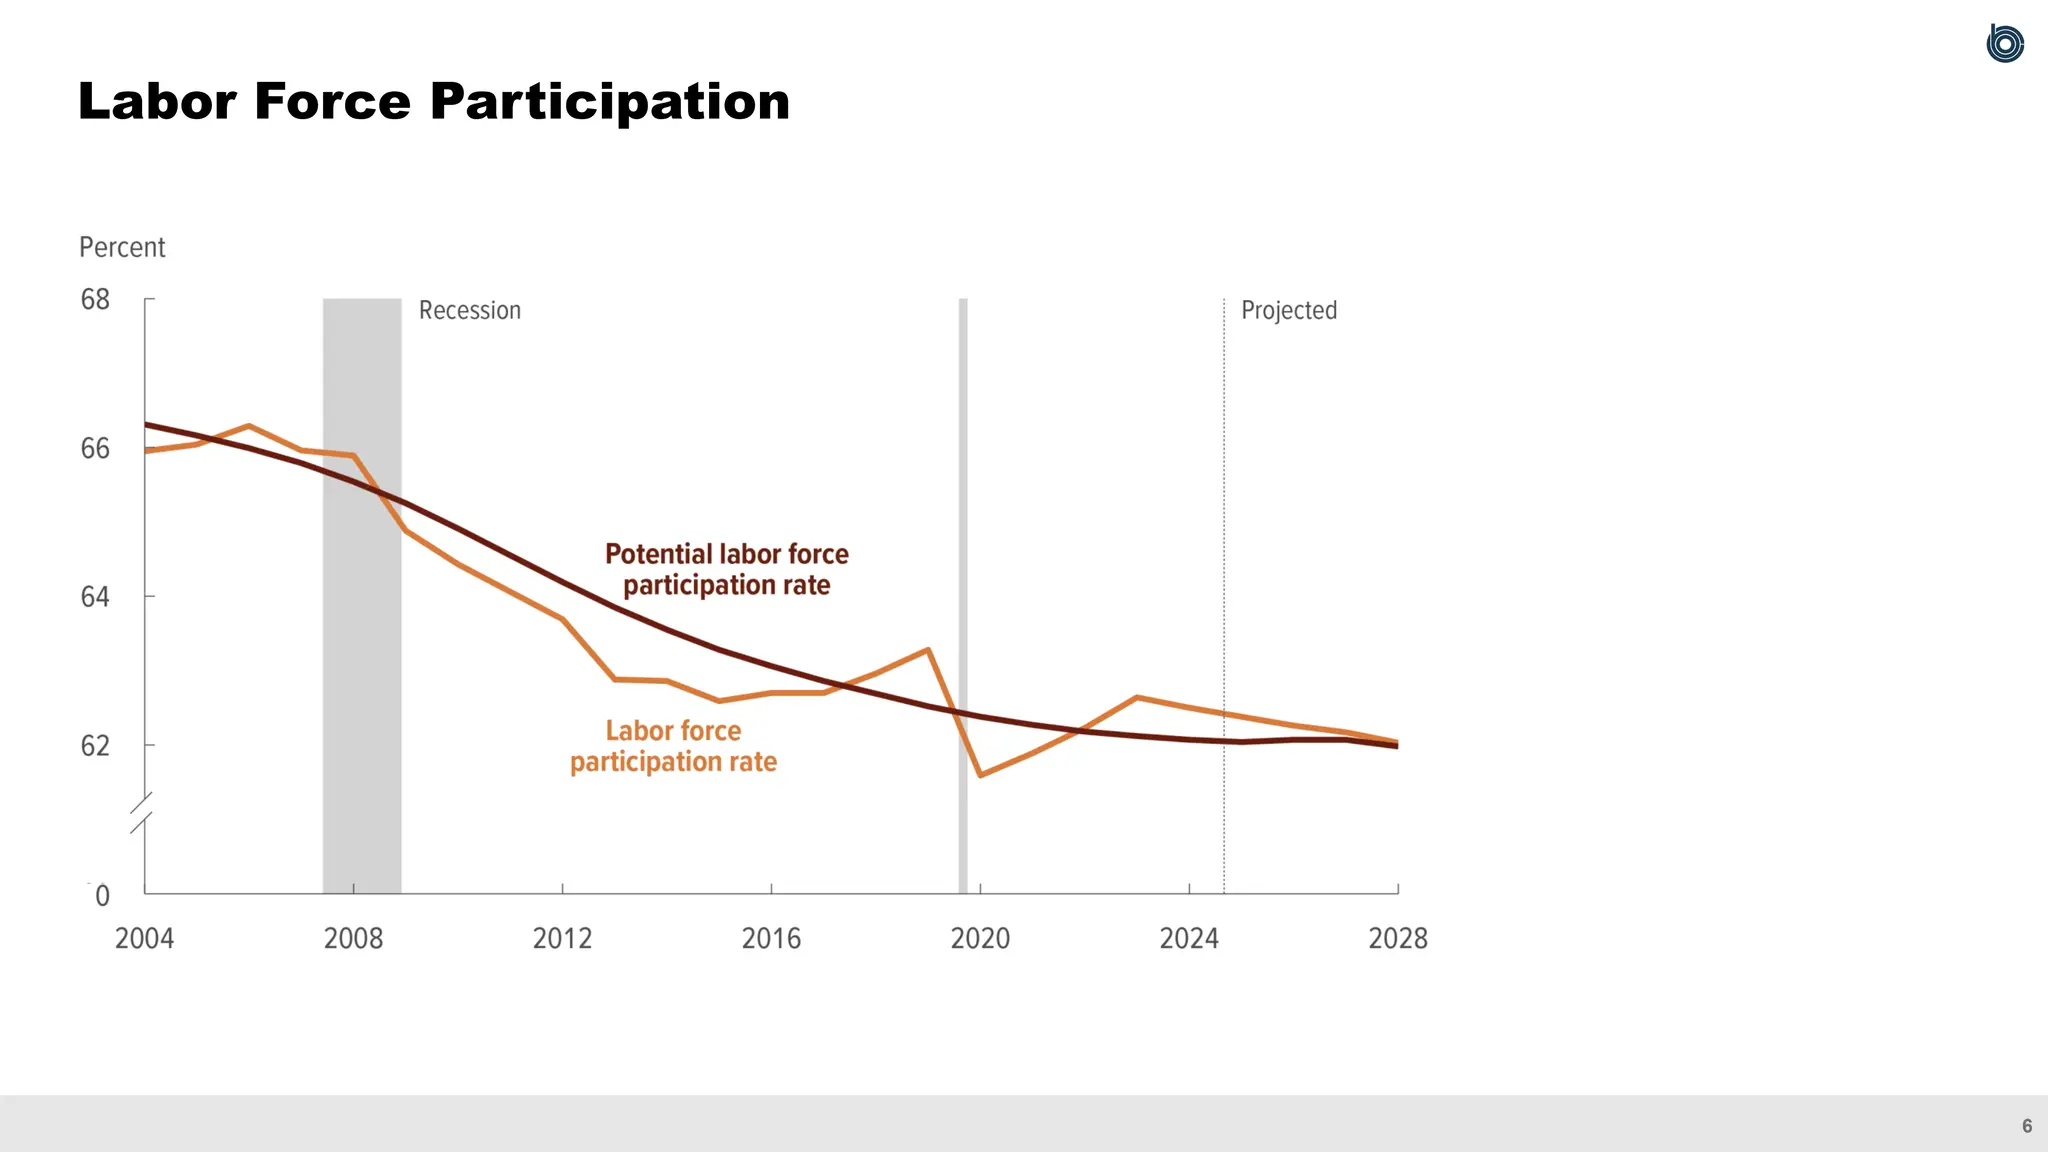
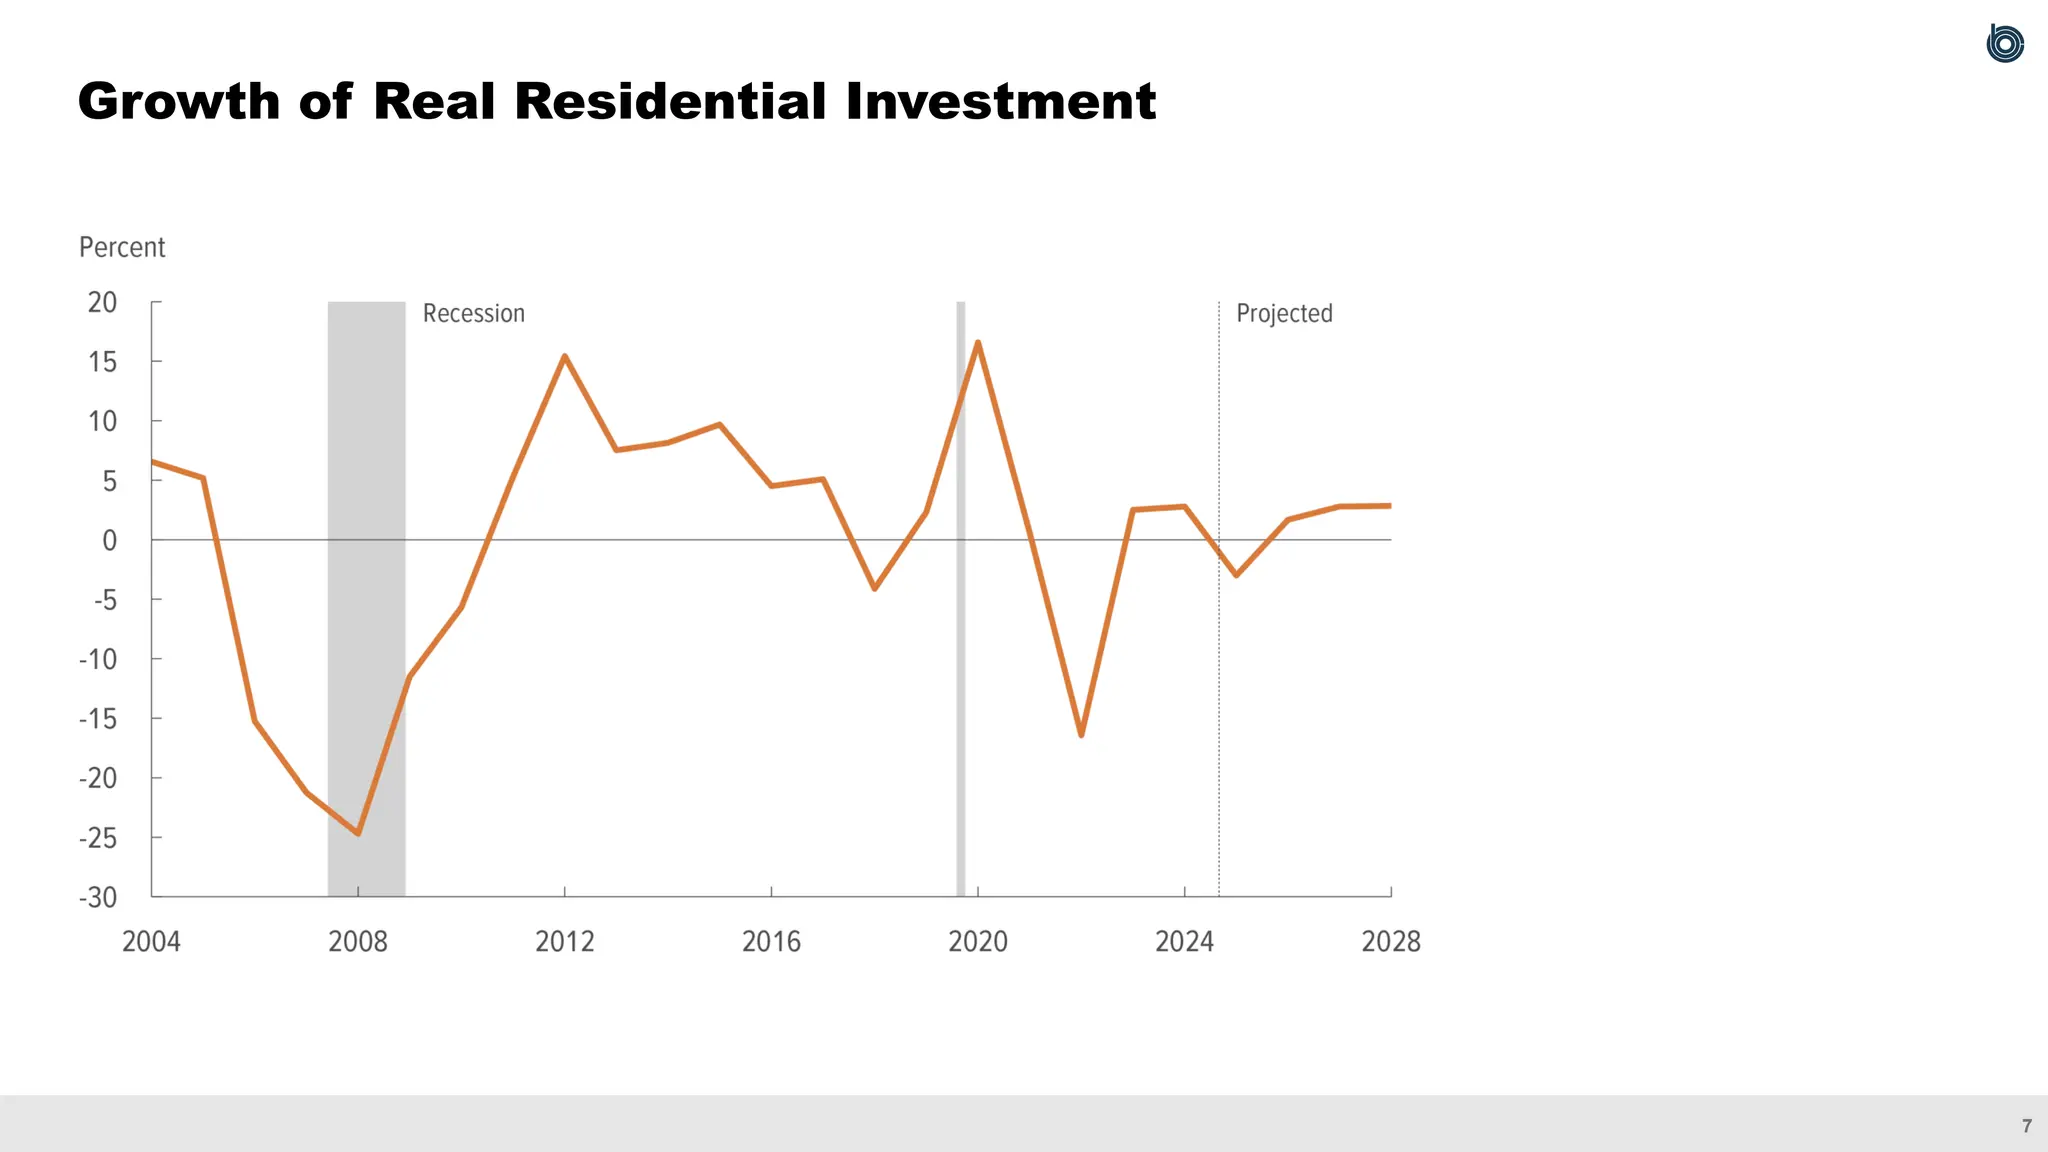
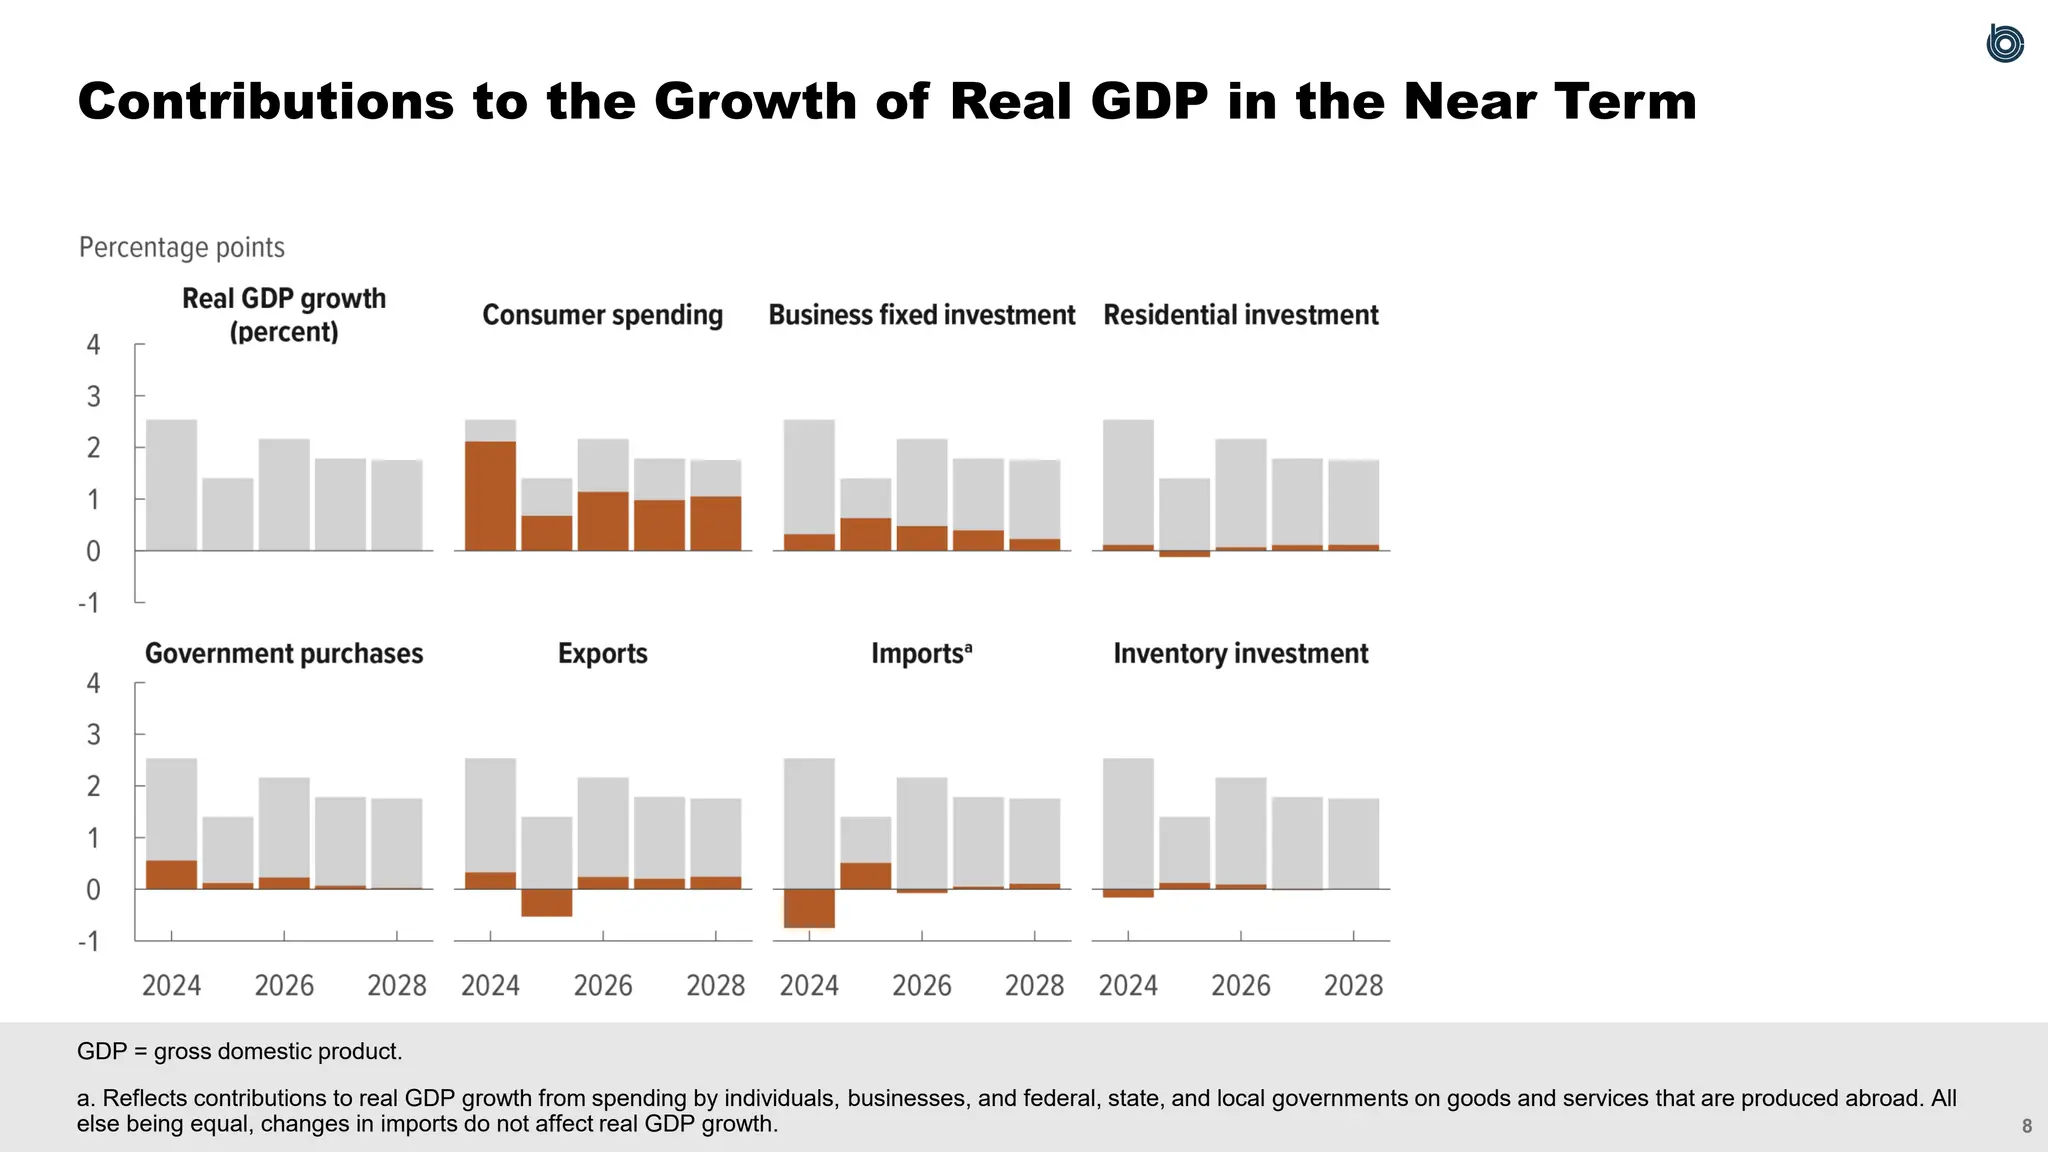
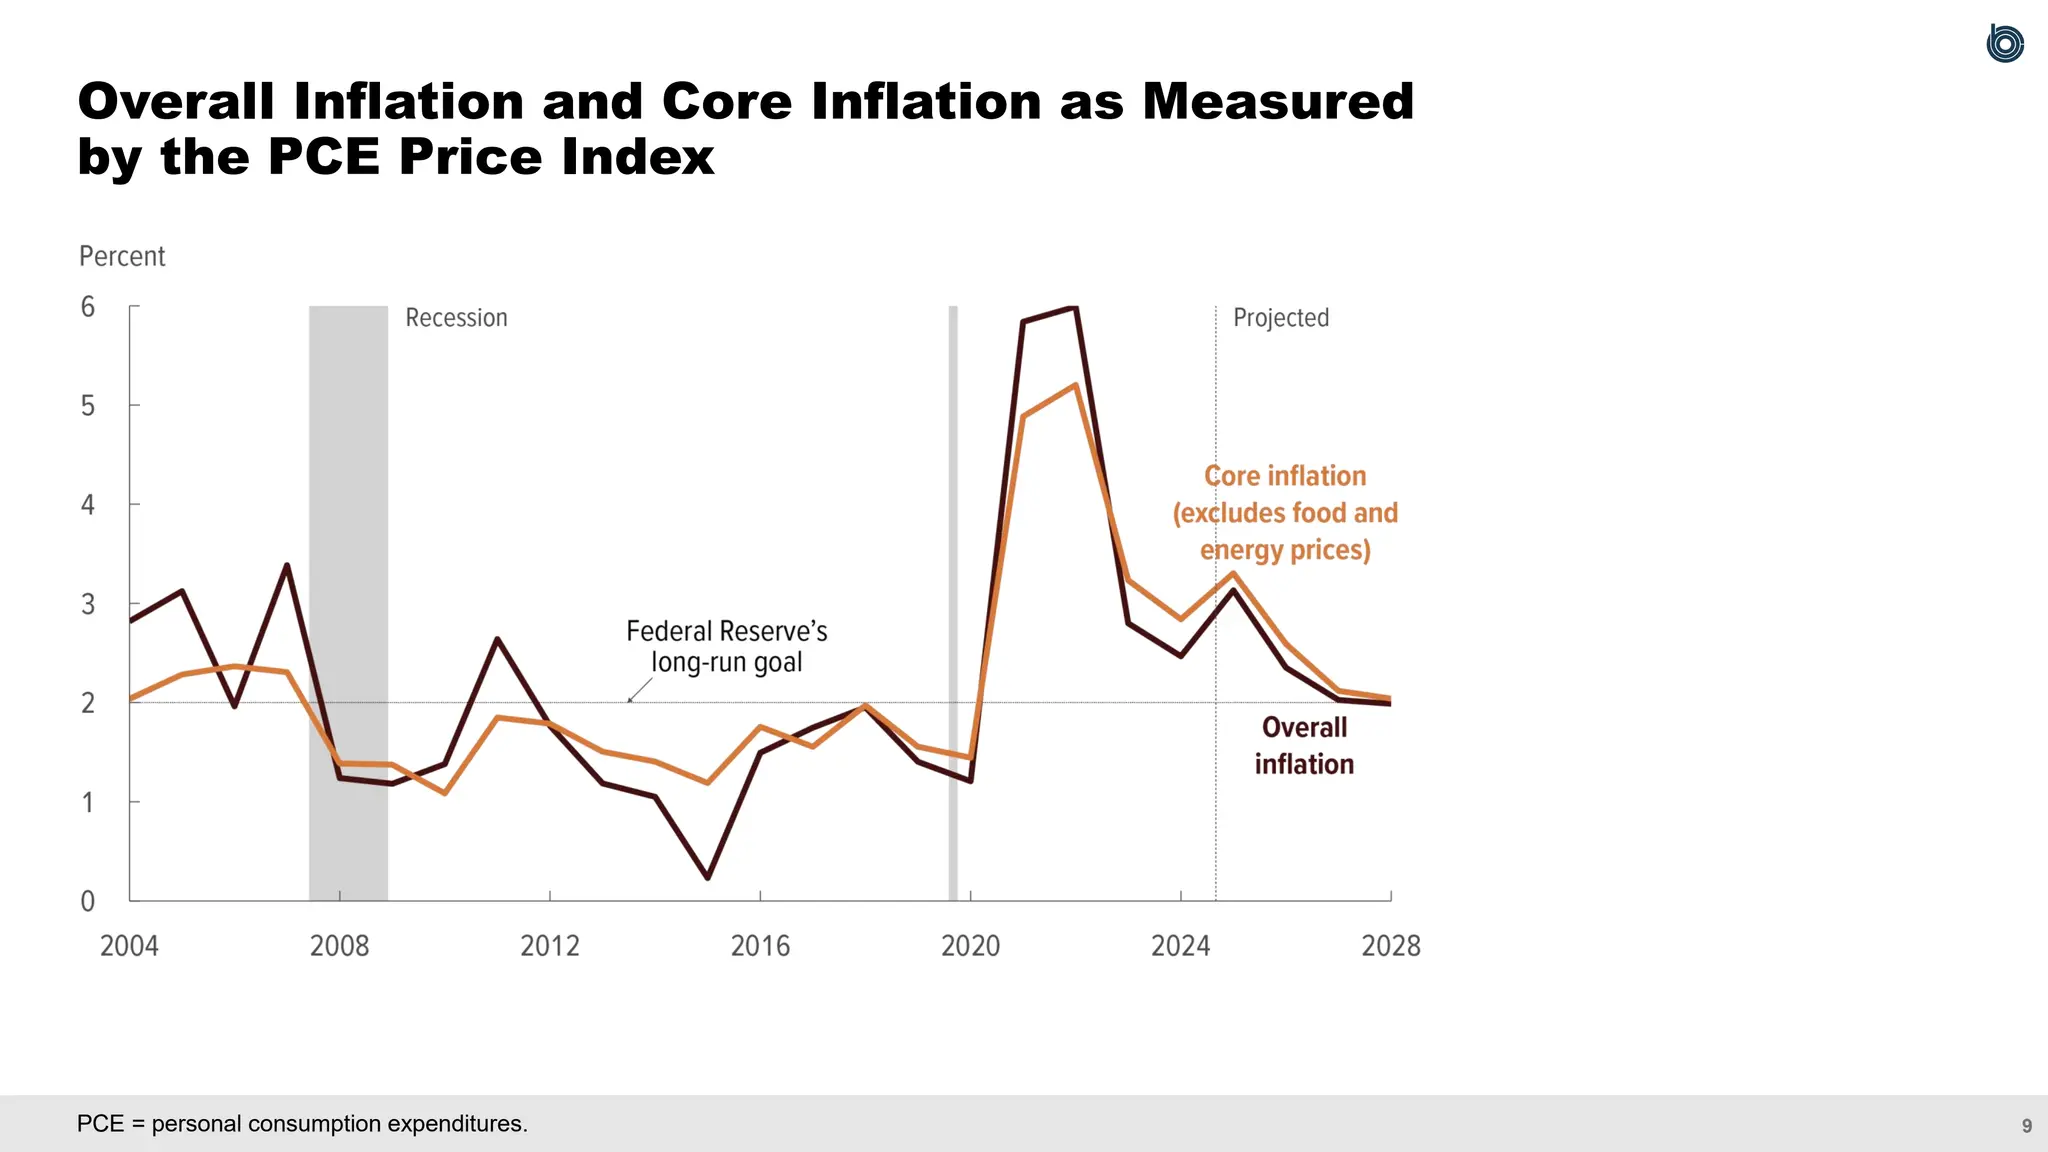
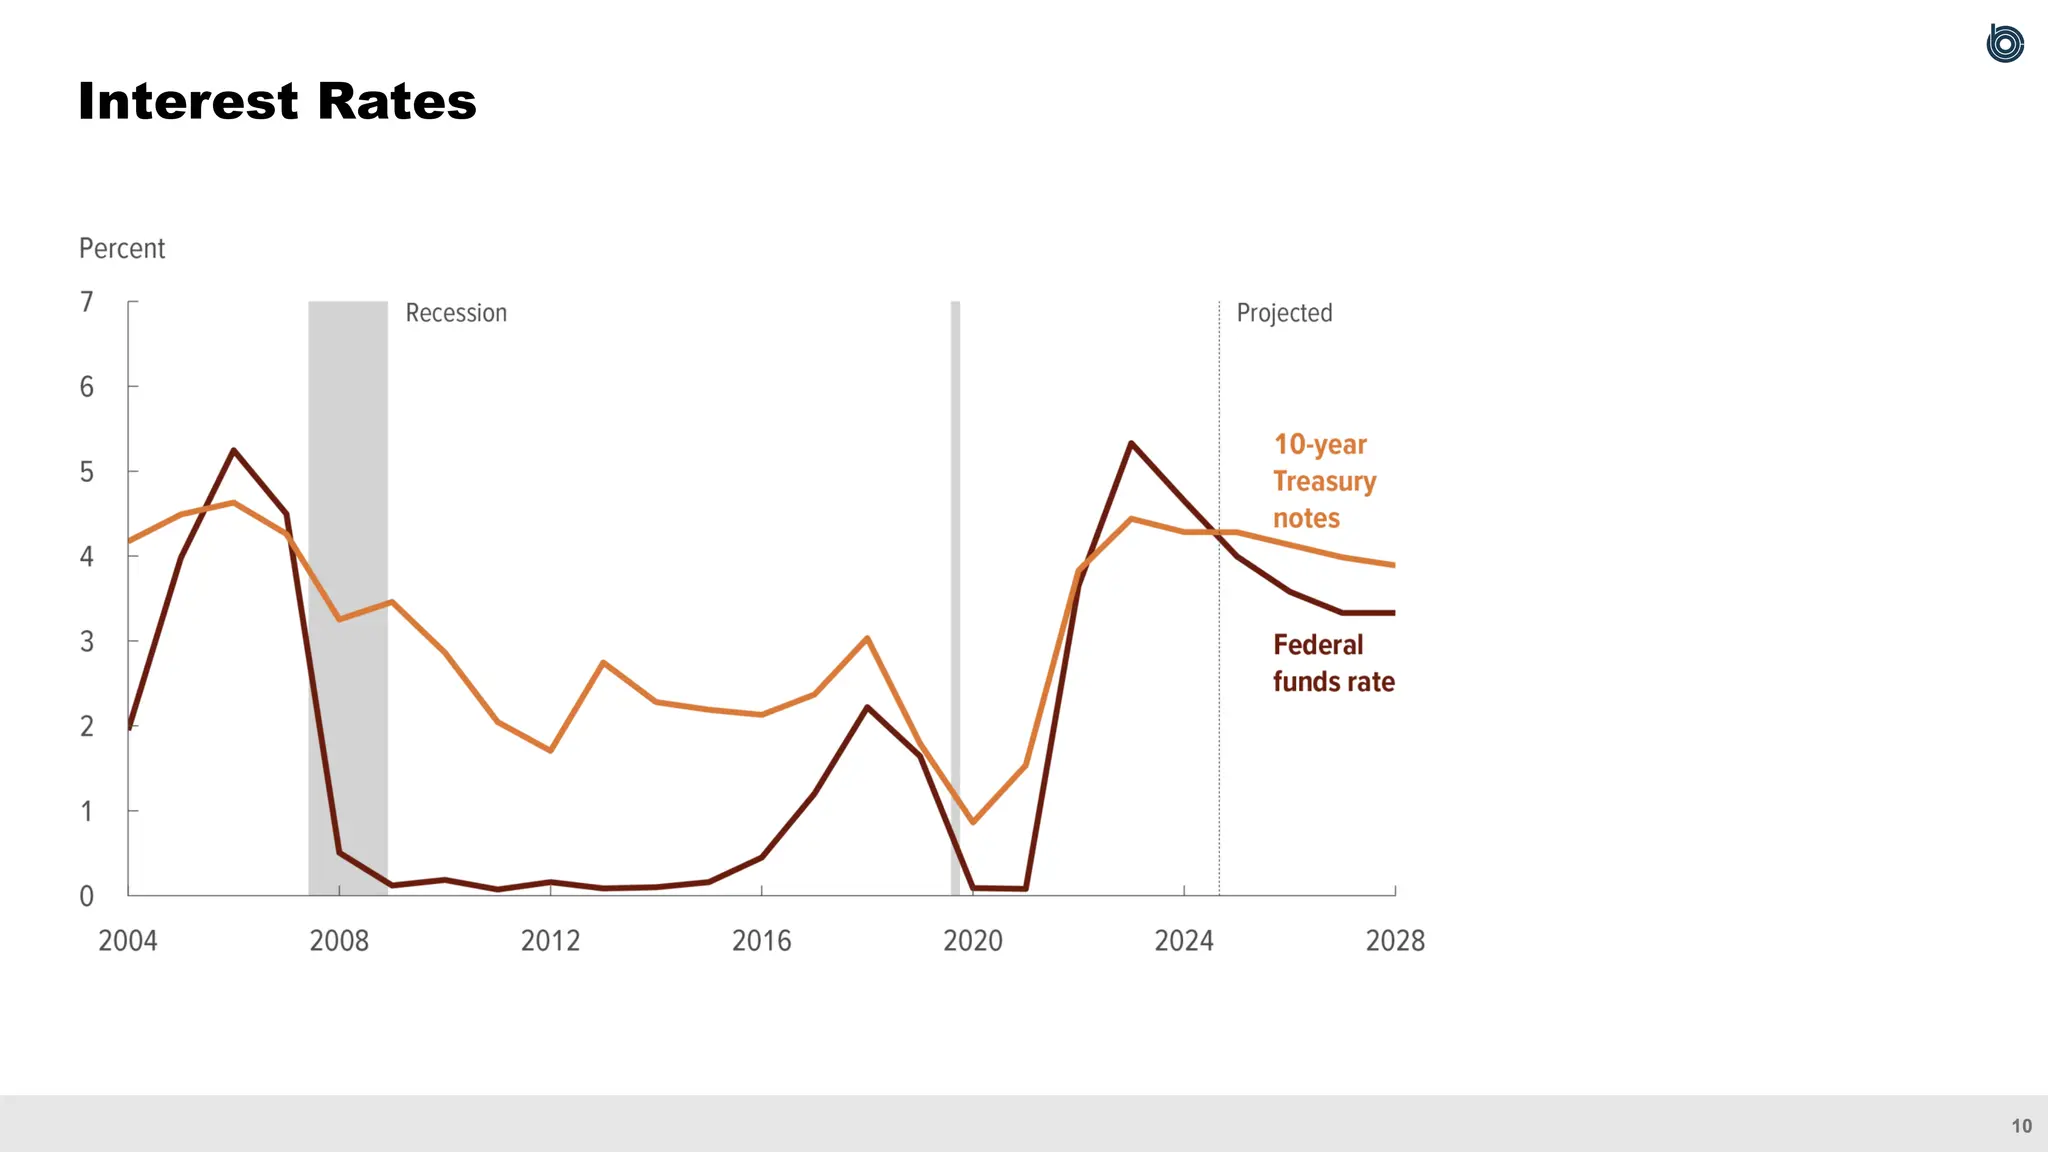
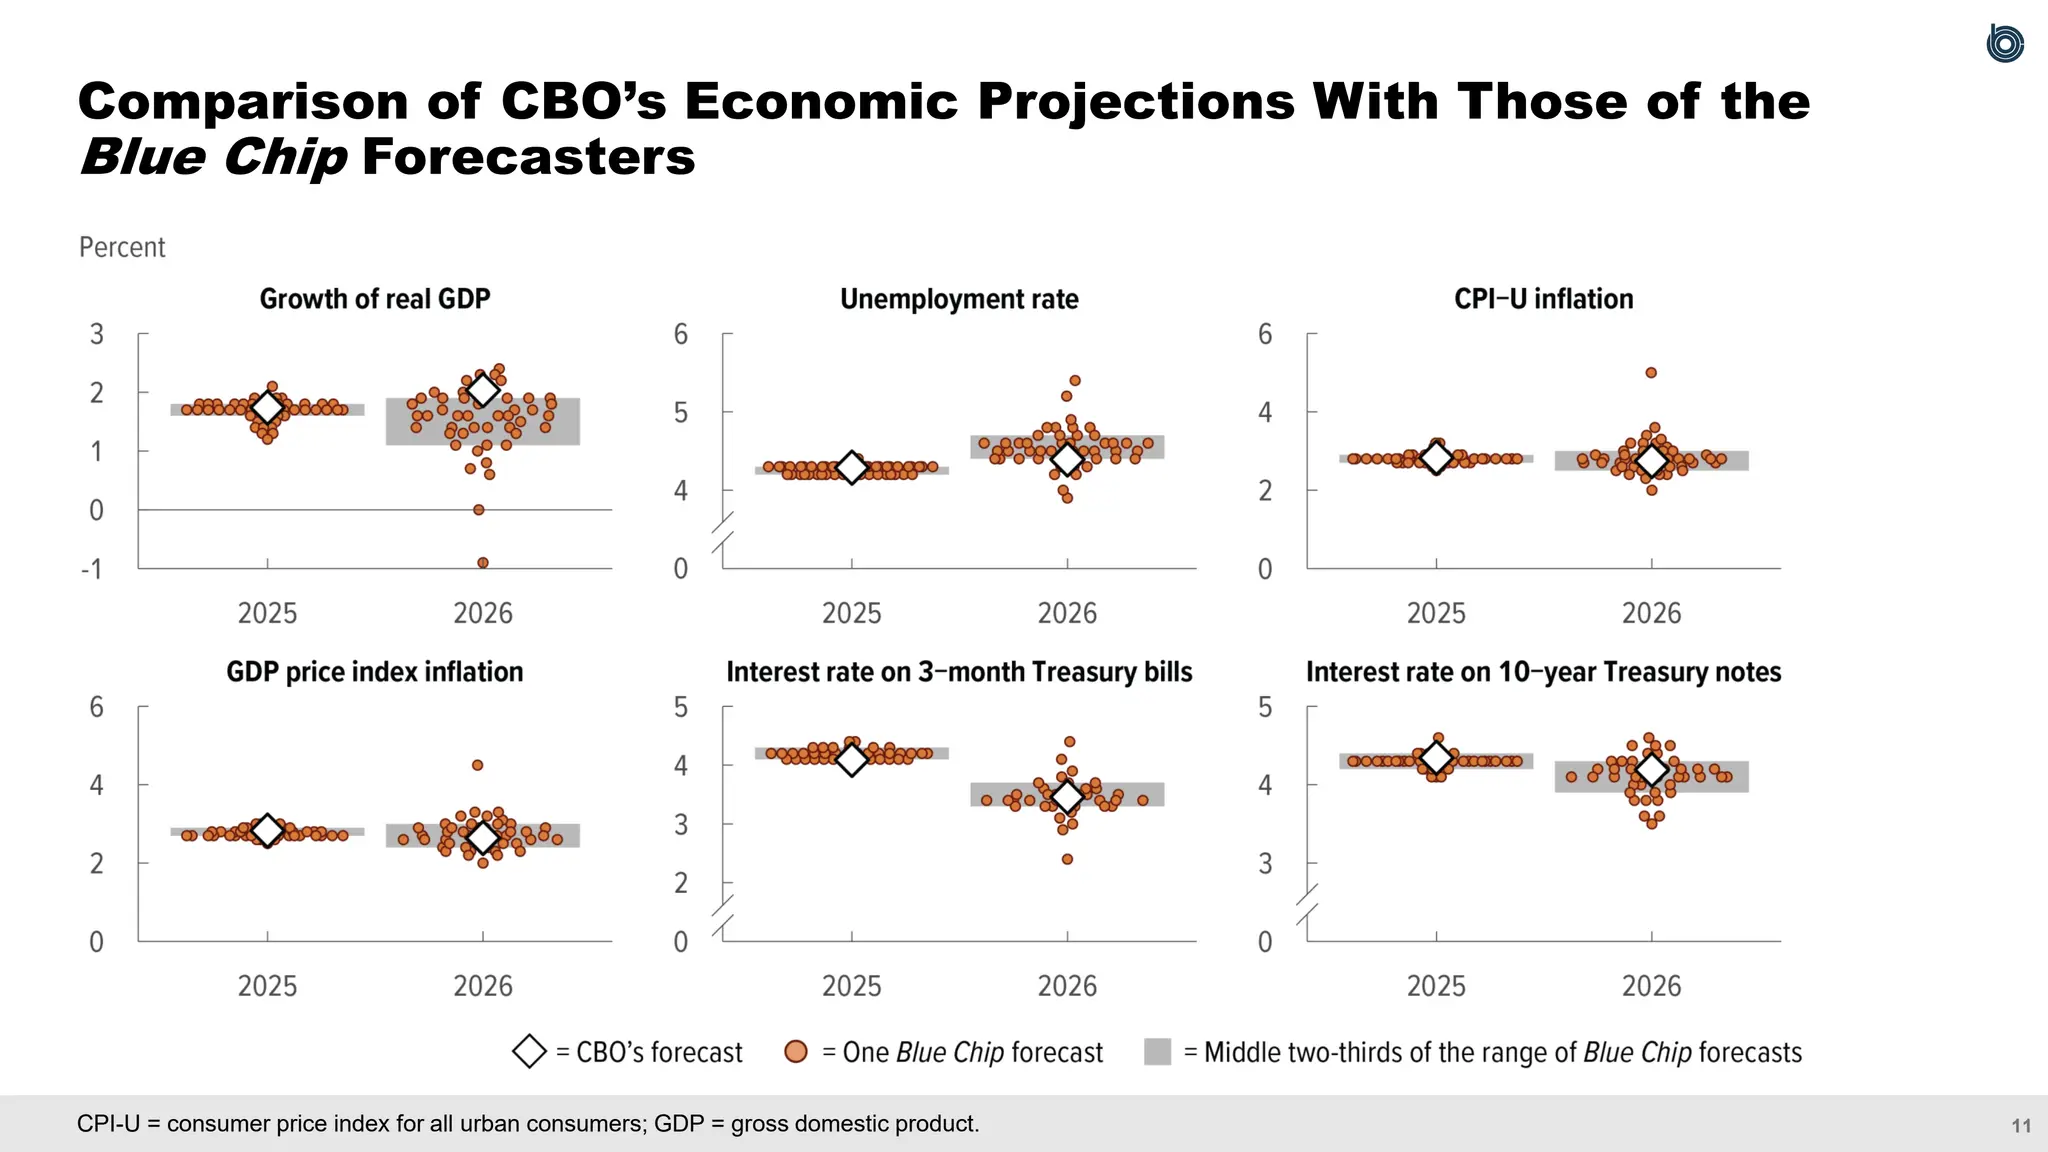
CBO’s Current View of the Economy
in 14 Slides
September 2025
These slides supplement information presented in Congressional Budget Office, CBO’s Current View of the Economy From 2025 to 2028 (September 2025),
www.cbo.gov/publication/61236. Additional notes about this slide deck and definitions of terms used in it appear at the end of the document.
1
GDP = gross domestic product.
Growth of Real GDP
2
GDP = gross domestic product.
Growth of Real GDP in CBO’s January 2025 and
September 2025 Projections
3
a. Incorporates the preliminary national benchmark revision of −911,000 to total nonfarm payroll employment in March 2025 that the Bureau of Labor Statistics (BLS) announced on
September 9, 2025. To calculate the adjusted values, CBO allocated that downward revision evenly to each month from April 2024 to March 2025. The adjusted value for 2025 reflects
that allocation but no changes to growth in payroll employment for later months of the year. CBO did not revise its forecast of net monthly changes in payroll employment. BLS will
incorporate the final benchmark revision into its official estimates in February 2026.
Payroll Employment
4
Unemployment Rate
5
Wage Growth as Measured by the Employment Cost Index for
Wages and Salaries of Workers in Private Industry
6
Labor Force Participation
7
Growth of Real Residential Investment
8
GDP = gross domestic product.
a. Reflects contributions to real GDP growth from spending by individuals, businesses, and federal, state, and local governments on goods and services that are produced abroad. All
else being equal, changes in imports do not affect real GDP growth.
Contributions to the Growth of Real GDP in the Near Term
9
Overall Inflation and Core Inflation as Measured
by the PCE Price Index
PCE = personal consumption expenditures.
10
Interest Rates
11
CPI-U = consumer price index for all urban consumers; GDP = gross domestic product.
Comparison of CBO’s Economic Projections With Those of the
Blue Chip Forecasters
12
GDP = gross domestic product; SPF = Survey of Professional Forecasters.
Comparison of CBO’s Economic Projections With Those in the
Survey of Professional Forecasters
13
CPI-U = consumer price index for all urban consumers; PCE = personal consumption expenditures; SPF = Survey of Professional Forecasters.
Comparison of CBO’s Inflation Projections With Those in the
Survey of Professional Forecasters
14
GDP = gross domestic product; PCE = personal consumption expenditures.
Comparison of CBO’s Economic Projections With Those of
the Federal Reserve
15
The projections presented here reflect tariffs implemented as of August 19, 2025; other
administrative actions taken as of August 28, 2025; and economic developments and laws put in
place as of September 2, 2025. They also reflect CBO’s updated demographic projections,
which are based on laws and policies in place as of July 31, 2025, and which do not incorporate
the effects of subsequent administrative or judicial actions, including those affecting immigration.
All years referred to in these figures are calendar years. Annual growth rates are measured from
the fourth quarter of one calendar year to the fourth quarter of the next year.
Some of the figures use shaded vertical bars to indicate periods of recession. A recession
begins just after a peak in economic activity and runs through the subsequent trough.
Values for 2004 to 2025 reflect data available from the Bureau of Economic Analysis and the
Bureau of Labor Statistics as of early September 2025.
The definitions on the next two slides are presented in the order in which the terms appear in
the figures.
Notes
16
real gross domestic product (GDP). The nation’s economic output adjusted to remove the
effects of changes in prices.
unemployment rate. The percentage of the labor force that is unemployed.
labor force. The number of people age 16 or older in the civilian noninstitutionalized population
who have jobs or who are unemployed (available for work and either seeking work or expecting
to be recalled from a temporary layoff).
labor force participation rate. The percentage of the civilian noninstitutionalized population
age 16 or older that is in the labor force.
potential labor force participation rate. CBO’s estimate of what the labor force participation
rate would be if economic output and other key variables were at their maximum sustainable
amounts.
Definitions
17
real residential investment. Spending on home construction (new single-family and
multifamily structures, manufactured homes, and dormitories), home improvements, and
brokers’ commissions and other ownership-transfer costs.
business fixed investment. Purchases of new equipment, nonresidential structures, and
intellectual property products (such as software) by private companies and nonprofit
institutions. Such investment is labeled “fixed” to distinguish it from inventory investment.
price index for personal consumption expenditures (PCE price index). A summary
measure of the prices of all goods and services that make up personal consumption
expenditures.
consumer price index for all urban consumers (CPI-U). An index of consumer prices based
on a typical market basket of goods and services consumed by all urban consumers.
core inflation. Excludes changes in the prices of food and energy.
Definitions (continued)
18
federal funds rate. Refers to the effective federal funds rate—the median interest rate that
financial institutions charge each other for overnight loans of their monetary reserves, weighted
by loan volume.
Blue Chip. Refers to Blue Chip Economic Indicators, a monthly publication that includes more
than 40 forecasts by private-sector economists.
Definitions (continued)

CBO's Current View of the Economy in 14 Slides

  • 1.
    CBO’s Current Viewof the Economy in 14 Slides September 2025 These slides supplement information presented in Congressional Budget Office, CBO’s Current View of the Economy From 2025 to 2028 (September 2025), www.cbo.gov/publication/61236. Additional notes about this slide deck and definitions of terms used in it appear at the end of the document.
  • 2.
    1 GDP = grossdomestic product. Growth of Real GDP
  • 3.
    2 GDP = grossdomestic product. Growth of Real GDP in CBO’s January 2025 and September 2025 Projections
  • 4.
    3 a. Incorporates thepreliminary national benchmark revision of −911,000 to total nonfarm payroll employment in March 2025 that the Bureau of Labor Statistics (BLS) announced on September 9, 2025. To calculate the adjusted values, CBO allocated that downward revision evenly to each month from April 2024 to March 2025. The adjusted value for 2025 reflects that allocation but no changes to growth in payroll employment for later months of the year. CBO did not revise its forecast of net monthly changes in payroll employment. BLS will incorporate the final benchmark revision into its official estimates in February 2026. Payroll Employment
  • 5.
  • 6.
    5 Wage Growth asMeasured by the Employment Cost Index for Wages and Salaries of Workers in Private Industry
  • 7.
  • 8.
    7 Growth of RealResidential Investment
  • 9.
    8 GDP = grossdomestic product. a. Reflects contributions to real GDP growth from spending by individuals, businesses, and federal, state, and local governments on goods and services that are produced abroad. All else being equal, changes in imports do not affect real GDP growth. Contributions to the Growth of Real GDP in the Near Term
  • 10.
    9 Overall Inflation andCore Inflation as Measured by the PCE Price Index PCE = personal consumption expenditures.
  • 11.
  • 12.
    11 CPI-U = consumerprice index for all urban consumers; GDP = gross domestic product. Comparison of CBO’s Economic Projections With Those of the Blue Chip Forecasters
  • 13.
    12 GDP = grossdomestic product; SPF = Survey of Professional Forecasters. Comparison of CBO’s Economic Projections With Those in the Survey of Professional Forecasters
  • 14.
    13 CPI-U = consumerprice index for all urban consumers; PCE = personal consumption expenditures; SPF = Survey of Professional Forecasters. Comparison of CBO’s Inflation Projections With Those in the Survey of Professional Forecasters
  • 15.
    14 GDP = grossdomestic product; PCE = personal consumption expenditures. Comparison of CBO’s Economic Projections With Those of the Federal Reserve
  • 16.
    15 The projections presentedhere reflect tariffs implemented as of August 19, 2025; other administrative actions taken as of August 28, 2025; and economic developments and laws put in place as of September 2, 2025. They also reflect CBO’s updated demographic projections, which are based on laws and policies in place as of July 31, 2025, and which do not incorporate the effects of subsequent administrative or judicial actions, including those affecting immigration. All years referred to in these figures are calendar years. Annual growth rates are measured from the fourth quarter of one calendar year to the fourth quarter of the next year. Some of the figures use shaded vertical bars to indicate periods of recession. A recession begins just after a peak in economic activity and runs through the subsequent trough. Values for 2004 to 2025 reflect data available from the Bureau of Economic Analysis and the Bureau of Labor Statistics as of early September 2025. The definitions on the next two slides are presented in the order in which the terms appear in the figures. Notes
  • 17.
    16 real gross domesticproduct (GDP). The nation’s economic output adjusted to remove the effects of changes in prices. unemployment rate. The percentage of the labor force that is unemployed. labor force. The number of people age 16 or older in the civilian noninstitutionalized population who have jobs or who are unemployed (available for work and either seeking work or expecting to be recalled from a temporary layoff). labor force participation rate. The percentage of the civilian noninstitutionalized population age 16 or older that is in the labor force. potential labor force participation rate. CBO’s estimate of what the labor force participation rate would be if economic output and other key variables were at their maximum sustainable amounts. Definitions
  • 18.
    17 real residential investment.Spending on home construction (new single-family and multifamily structures, manufactured homes, and dormitories), home improvements, and brokers’ commissions and other ownership-transfer costs. business fixed investment. Purchases of new equipment, nonresidential structures, and intellectual property products (such as software) by private companies and nonprofit institutions. Such investment is labeled “fixed” to distinguish it from inventory investment. price index for personal consumption expenditures (PCE price index). A summary measure of the prices of all goods and services that make up personal consumption expenditures. consumer price index for all urban consumers (CPI-U). An index of consumer prices based on a typical market basket of goods and services consumed by all urban consumers. core inflation. Excludes changes in the prices of food and energy. Definitions (continued)
  • 19.
    18 federal funds rate.Refers to the effective federal funds rate—the median interest rate that financial institutions charge each other for overnight loans of their monetary reserves, weighted by loan volume. Blue Chip. Refers to Blue Chip Economic Indicators, a monthly publication that includes more than 40 forecasts by private-sector economists. Definitions (continued)