How Economists Can Help Inform Economic and Budget Analysis Used by the U.S. Congress
1.
Presentation at theAllied Social Science
Associations (ASSA) Annual Meeting
January 3, 2026
Jeffrey Kling
Heidi Williams
How Economists Can Help Inform
Economic and Budget Analysis
Used by the U.S. Congress
For information about the meeting, see www.aeaweb.org/conference/2026/preliminary/2411.
2.
1
Since 1975, CBOhas produced nonpartisan and independent analyses of
budgetary and economic issues to support the Congressional budget process.
CBO publishes various products that provide the results of its modeling:
– Economic and baseline projections of revenues and spending
– Cost estimates for proposed legislation, sometimes in collaboration with
the staff of the Joint Committee on Taxation
– Analytic reports as requested by the Congress
For that work, CBO focuses on economic factors—such as labor supply,
investment, and productivity—rather than on producer or consumer surplus.
CBO makes assessments on the basis of its understanding of federal programs
and revenue sources, relevant research literature, analysis of data, and
consultation with outside experts—relying heavily on economic research.
Economic and Budget Analysis That CBO Provides to the Congress
3.
2
CBO’s Calls forResearch
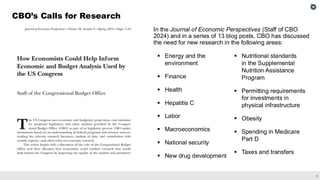
In the Journal of Economic Perspectives (Staff of CBO
2024) and in a series of 13 blog posts, CBO has discussed
the need for new research in the following areas:
▪ Energy and the
environment
▪ Finance
▪ Health
▪ Hepatitis C
▪ Labor
▪ Macroeconomics
▪ National security
▪ New drug development
▪ Nutritional standards
in the Supplemental
Nutrition Assistance
Program
▪ Permitting requirements
for investments in
physical infrastructure
▪ Obesity
▪ Spending in Medicare
Part D
▪ Taxes and transfers
4.
3
The research literaturecan leave key gaps in the base of evidence that is needed
to comprehensively analyze the effects of policy changes on the economy and
government budgets. CBO's work for the Congress provides one lens for
identifying those gaps.
This presentation does the following:
▪ Provides background about CBO’s analyses, emphasizing cases in which
CBO's budgetary estimates are particularly salient to Congressional debates
▪ Presents two examples that illustrate how research informs budget analysis:
– Changes in food assistance
– Changes in permitting requirements for investments in physical
infrastructure
▪ Highlights opportunities for research and other ways to contribute to
CBO’s work
The Role of Research in Budget Analysis
5
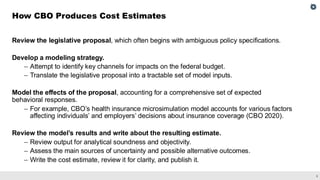
Review the legislativeproposal, which often begins with ambiguous policy specifications.
Develop a modeling strategy.
– Attempt to identify key channels for impacts on the federal budget.
– Translate the legislative proposal into a tractable set of model inputs.
Model the effects of the proposal, accounting for a comprehensive set of expected
behavioral responses.
– For example, CBO’s health insurance microsimulation model accounts for various factors
affecting individuals’ and employers’ decisions about insurance coverage (CBO 2020).
Review the model’s results and write about the resulting estimate.
– Review output for analytical soundness and objectivity.
– Assess the main sources of uncertainty and possible alternative outcomes.
– Write the cost estimate, review it for clarity, and publish it.
How CBO Produces Cost Estimates
7.
6
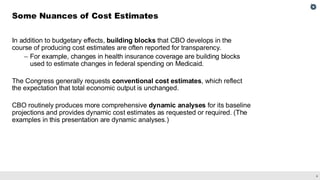
In addition tobudgetary effects, building blocks that CBO develops in the
course of producing cost estimates are often reported for transparency.
– For example, changes in health insurance coverage are building blocks
used to estimate changes in federal spending on Medicaid.
The Congress generally requests conventional cost estimates, which reflect
the expectation that total economic output is unchanged.
CBO routinely produces more comprehensive dynamic analyses for its baseline
projections and provides dynamic cost estimates as requested or required. (The
examples in this presentation are dynamic analyses.)
Some Nuances of Cost Estimates
8.
7
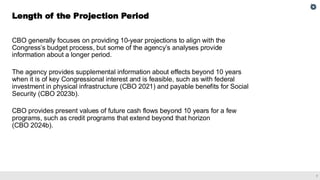
CBO generally focuseson providing 10-year projections to align with the
Congress’s budget process, but some of the agency’s analyses provide
information about a longer period.
The agency provides supplemental information about effects beyond 10 years
when it is of key Congressional interest and is feasible, such as with federal
investment in physical infrastructure (CBO 2021) and payable benefits for Social
Security (CBO 2023b).
CBO provides present values of future cash flows beyond 10 years for a few
programs, such as credit programs that extend beyond that horizon
(CBO 2024b).
Length of the Projection Period
9.
8
CBO regularly reviewsits projections of budgetary (CBO 2024a) and economic outcomes
(CBO 2025a), compares them with actual outcomes, and identifies sources of the
differences.
The agency’s estimates are updated when new information becomes available.
– CBO incorporated new data about the share of imports that can access lower duty
rates by complying with the United States–Mexico–Canada Agreement (Swagel 2025).
When the requisite data are available, the agency evaluates the accuracy of its cost
estimates as well.
– CBO (2017) reviewed projections made in March 2010 and May 2013 about key
components of the Affordable Care Act, comparing those projections with actual
outcomes.
– CBO (2018) reviewed estimates of the effects on spending over the 2009–2013 period
of increased Supplemental Nutrition Assistance Program (SNAP) benefits provided by
the American Recovery and Reinvestment Act of 2009.
How CBO Evaluates Its Accuracy
10
The Supplemental NutritionAssistance Program (SNAP) provides benefits that
help eligible low-income households purchase food.
CBO estimates that in 2025, an average of 42.5 million people will receive SNAP
benefits each month. On average, participants received $188 per month.
Two examples of recent Congressional interest:
– The addition of nutritional standards
– H.R. 1 (the 2025 reconciliation act as passed by the House), which would
have modified benefits, eligibility, and cost sharing
The Supplemental Nutrition Assistance Program
12.
11
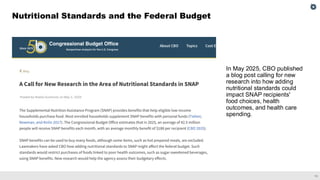
Nutritional Standards andthe Federal Budget
In May 2025, CBO published
a blog post calling for new
research into how adding
nutritional standards could
impact SNAP recipients'
food choices, health
outcomes, and health care
spending.
13.
12
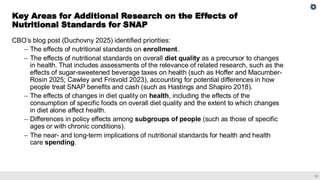
CBO’s blog post(Duchovny 2025) identified priorities:
– The effects of nutritional standards on enrollment.
– The effects of nutritional standards on overall diet quality as a precursor to changes
in health. That includes assessments of the relevance of related research, such as the
effects of sugar-sweetened beverage taxes on health (such as Hoffer and Macumber-
Rosin 2025; Cawley and Frisvold 2023), accounting for potential differences in how
people treat SNAP benefits and cash (such as Hastings and Shapiro 2018).
– The effects of changes in diet quality on health, including the effects of the
consumption of specific foods on overall diet quality and the extent to which changes
in diet alone affect health.
– Differences in policy effects among subgroups of people (such as those of specific
ages or with chronic conditions).
– The near- and long-term implications of nutritional standards for health and health
care spending.
Key Areas for Additional Research on the Effects of
Nutritional Standards for SNAP
14.
13
The change infederal outlays from each provision are over the 2025–2034 period and do not account for interactions among provisions. Because of overlap in the affected
populations, the effects of simultaneously enacting all of the provisions would differ from the sum of the effects of enacting each provision separately.
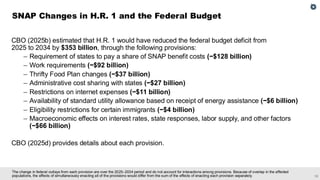
CBO (2025b) estimated that H.R. 1 would have reduced the federal budget deficit from
2025 to 2034 by $353 billion, through the following provisions:
– Requirement of states to pay a share of SNAP benefit costs (−$128 billion)
– Work requirements (−$92 billion)
– Thrifty Food Plan changes (−$37 billion)
– Administrative cost sharing with states (−$27 billion)
– Restrictions on internet expenses (−$11 billion)
– Availability of standard utility allowance based on receipt of energy assistance (−$6 billion)
– Eligibility restrictions for certain immigrants (−$4 billion)
– Macroeconomic effects on interest rates, state responses, labor supply, and other factors
(−$66 billion)
CBO (2025d) provides details about each provision.
SNAP Changes in H.R. 1 and the Federal Budget
15.
14
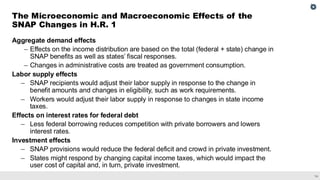
Aggregate demand effects
–Effects on the income distribution are based on the total (federal + state) change in
SNAP benefits as well as states’ fiscal responses.
– Changes in administrative costs are treated as government consumption.
Labor supply effects
– SNAP recipients would adjust their labor supply in response to the change in
benefit amounts and changes in eligibility, such as work requirements.
– Workers would adjust their labor supply in response to changes in state income
taxes.
Effects on interest rates for federal debt
– Less federal borrowing reduces competition with private borrowers and lowers
interest rates.
Investment effects
– SNAP provisions would reduce the federal deficit and crowd in private investment.
– States might respond by changing capital income taxes, which would impact the
user cost of capital and, in turn, private investment.
The Microeconomic and Macroeconomic Effects of the
SNAP Changes in H.R. 1
16.
15
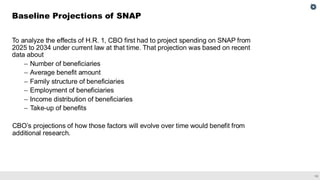
To analyze theeffects of H.R. 1, CBO first had to project spending on SNAP from
2025 to 2034 under current law at that time. That projection was based on recent
data about
– Number of beneficiaries
– Average benefit amount
– Family structure of beneficiaries
– Employment of beneficiaries
– Income distribution of beneficiaries
– Take-up of benefits
CBO’s projections of how those factors will evolve over time would benefit from
additional research.
Baseline Projections of SNAP
17.
16
H.R. 1 proposedchanging SNAP from being fully federally funded to instead having states pay
between 5 percent and 25 percent of SNAP benefits. The percentage that states paid would
have depended on their past rate of making errors as determined by audits.
CBO projected that the reduction in federal spending on SNAP benefits (−$255 billion) would
have been partially offset by an increase in state spending ($85 billion) from 2025 to 2034.
The agency projected that, in response to being required to pay more, some states would
modify benefits or eligibility or leave the program altogether.
– CBO estimated state responses in the aggregate using a probabilistic approach to
account for the range of possible outcomes.
– The agency used research literature about how states respond to matching requirements
(for example, Baicker 2001) and data about similar programs, such as Medicaid, to
estimate the extent of responses.
A related matching requirement was enacted this year, and research about its effects would
inform future analyses.
Modeling State Responses
18.
17
The matching requirementwould have caused states to adjust their budgets in
ways that, in turn, would have affected the federal budget.
CBO used the findings in Rueben, Randall, and Boddupalli (2018), which
followed a similar empirical approach to that of Poterba (1994) and Clemens and
Miran (2012), to determine how states adjusted their revenues, expenditures, and
other means of financing in response to an immediate change in their fiscal
position. In that analysis, they found that from 1990 to 2015:
– When states experienced a $1 deficit shock, they typically reduced
spending by $0.26 and increased revenues by $0.08 in the current year.
They increased revenues by an additional $0.14 in the following year.
– When states experienced a $1 surplus shock, they generally made no
change to spending, reduced revenues by $0.04 in the current year, and
further reduced revenues by $0.08 in the following year.
Modeling Short-Term State Responses
19.
18
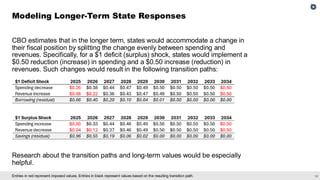
Entries in redrepresent imposed values. Entries in black represent values based on the resulting transition path.
CBO estimates that in the longer term, states would accommodate a change in
their fiscal position by splitting the change evenly between spending and
revenues. Specifically, for a $1 deficit (surplus) shock, states would implement a
$0.50 reduction (increase) in spending and a $0.50 increase (reduction) in
revenues. Such changes would result in the following transition paths:
Research about the transition paths and long-term values would be especially
helpful.
Modeling Longer-Term State Responses
20.
19
Synthesizing the researchliterature (for example, Hotchkiss, Moore, and Rios-Avila 2024;
studies reviewed in McClelland and Mok 2012), the agency estimated two types of effects
stemming from increases in state taxes on the supply of labor:
– Substitution effects. If the amount available to households after taxes and transfers from
an additional dollar of labor earnings decreased by 10 percent relative to current law,
SNAP recipients with the lowest income would reduce their hours of work by 3.1 percent.
– Income effects. If income after taxes and transfers decreased by 10 percent relative to
current law, SNAP recipients would increase their hours of work by 0.5 percent.
Decreases in the maximum benefit amount, as determined by the cost of the Thrifty Food Plan,
have substitution and income effects for some beneficiaries, such as single individuals with low
wages. For others, such as single parents with low wages and several children, only income
effects occur because the reduction in benefits from working is unchanged. Hours worked
weighted by earnings is a key input into economic projections.
Research about differences in the effects of SNAP changes compared with the effects of tax
changes, such as in their salience, would be especially helpful.
Modeling Incentives and Labor Supply
21.
20
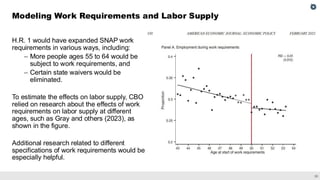
H.R. 1 wouldhave expanded SNAP work
requirements in various ways, including:
– More people ages 55 to 64 would be
subject to work requirements, and
– Certain state waivers would be
eliminated.
To estimate the effects on labor supply, CBO
relied on research about the effects of work
requirements on labor supply at different
ages, such as Gray and others (2023), as
shown in the figure.
Additional research related to different
specifications of work requirements would be
especially helpful.
Modeling Work Requirements and Labor Supply
22.
21
Data are forcalendar years.
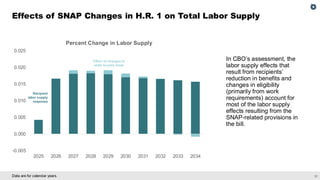
Effects of SNAP Changes in H.R. 1 on Total Labor Supply
In CBO’s assessment, the
labor supply effects that
result from recipients’
reduction in benefits and
changes in eligibility
(primarily from work
requirements) account for
most of the labor supply
effects resulting from the
SNAP-related provisions in
the bill.
-0.005
0.000
0.005
0.010
0.015
0.020
0.025
2025 2026 2027 2028 2029 2030 2031 2032 2033 2034
Percent Change in Labor Supply
Effect of changes to
state income taxes
Recipient
labor supply
response
23
Building physical infrastructure,such as that related to energy and transportation,
generally requires complying with a variety of procedural and substantive legal
requirements at the federal, state, local, and tribal level.
For instance, a notice in the Federal Register (Department of Homeland Security
2023) listed roughly 30 federal requirements relevant to border wall construction,
including requirements in place under the National Environmental Policy Act
(NEPA), the Endangered Species Act, and the Clean Water Act.
As shorthand, in this presentation we refer to the general set of such procedural
and substantive legal requirements as permitting requirements.
Permitting Requirements
25.
24
The title ofthis slide has been updated since its original publication.
NEPA requires the production of information about how certain infrastructure projects
would affect communities and the environment.
The process of complying with those requirements generally increases the expected cost
and time required to complete affected infrastructure projects.
– Some projects, such as highway repair, have categorical exclusions (CATEXs)—
not an exemption from NEPA, but an abbreviated type of NEPA compliance.
– About 12,000 environmental assessments (EAs) are produced each year. These
can be long: The EA for a Manhattan congestion pricing zone was about 4,000
pages.
– About 150 environmental impact statements (EISs), for projects such as new
highway construction, are produced each year.
The possibility of NEPA-related litigation also generally increases the uncertainty
associated with investments in affected projects because federal courts allow plaintiffs to
challenge a federal agency’s compliance with NEPA under the Administrative Procedure
Act (5 U.S.C. §§ 701–706; Hite 2025).
The National Environmental Policy Act
26.
25
The title ofthis slide has been updated since its original publication.
The Congress periodically considers legislation that would change NEPA and
other permitting requirements, but there is currently limited available evidence on
the expected effects of such changes:
– Lewis (2019) on oil and gas
– Brooks and Liscow (2023) on highway construction
– Liscow (2025) on the overall permitting process
CBO’s ability to provide consistent and comprehensive analysis of permitting-
related legislation, and to incorporate the full economic and budgetary effects of
enacted legislation and administrative actions into the baseline, depends heavily
on the research literature describing and documenting those effects.
The National Environmental Policy Act (Continued)
27.
26
One example ofa permitting-related cost estimate is from H.R. 1 last year, which
would have allowed project sponsors to pay an opt-in fee in exchange for faster
processing of EAs and EISs and would have precluded judicial review of those
EAs and EISs.
Some experts have conjectured that such changes to judicial review, if enacted,
could meaningfully decrease the time needed to build physical infrastructure
projects (Bagley 2025, Hochman 2025).
Estimating the Effects of a Permitting Provision in H.R. 1
28.
27
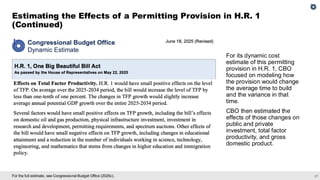
For the fullestimate, see Congressional Budget Office (2025c).
Estimating the Effects of a Permitting Provision in H.R. 1
(Continued)
For its dynamic cost
estimate of this permitting
provision in H.R. 1, CBO
focused on modeling how
the provision would change
the average time to build
and the variance in that
time.
CBO then estimated the
effects of those changes on
public and private
investment, total factor
productivity, and gross
domestic product.
29.
28
For one exampleof research about how changes in regulation affect investment, see Budish and others (2015).
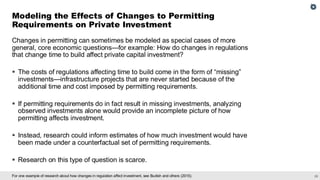
Changes in permitting can sometimes be modeled as special cases of more
general, core economic questions—for example: How do changes in regulations
that change time to build affect private capital investment?
▪ The costs of regulations affecting time to build come in the form of “missing”
investments—infrastructure projects that are never started because of the
additional time and cost imposed by permitting requirements.
▪ If permitting requirements do in fact result in missing investments, analyzing
observed investments alone would provide an incomplete picture of how
permitting affects investment.
▪ Instead, research could inform estimates of how much investment would have
been made under a counterfactual set of permitting requirements.
▪ Research on this type of question is scarce.
Modeling the Effects of Changes to Permitting
Requirements on Private Investment
30.
29
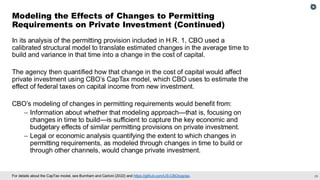
For details aboutthe CapTax model, see Burnham and Carloni (2022) and https://github.com/US-CBO/captax.
In its analysis of the permitting provision included in H.R. 1, CBO used a
calibrated structural model to translate estimated changes in the average time to
build and variance in that time into a change in the cost of capital.
The agency then quantified how that change in the cost of capital would affect
private investment using CBO’s CapTax model, which CBO uses to estimate the
effect of federal taxes on capital income from new investment.
CBO’s modeling of changes in permitting requirements would benefit from:
– Information about whether that modeling approach—that is, focusing on
changes in time to build—is sufficient to capture the key economic and
budgetary effects of similar permitting provisions on private investment.
– Legal or economic analysis quantifying the extent to which changes in
permitting requirements, as modeled through changes in time to build or
through other channels, would change private investment.
Modeling the Effects of Changes to Permitting
Requirements on Private Investment (Continued)
31.
30
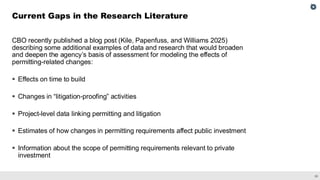
CBO recently publisheda blog post (Kile, Papenfuss, and Williams 2025)
describing some additional examples of data and research that would broaden
and deepen the agency’s basis of assessment for modeling the effects of
permitting-related changes:
▪ Effects on time to build
▪ Changes in “litigation-proofing” activities
▪ Project-level data linking permitting and litigation
▪ Estimates of how changes in permitting requirements affect public investment
▪ Information about the scope of permitting requirements relevant to private
investment
Current Gaps in the Research Literature
32.
31
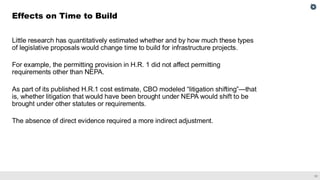
Little research hasquantitatively estimated whether and by how much these types
of legislative proposals would change time to build for infrastructure projects.
For example, the permitting provision in H.R. 1 did not affect permitting
requirements other than NEPA.
As part of its published H.R.1 cost estimate, CBO modeled “litigation shifting”—that
is, whether litigation that would have been brought under NEPA would shift to be
brought under other statutes or requirements.
The absence of direct evidence required a more indirect adjustment.
Effects on Time to Build
33.
32
CBO is alsoon the lookout for new research on several other topics related to
estimating changes in time to build, including the following:
▪ The amount, characteristics, and outcomes of permitting-related litigation,
similar to the data on NEPA litigation compiled by the Breakthrough Institute
(Chiappa and others 2024)
▪ What share of projects generally pause construction during the litigation
process, either because of preliminary injunctions or voluntary stoppages
▪ Whether and to what extent states or localities would change their permitting
requirements or processes in response to federal policy changes
▪ How the effects of a given change in permitting requirements would differ
across industries
Effects on Time to Build (Continued)
34.
33
Both the CongressionalResearch Service (Luther 2011) and the Government
Accountability Office (2014) have observed that litigation risk may increase the
time and cost of preparing NEPA applications (for example, by incorporating
analyses of additional alternative scenarios).
In principle, an exemption from judicial review could reduce the need for
agencies (or contractors on their behalf) to undertake such activity, which could
reduce the cost and time required for those projects.
CBO would benefit from legal and economic analysis quantifying whether and to
what extent such activities would change in response to exemptions from judicial
review or other changes in permitting requirements.
Changes in “Litigation-Proofing” Activities
35.
34
The database canbe accessed at https://criticalmaterialproject.netlify.app/.
A team at Indiana University’s Paul H. O’Neill School of Public and Environmental
Affairs constructed DEV-CaMP, a database that links project-level data on critical
minerals projects with records of financial support (including federal loans), land
ownership, litigation, and permitting.
CBO would benefit from additional linked project-level data.
Project-Level Data Linking Permitting and Litigation
36.
35
In June 2025,a bipartisan group of House members expressed interest in
incorporating provisions in future surface transportation reauthorization bills that
would shorten the time required to comply with permitting requirements.
Targeted changes to permitting have been implemented for some other forms of
public investment, including border wall construction (Department of Homeland
Security 2023).
Targeted changes to permitting have also been implemented for some publicly
subsidized private investments, such as certain semiconductor projects
subsidized through the CHIPS and Science Act (CBO 2023a).
Estimates of How Changes in Permitting Requirements
Affect Public Investment
37.
36
Brooks and Liscow(2023) documented evidence suggesting that the addition of
permitting requirements, such as NEPA’s enactment in 1970, contributed to
increases in the cost of highway construction.
CBO would benefit from additional information about how changes in permitting
affect public investment.
Estimates of How Changes in Permitting Requirements
Affect Public Investment (Continued)
38.
37
In dynamic analysesof how changes in permitting requirements would affect
private investment, CBO constructs projections of which types of private
investment are subject to different permitting statutes, such as NEPA or the Clean
Water Act.
Linking permitting requirements to industries is straightforward in some cases.
– Example: Natural Gas Act of 1938
But other determinations are much less straightforward.
– Example: NEPA’s “major federal actions”
In its analysis of H.R. 1, the agency relied in part on RegData—a database
linking federal regulations to industries that was created by Al-Ubaydli and
McLaughlin (2014) at George Mason University’s Mercatus Center and is now
hosted at QuantGov.org.
Information About the Scope of Permitting Requirements
Relevant to Private Investment
39.
38
CBO’s modeling ofchanges in permitting requirements would benefit from
research mapping the relevance of different permitting requirements to private
investment in different industries or geographic areas.
– Example: Greenhill and others (2024) on the Clean Water Act
CBO would also benefit from legal or economic analysis proposing and validating
methods for projecting how changes to particular permitting requirements
relevant to private investment in a given industry would affect such investment.
– Example: Jaffe (1986) as reapplied in Bloom, Schankerman, and Van
Reenen (2013)
– Such frameworks could provide insight into which permitting requirements
are likely to be the binding constraints on investment and how different
legislative proposals would be expected to change investment.
Information About the Scope of Permitting Requirements
Relevant to Private Investment (Continued)
40
CBO would benefitfrom researchers engaging with the agency’s work by:
▪ Considering CBO’s calls for research
▪ Accepting invitations to review preliminary documents
▪ Applying to CBO’s dissertation fellows program
▪ Applying to CBO’s visiting scholars program
In their writing, researchers can inform analyses used by the Congress by
providing additional context about their findings through descriptive statistics and
discussion of the external validity of their estimates. Ideas about how to map
existing results to new populations, different economic conditions, or related
policies are especially helpful.
Opportunities to Engage
42.
41
Omar Al-Ubaydli andPatrick A. McLaughlin (2014), RegData: A Numerical Database on Industry-Specific Regulations
for All U.S. Industries and Federal Regulations, 1997–2012, George Mason University Mercatus Center Working
Paper No. 12-20 (SSRN, November), https://tinyurl.com/tzh4brkn.
Nicholas Bagley (2015), “Defanging NEPA: Can You Buy Your Way Out of Judicial Review?” Divided Argument (blog
entry, May 12), https://blog.dividedargument.com/p/defanging-nepa.
Katherine Baicker (2001), “Government Decision-Making and the Incidence of Federal Mandates,” Journal of Public
Economics, vol. 82, no. 2 (November), pp. 147–194, https://doi.org/10.1016/S0047-2727(00)00149-3.
Nicholas Bloom, Mark Schankerman, and John Van Reenen (2013), “Identifying Technology Spillovers and Product
Market Rivalry,” Econometrica, vol. 81, no. 4 (July), pp. 1347–1393, https://doi.org/10.3982/ECTA9466.
Leah Brooks and Zachary Liscow (2023), “Infrastructure Costs,” American Economic Journal: Applied Economics, vol.
15, no. 2 (April), pp. 1–30, https://doi.org/10.1257/app.20200398.
Eric Budish, Benjamin N. Roin, and Heidi Williams (2015), “Do Firms Underinvest in Long-Term Research? Evidence
From Cancer Clinical Trials,” American Economic Review, vol. 105, no. 7 (July), pp. 2044–2085,
https://doi.org/10.1257/aer.20131176.
Works Cited
43.
42
Paul Burnham andDorian Carloni (2022), CBO’s Model for Estimating the Effect That Federal Taxes Have on Capital
Income From New Investment, Working Paper 2022-01 (Congressional Budget. Office,February),
www.cbo.gov/publication/57429.
John Cawley and David Frisvold (2023), “Review: Taxes on Sugar-Sweetened Beverages: Political Economy, and
Effects on Prices, Purchases, and Consumption,” Food Policy, vol. 117 (May),
https://doi.org/10.1016/j.foodpol.2023.102441.
Nikki Chiappa and others (2024), Understanding NEPA Litigation: A Systematic Review of Recent NEPA-Related
Appellate Court Cases (Breakthrough Institute, July), https://tinyurl.com/56s7ahbp.
Jeffrey Clemens and Stephen Miran (2012), “Fiscal Policy Multipliers on Subnational Government Spending,” American
Economic Journal: Economic Policy, vol. 4, no. 2 (May), pp. 46–68, https://doi.org/10.1257/pol.4.2.46.
Congressional Budget Office (2017), CBO’s Record of Projecting Subsidies for Health Insurance Under the Affordable
Care Act: 2014 to 2016 (December), www.cbo.gov/publication/53094.
Works Cited (Continued)
44.
43
Congressional Budget Office(2018), A Review of CBO’s Estimate of the Effects of the Recovery Act on SNAP
(December), www.cbo.gov/publication/54864.
Congressional Budget Office (2020), “How CBO and JCT Analyze Major Proposals That Would Affect Health
Insurance Choices” (January), www.cbo.gov/publication/56053.
Congressional Budget Office (2021), Effects of Physical Infrastructure Spending on the Economy and the Budget
Under Two Illustrative Scenarios (August), www.cbo.gov/publication/57327.
Congressional Budget Office (2023a), estimated changes in direct spending and revenues of S. 2226, the National
Defense Authorization Act for Fiscal Year 2024, www.cbo.gov/publication/59643.
Congressional Budget Office (2023b), The Long-Term Budget Outlook Under Alternative Scenarios for the Economy
and the Budget (July), www.cbo.gov/publication/59233.
Congressional Budget Office (2024a), An Evaluation of CBO’s Projections of Deficits and Debt From 1984 to 2023
(December), www.cbo.gov/publication/60664.
Works Cited (Continued)
45.
44
Congressional Budget Office(2024b), Estimates of the Cost of Federal Credit Programs in 2025 (August),
www.cbo.gov/publication/60517.
Congressional Budget Office (2025a), CBO's Economic Forecasting Record: 2025 Update (July),
www.cbo.gov/publication/61334.
Congressional Budget Office (2025b), “Dynamic Analysis of Changes to the Supplemental Nutrition Assistance
Program (SNAP) in H.R. 1” (June 23), www.cbo.gov/publication/61505.
Congressional Budget Office (2025c), dynamic estimate for H.R. 1, the One Big Beautiful Bill Act (June 17; revised
June 18), www.cbo.gov/publication/61486.
Congressional Budget Office (2025d), letter to the Honorable Amy Klobuchar and the Honorable Angie Craig about
potential effects on the Supplemental Nutrition Assistance Program (May 22), www.cbo.gov/publication/61426.
Department of Homeland Security (2023), Determination Pursuant to Section 102 of the Illegal Immigration Reform
and Immigrant Responsibility Act of 1996, as Amended, 88 Fed. Reg. 69214 (October 5),
https://tinyurl.com/7ydbvkdu.
Works Cited (Continued)
46.
45
DEV-CaMP (2025), “Databaseof EV Critical Material Projects” (accessed December 3),
https://criticalmaterialproject.netlify.app/.
Noelia Duchovny (2025), “A Call for New Research in the Area of Nutritional Standards in SNAP,” CBO Blog
(May 2), www.cbo.gov/publication/61290.
Government Accountability Office (2014), National Environmental Policy Act: Little Information Exists on NEPA
Analyses, GAO-14-369 (April), www.gao.gov/products/gao-14-369.
Colin Gray, and others (2023), “Employed in a SNAP? The Impact of Work Requirements on Program Participation
and Labor Supply,” American Economic Journal: Economic Policy, vol. 15, no. 1 (February), pp. 306–341,
https://doi.org/10.1257/pol.20200561.
Simon Greenhill and others (2024), “Machine Learning Predicts Which Rivers, Streams, and Wetlands the Clean
Water Act Regulates,” Science, vol. 383, no. 6681 (January 25), pp. 406–412,
https://doi.org/10.1126/science.adi3794.
Works Cited (Continued)
47.
46
Justine Hastings andJesse M. Shapiro (2018), “How Are SNAP Benefits Spent? Evidence From a Retail Panel,”
American Economic Review, vol. 108, no. 12 (December), pp. 3493–3540, https://doi.org/10.1257/aer.20170866.
Kristen Hite (2025), National Environmental Policy Act: Judicial Review and Remedies, Report IF11932,
version 6 (Congressional Research Service, June 26), www.congress.gov/crs-product/IF11932.
Thomas Hochman (2025), testimony before the Committee on Natural Resources of the U.S. House of
Representatives (September 10), https://tinyurl.com/46dzht5m.
Adam Hoffer and Jacob Macumber-Rosin (2025), Soda Taxes Won’t Fix Global Health (Tax Foundation,
March), https://tinyurl.com/scxad8ya.
Julie L. Hotchkiss, Robert E. Moore, and Fernando Rios-Avila (2024), “Impact of the 2017 Tax Cuts and Jobs Act on
Household Labor Supply and Welfare Across the Income Distribution,” National Tax Journal, vol. 77, no. 2 (June),
https://doi.org/10.1086/729747.
Adam B. Jaffe (1986), “Technological Opportunity and Spillovers of R & D: Evidence From Firms’ Patents, Profits, and
Market Value,” American Economic Review, vol. 76, no. 5 (December), pp. 984–1001, www.jstor.org/stable/1816464.
Works Cited (Continued)
48.
47
Mark Kelly andothers (2023), letter to Senator Jack Reed and others about Section 1090G of S. 2226 (October 26,),
https://tinyurl.com/y3xaw6y8.
Joseph Kile, Sam Papenfuss, and Heidi Williams (2025), “A Call for New Research in the Area of Permitting
Requirements for Investments in Physical Infrastructure,” CBO Blog (December 3), www.cbo.gov/publication/61897.
Eric Lewis (2019), “Patchwork Policies, Spillovers, and the Search for Oil and Gas,” American Economic Journal:
Economic Policy, vol. 11, no. 1 (February), pp. 380–405, https://doi.org/10.1257/pol.20160373.
Zachary Liscow (2025), “Getting Infrastructure Built: The Law and Economics of Permitting,” Journal of Economic
Perspectives, vol. 39, no. 1 (Winter), pp. 151–180, https://doi.org/10.1257/jep.20221347.
Linda Luther (2011), The National Environmental Policy Act (NEPA): Background and Implementation, Report RL33152
(Congressional Research Service, January 10), www.congress.gov/crs-product/RL33152.
Robert McClelland and Shannon Mok (2012), A Review of Recent Research on Labor Supply Elasticities, Working
Paper 2012-12 (Congressional Budget Office, October), www.cbo.gov/publication/43675.
Works Cited (Continued)
49.
48
James M. Poterba(1994), “State Responses to Fiscal Crises: The Effects of Budgetary Institutions and Politics,”
Journal of Political Economy, vol. 102, no. 4 (August), pp. 799–821, https://doi.org/10.1086/261955.
Kim S. Rueben, Megan Randall, and Aravind Boddupalli (2018), Budget Processes and the Great Recession: How
State Fiscal Institutions Shape Tax and Spending Decisions (Urban Institute, October), https://tinyurl.com/yurrkfza.
Staff of the Congressional Budget Office (2024), “How Economists Could Help Inform Economic and Budget Analysis
Used by the U.S. Congress,” Journal of Economic Perspectives, vol. 38, no. 2 (Spring), pp. 3–24,
https://doi.org/10.1257/jep.38.2.3.
Phill Swagel (2025), “CBO's Updated Projections of the Budgetary Effects of Tariffs as of November 15, 2025,”
CBO Blog (November 20), www.cbo.gov/publication/61877.
Works Cited (Continued)