72
มูลคาของกิจการไดเทากับ 8,660,446 บาท
มูลคาสวนของเจาของเทากับ6,160,446 บาท
จํานวนหุนทั้งสิ้น 500,000 บาท
มูลคาหุนตามทฤษฎี (Theoretical Stock of Return) เทากับ 12.32 บาท
Internal Rate of Return 51.5%
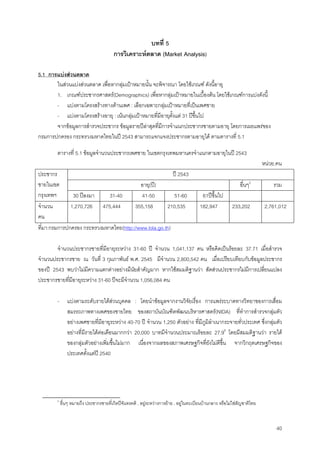
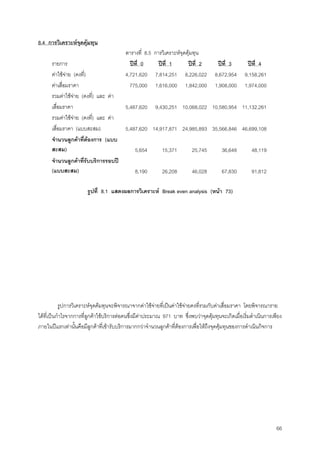
สรุปจากการประมาณงบการเงินเพื่อนํามาหามูลคากิจการจะสามารถสรุปไดวา มูลคาของกิจการมีคาเทากับ
8,660,446 บาท โดยมีระยะเวลาคืนทุนประมาณ 2 ปครึ่ง
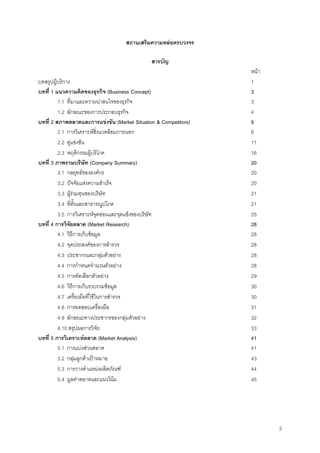
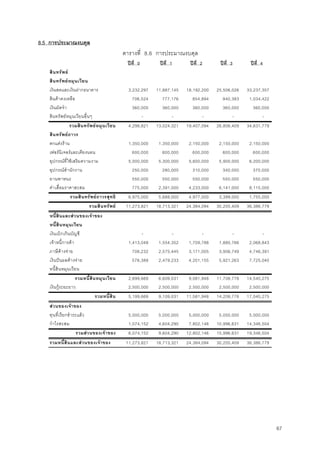
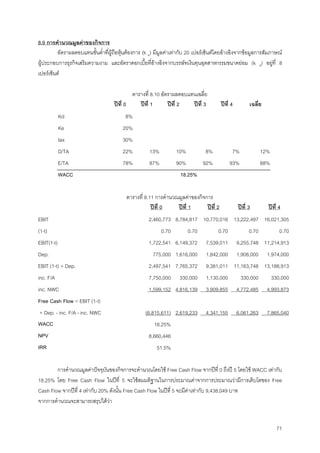
8.10 การวิเคราะห Sensitivity
การวิเคราะห Sensitivity จะพิจารณาการเปลี่ยนแปลงของยอดขายจาก Base Case ซึ่งเปนกรณีที่เปนการ
ประมาณยอดขายที่ใชในการวิเคราะหปกติ ± 10% โดยจะเปนกรณีของ Best Case และ Worst Case ดังแสดงผลใน
ตารางที่ 8.12
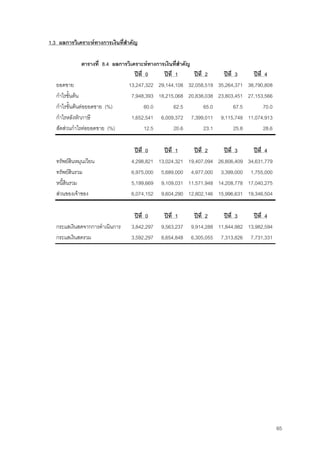
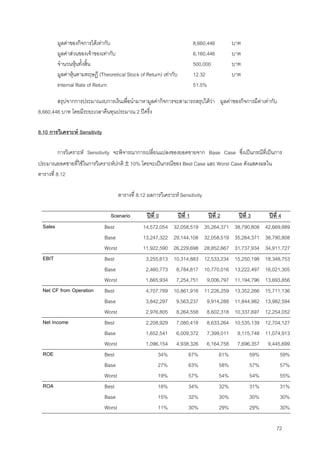
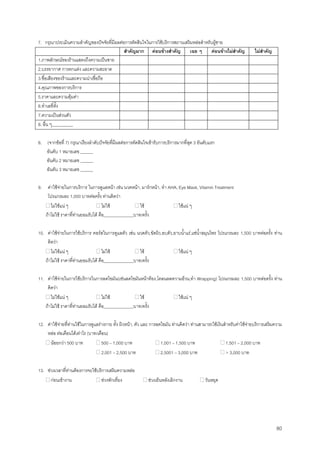
ตารางที่ 8.12 ผลการวิเคราะห Sensitivity
Scenario ปที่ 0 ปที่ 1 ปที่ 2 ปที่ 3 ปที่ 4
Sales Best 14,572,054 32,058,519 35,264,371 38,790,808 42,669,889
Base 13,247,322 29,144,108 32,058,519 35,264,371 38,790,808
Worst 11,922,590 26,229,698 28,852,667 31,737,934 34,911,727
EBIT Best 3,255,613 10,314,883 12,533,234 15,250,198 18,348,753
Base 2,460,773 8,784,817 10,770,016 13,222,497 16,021,305
Worst 1,665,934 7,254,751 9,006,797 11,194,796 13,693,856
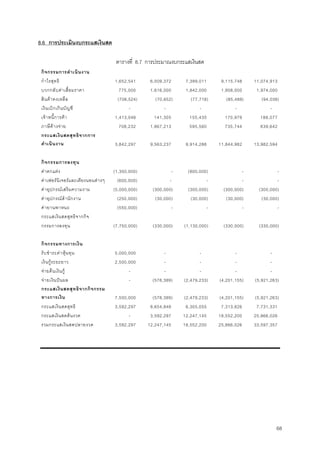
Net CF from Operation Best 4,707,789 10,861,916 11,226,259 13,352,266 15,711,136
Base 3,842,297 9,563,237 9,914,288 11,844,982 13,982,594
Worst 2,976,805 8,264,558 8,602,318 10,337,697 12,254,052
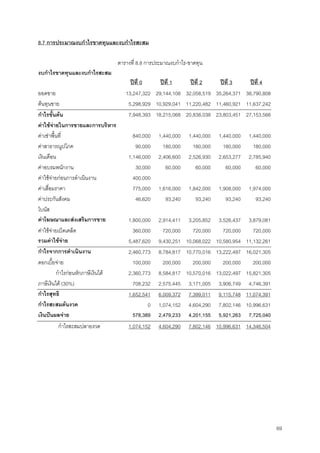
Net Income Best 2,208,929 7,080,418 8,633,264 10,535,139 12,704,127
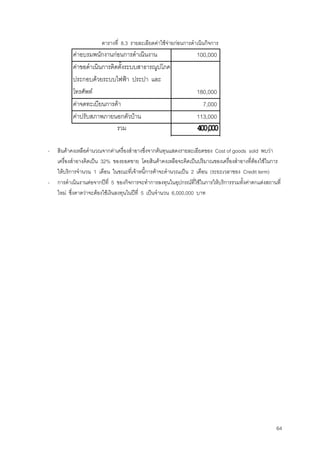
Base 1,652,541 6,009,372 7,399,011 9,115,748 11,074,913
Worst 1,096,154 4,938,326 6,164,758 7,696,357 9,445,699
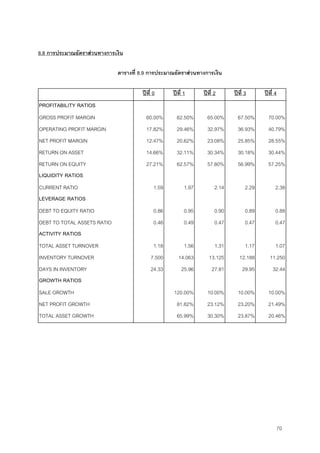
ROE Best 34% 67% 61% 59% 59%
Base 27% 63% 58% 57% 57%
Worst 19% 57% 54% 54% 55%
ROA Best 18% 34% 32% 31% 31%
Base 15% 32% 30% 30% 30%
Worst 11% 30% 29% 29% 30%
73.
73
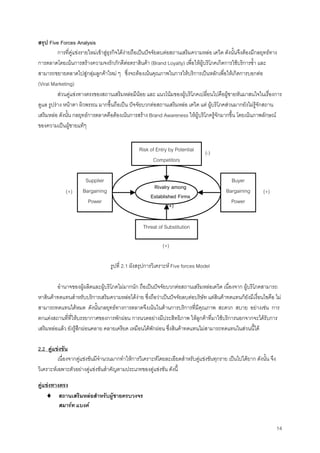
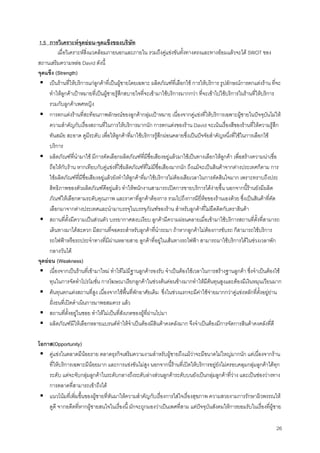
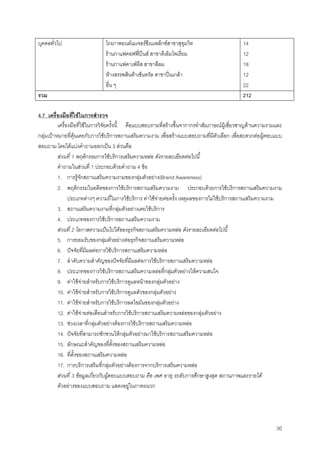
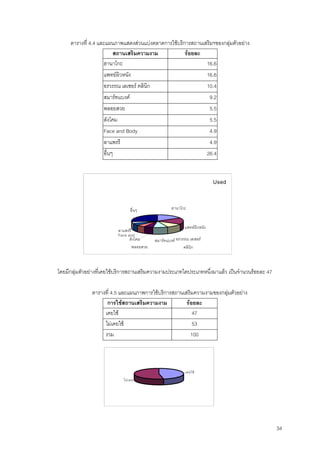
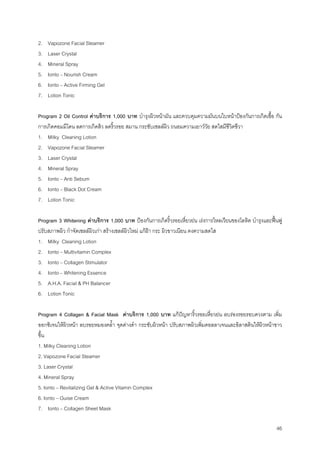
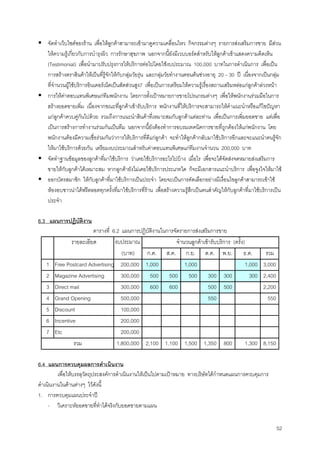
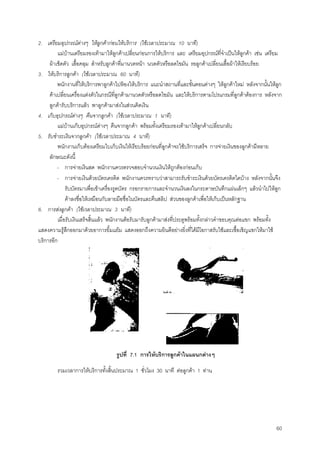
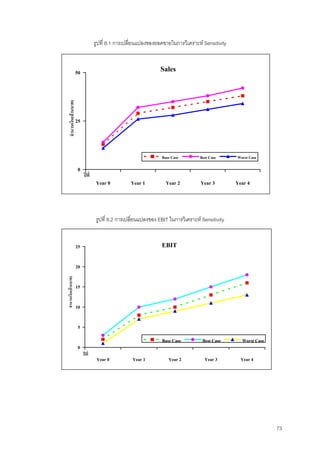
รูปที่ 8.1 การเปลี่ยนแปลงของยอดขายในการวิเคราะหSensitivity
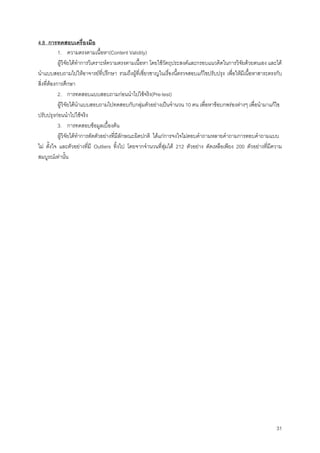
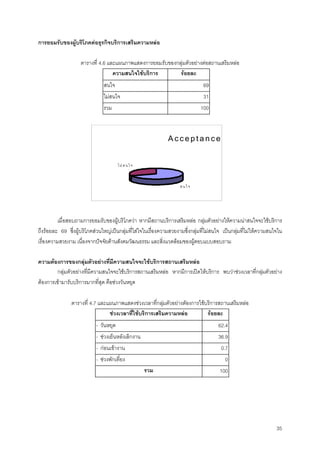
รูปที่ 8.2 การเปลี่ยนแปลงของ EBIT ในการวิเคราะห Sensitivity
Sales
0
25
50
Year 0 Year 1 Year 2 Year 3 Year 4
ปที่
จํานวนเงิน(ลานบาท)
Base Case Best Case Worst Case
EBIT
0
5
10
15
20
25
Year 0 Year 1 Year 2 Year 3 Year 4
ปที่
จํานวนเงิน(ลานบาท)
Base Case Best Case Worst Case
74.
74
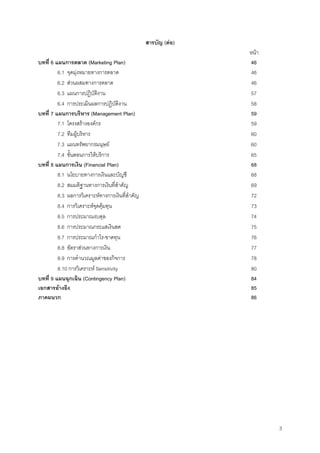
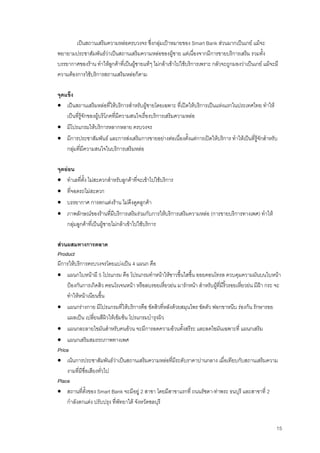
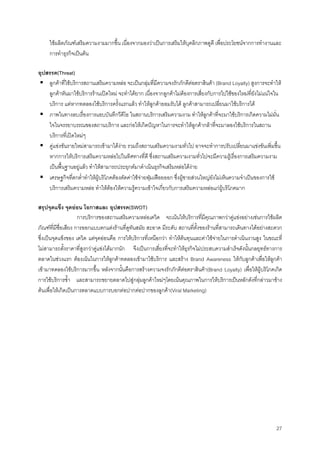
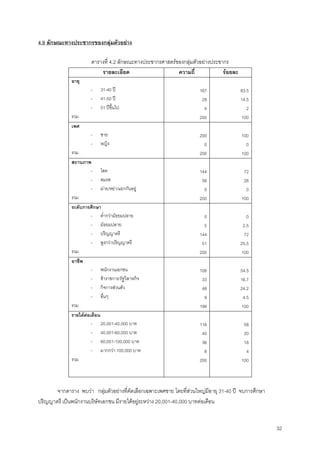
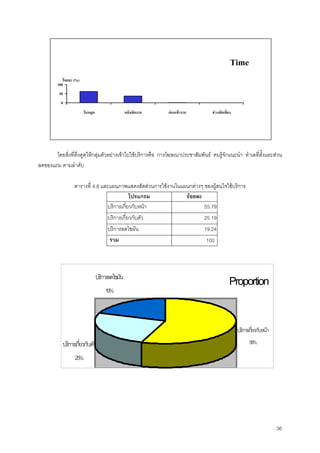
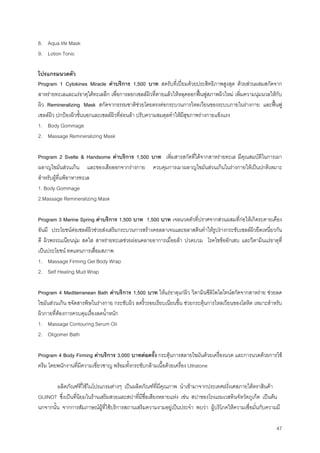
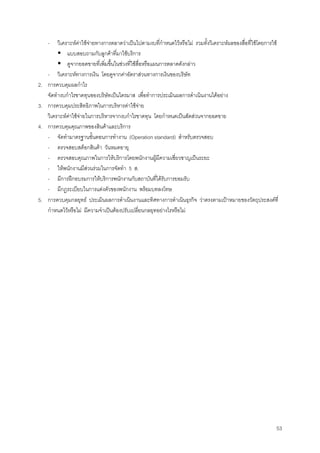
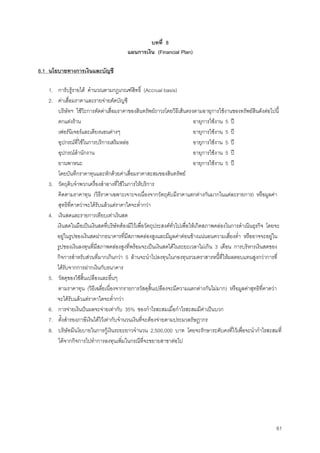
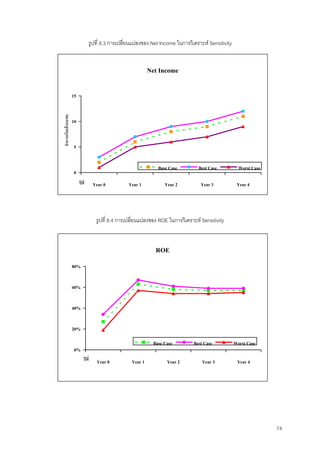
รูปที่ 8.3 การเปลี่ยนแปลงของNet Income ในการวิเคราะห Sensitivity
รูปที่ 8.4 การเปลี่ยนแปลงของ ROE ในการวิเคราะห Sensitivity
Net Income
0
5
10
15
Year 0 Year 1 Year 2 Year 3 Year 4ปที่
จํานวนเงิน(ลานบาท)
Base Case Best Case Worst Case
ROE
0%
20%
40%
60%
80%
Year 0 Year 1 Year 2 Year 3 Year 4ปที่
Base Case Best Case Worst Case
75.
75
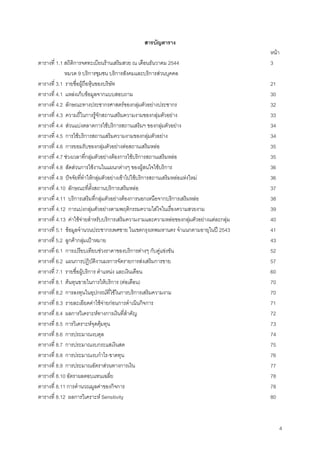
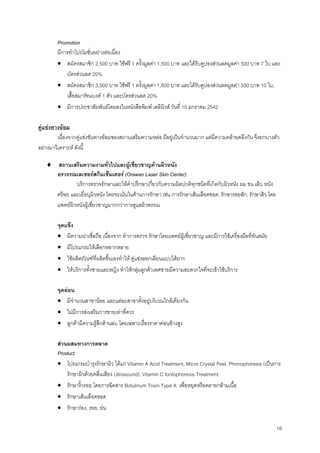
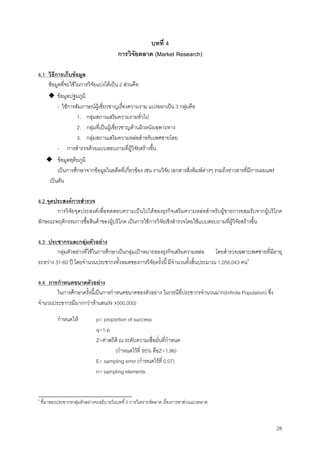
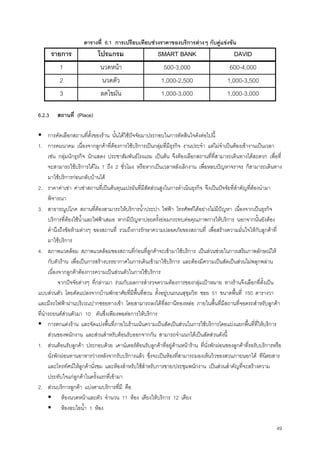
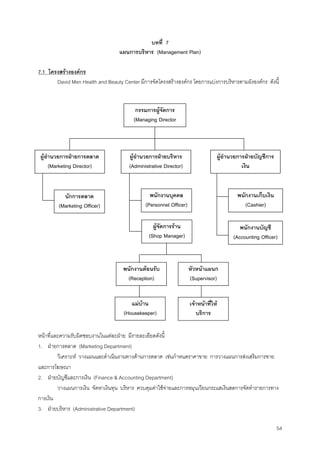
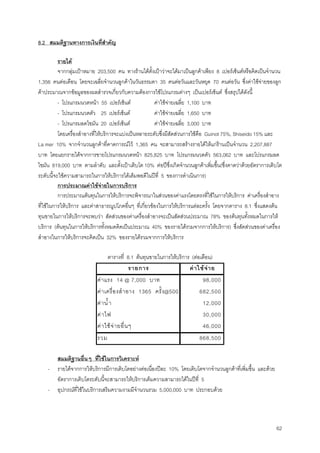
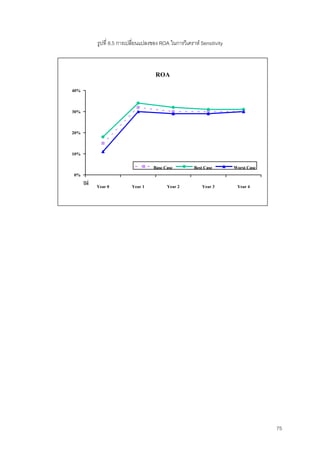
รูปที่ 8.5 การเปลี่ยนแปลงของROA ในการวิเคราห Sensitivity
ROA
0%
10%
20%
30%
40%
Year 0 Year 1 Year 2 Year 3 Year 4ปที่
Base Case Best Case Worst Case
77
เอกสารอางอิง
1. วิทยาลัยประชากรศาสตร จุฬาลงกรณมหาวิทยาลัยhttp://www.chula.ac.th/college/cps/
2. กรมการปกครอง กระทรวงมหาดไทย http://www.dola.go.th
3. National Institute of Development Administration (NIDA) , An Epidemiological Study of Erectly Dysfunction
in Thailand (การศึกษาระบาดวิทยาของโรคหยอนสมรรถภาพทางเพศของชายไทย) May 1999 by Department of
Population and Development School of Applied Statistics
4. Philip Kilter, Marketing Management, The millenium Edition 2000
5. รายผลการสํารวจผูใชอินเตอรเน็ตในประเทศไทย, สํานักงานเลขานุการคณะกรรมการเทคโนโลยีสารสนเทศแหงชาติ,
2543
6. ศูนยวิจัยกสิกรไทย http://www.tfrc.co.th
7. เสนทางเศรษฐี ฉบับที่ 76 วันที่ 1 มิถุนายน 2544
82
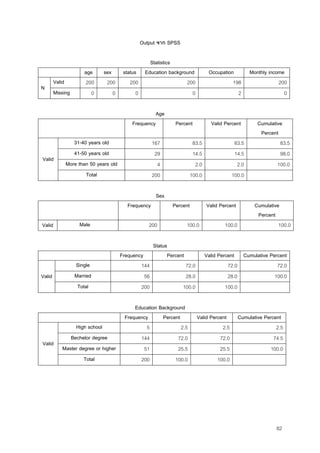
Output จาก SPSS
Statistics
agesex status Education background Occupation Monthly income
Valid 200 200 200 200 198 200
N
Missing 0 0 0 0 2 0
Age
Frequency Percent Valid Percent Cumulative
Percent
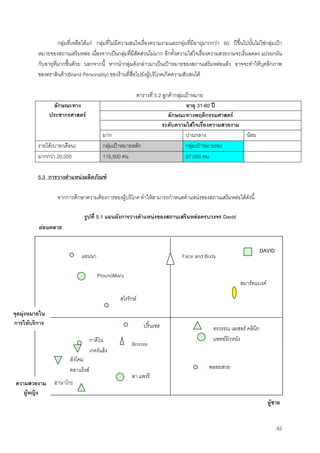
31-40 years old 167 83.5 83.5 83.5
41-50 years old 29 14.5 14.5 98.0
More than 50 years old 4 2.0 2.0 100.0
Valid
Total 200 100.0 100.0
Sex
Frequency Percent Valid Percent Cumulative
Percent
Valid Male 200 100.0 100.0 100.0
Status
Frequency Percent Valid Percent Cumulative Percent
Single 144 72.0 72.0 72.0
Married 56 28.0 28.0 100.0Valid
Total 200 100.0 100.0
Education Background
Frequency Percent Valid Percent Cumulative Percent
High school 5 2.5 2.5 2.5
Bechelor degree 144 72.0 72.0 74.5
Master degree or higher 51 25.5 25.5 100.0
Valid
Total 200 100.0 100.0
83.
83
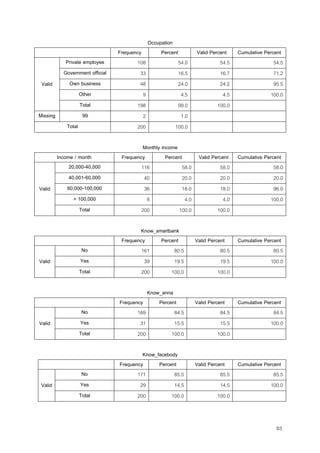
Occupation
Frequency Percent ValidPercent Cumulative Percent
Private employee 108 54.0 54.5 54.5
Government official 33 16.5 16.7 71.2
Own business 48 24.0 24.2 95.5
Other 9 4.5 4.5 100.0
Valid
Total 198 99.0 100.0
Missing 99 2 1.0
Total 200 100.0
Monthly income
Income / month Frequency Percent Valid Percent Cumulative Percent
20,000-40,000 116 58.0 58.0 58.0
40,001-60,000 40 20.0 20.0 20.0
60,000-100,000 36 18.0 18.0 96.0
> 100,000 8 4.0 4.0 100.0
Valid
Total 200 100.0 100.0
Know_smartbank
Frequency Percent Valid Percent Cumulative Percent
No 161 80.5 80.5 80.5
Yes 39 19.5 19.5 100.0Valid
Total 200 100.0 100.0
Know_anna
Frequency Percent Valid Percent Cumulative Percent
No 169 84.5 84.5 84.5
Yes 31 15.5 15.5 100.0Valid
Total 200 100.0 100.0
Know_facebody
Frequency Percent Valid Percent Cumulative Percent
No 171 85.5 85.5 85.5
Yes 29 14.5 14.5 100.0Valid
Total 200 100.0 100.0
84.
84
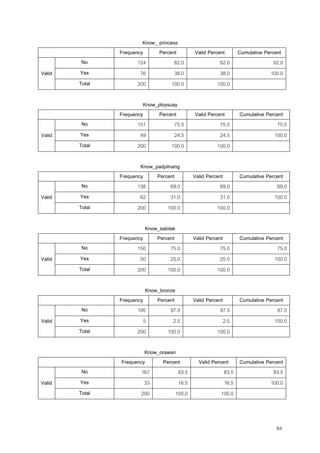
Know_ princess
Frequency PercentValid Percent Cumulative Percent
No 124 62.0 62.0 62.0
Yes 76 38.0 38.0 100.0Valid
Total 200 100.0 100.0
Know_ploysuay
Frequency Percent Valid Percent Cumulative Percent
No 151 75.5 75.5 75.5
Yes 49 24.5 24.5 100.0Valid
Total 200 100.0 100.0
Know_padpilnang
Frequency Percent Valid Percent Cumulative Percent
No 138 69.0 69.0 69.0
Yes 62 31.0 31.0 100.0Valid
Total 200 100.0 100.0
Know_salolak
Frequency Percent Valid Percent Cumulative Percent
No 150 75.0 75.0 75.0
Yes 50 25.0 25.0 100.0Valid
Total 200 100.0 100.0
Know_bronze
Frequency Percent Valid Percent Cumulative Percent
No 195 97.5 97.5 97.5
Yes 5 2.5 2.5 100.0Valid
Total 200 100.0 100.0
Know_orawan
Frequency Percent Valid Percent Cumulative Percent
No 167 83.5 83.5 83.5
Yes 33 16.5 16.5 100.0Valid
Total 200 100.0 100.0
85.
85
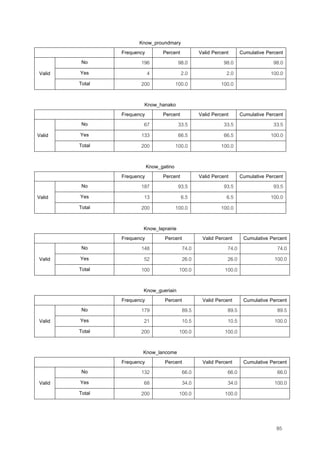
Know_proundmary
Frequency Percent ValidPercent Cumulative Percent
No 196 98.0 98.0 98.0
Yes 4 2.0 2.0 100.0Valid
Total 200 100.0 100.0
Know_hanako
Frequency Percent Valid Percent Cumulative Percent
No 67 33.5 33.5 33.5
Yes 133 66.5 66.5 100.0Valid
Total 200 100.0 100.0
Know_gatino
Frequency Percent Valid Percent Cumulative Percent
No 187 93.5 93.5 93.5
Yes 13 6.5 6.5 100.0Valid
Total 200 100.0 100.0
Know_laprairie
Frequency Percent Valid Percent Cumulative Percent
No 148 74.0 74.0 74.0
Yes 52 26.0 26.0 100.0Valid
Total 100 100.0 100.0
Know_gueriain
Frequency Percent Valid Percent Cumulative Percent
No 179 89.5 89.5 89.5
Yes 21 10.5 10.5 100.0Valid
Total 200 100.0 100.0
Know_lancome
Frequency Percent Valid Percent Cumulative Percent
No 132 66.0 66.0 66.0
Yes 68 34.0 34.0 100.0Valid
Total 200 100.0 100.0
86.
86
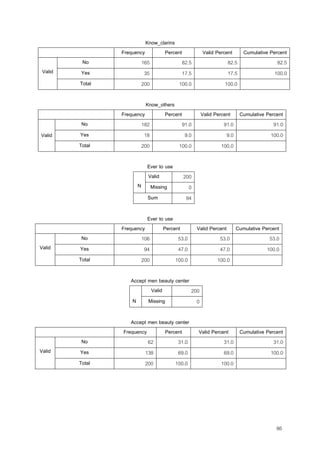
Know_clarins
Frequency Percent ValidPercent Cumulative Percent
No 165 82.5 82.5 82.5
Yes 35 17.5 17.5 100.0Valid
Total 200 100.0 100.0
Know_others
Frequency Percent Valid Percent Cumulative Percent
No 182 91.0 91.0 91.0
Yes 18 9.0 9.0 100.0Valid
Total 200 100.0 100.0
Ever to use
Valid 200
N Missing 0
Sum 94
Ever to use
Frequency Percent Valid Percent Cumulative Percent
No 106 53.0 53.0 53.0
Yes 94 47.0 47.0 100.0Valid
Total 200 100.0 100.0
Accept men beauty center
Valid 200
N Missing 0
Accept men beauty center
Frequency Percent Valid Percent Cumulative Percent
No 62 31.0 31.0 31.0
Yes 138 69.0 69.0 100.0Valid
Total 200 100.0 100.0
87.
87
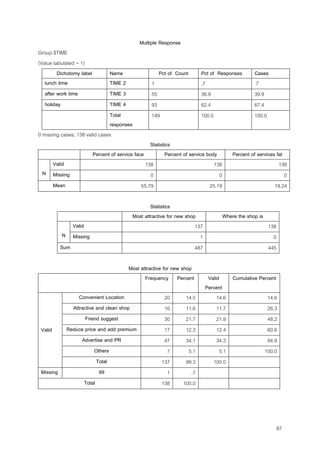
Multiple Response
Group $TIME
(Valuetabulated = 1)
Dichotomy label Name Pct of Count Pct of Responses Cases
lunch time TIME 2 1 .7 .7
after work time TIME 3 55 36.9 39.9
holiday TIME 4 93 62.4 67.4
Total
responses
149 100.0 100.0
0 missing cases; 138 valid cases
Statistics
Percent of service face Percent of service body Percent of services fat
Valid 138 138 138
N Missing 0 0 0
Mean 55.79 25.19 19.24
Statistics
Most attractive for new shop Where the shop is
Valid 137 138
N Missing 1 0
Sum 487 445
Most attractive for new shop
Frequency Percent Valid
Percent
Cumulative Percent
Convenient Location 20 14.5 14.6 14.6
Attractive and clean shop 16 11.6 11.7 26.3
Friend suggest 30 21.7 21.9 48.2
Reduce price and add premium 17 12.3 12.4 60.6
Advertise and PR 47 34.1 34.3 94.9
Others 7 5.1 5.1 100.0
Valid
Total 137 99.3 100.0
Missing 99 1 .7
Total 138 100.0
88.
88
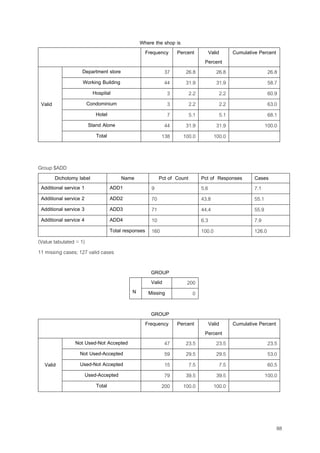
Where the shopis
Frequency Percent Valid
Percent
Cumulative Percent
Department store 37 26.8 26.8 26.8
Working Building 44 31.9 31.9 58.7
Hospital 3 2.2 2.2 60.9
Condominium 3 2.2 2.2 63.0
Hotel 7 5.1 5.1 68.1
Stand Alone 44 31.9 31.9 100.0
Valid
Total 138 100.0 100.0
Group $ADD
Dichotomy label Name Pct of Count Pct of Responses Cases
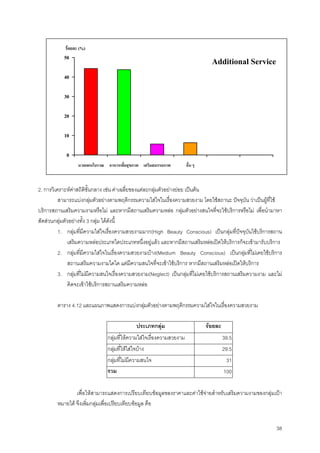
Additional service 1 ADD1 9 5.6 7.1
Additional service 2 ADD2 70 43.8 55.1
Additional service 3 ADD3 71 44.4 55.9
Additional service 4 ADD4 10 6.3 7.9
Total responses 160 100.0 126.0
(Value tabulated = 1)
11 missing cases; 127 valid cases
GROUP
Valid 200
N Missing 0
GROUP
Frequency Percent Valid
Percent
Cumulative Percent
Not Used-Not Accepted 47 23.5 23.5 23.5
Not Used-Accepted 59 29.5 29.5 53.0
Used-Not Accepted 15 7.5 7.5 60.5
Used-Accepted 79 39.5 39.5 100.0
Valid
Total 200 100.0 100.0
89.
89
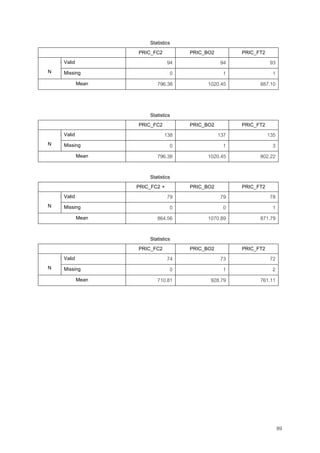
Statistics
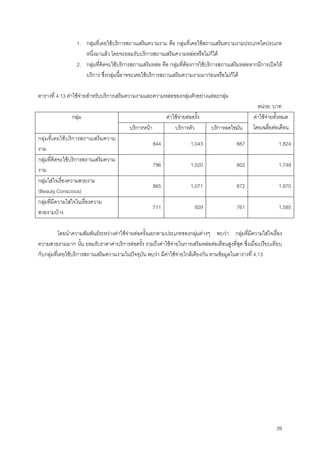
PRIC_FC2 PRIC_BO2 PRIC_FT2
Valid94 94 93N
N Missing 0 1 1
Mean 796.38 1020.45 887.10
Statistics
PRIC_FC2 PRIC_BO2 PRIC_FT2
Valid 138 137 135N
N Missing 0 1 3
Mean 796.38 1020.45 802.22
Statistics
PRIC_FC2 + PRIC_BO2 PRIC_FT2
Valid 79 79 78N
N Missing 0 0 1
Mean 864.56 1070.89 871.79
Statistics
PRIC_FC2 PRIC_BO2 PRIC_FT2
Valid 74 73 72N
N Missing 0 1 2
Mean 710.81 928.79 761.11


![คู่มือการเขียนแผนธุรกิจ [ภาคบริการ]](https://cdn.slidesharecdn.com/ss_thumbnails/book1-141126054705-conversion-gate01-thumbnail.jpg?width=640&height=640&fit=bounds)


