Download to read offline
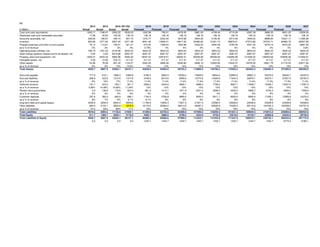

This document contains financial projections for Tesla from 2014 to 2027. It includes forecasts for key line items such as cash, revenues, assets, liabilities, and equity. Some highlights include: - Cash is projected to decrease from over $3 billion in 2022 to negative levels after 2025 before increasing again. - Total assets are expected to grow significantly over time, reaching over $300 billion by 2027 as production and revenues increase. - Revenue growth is anticipated to drive increases across other income statement and balance sheet categories such as inventory, property/equipment, and debt.


