Download as PDF, PPTX
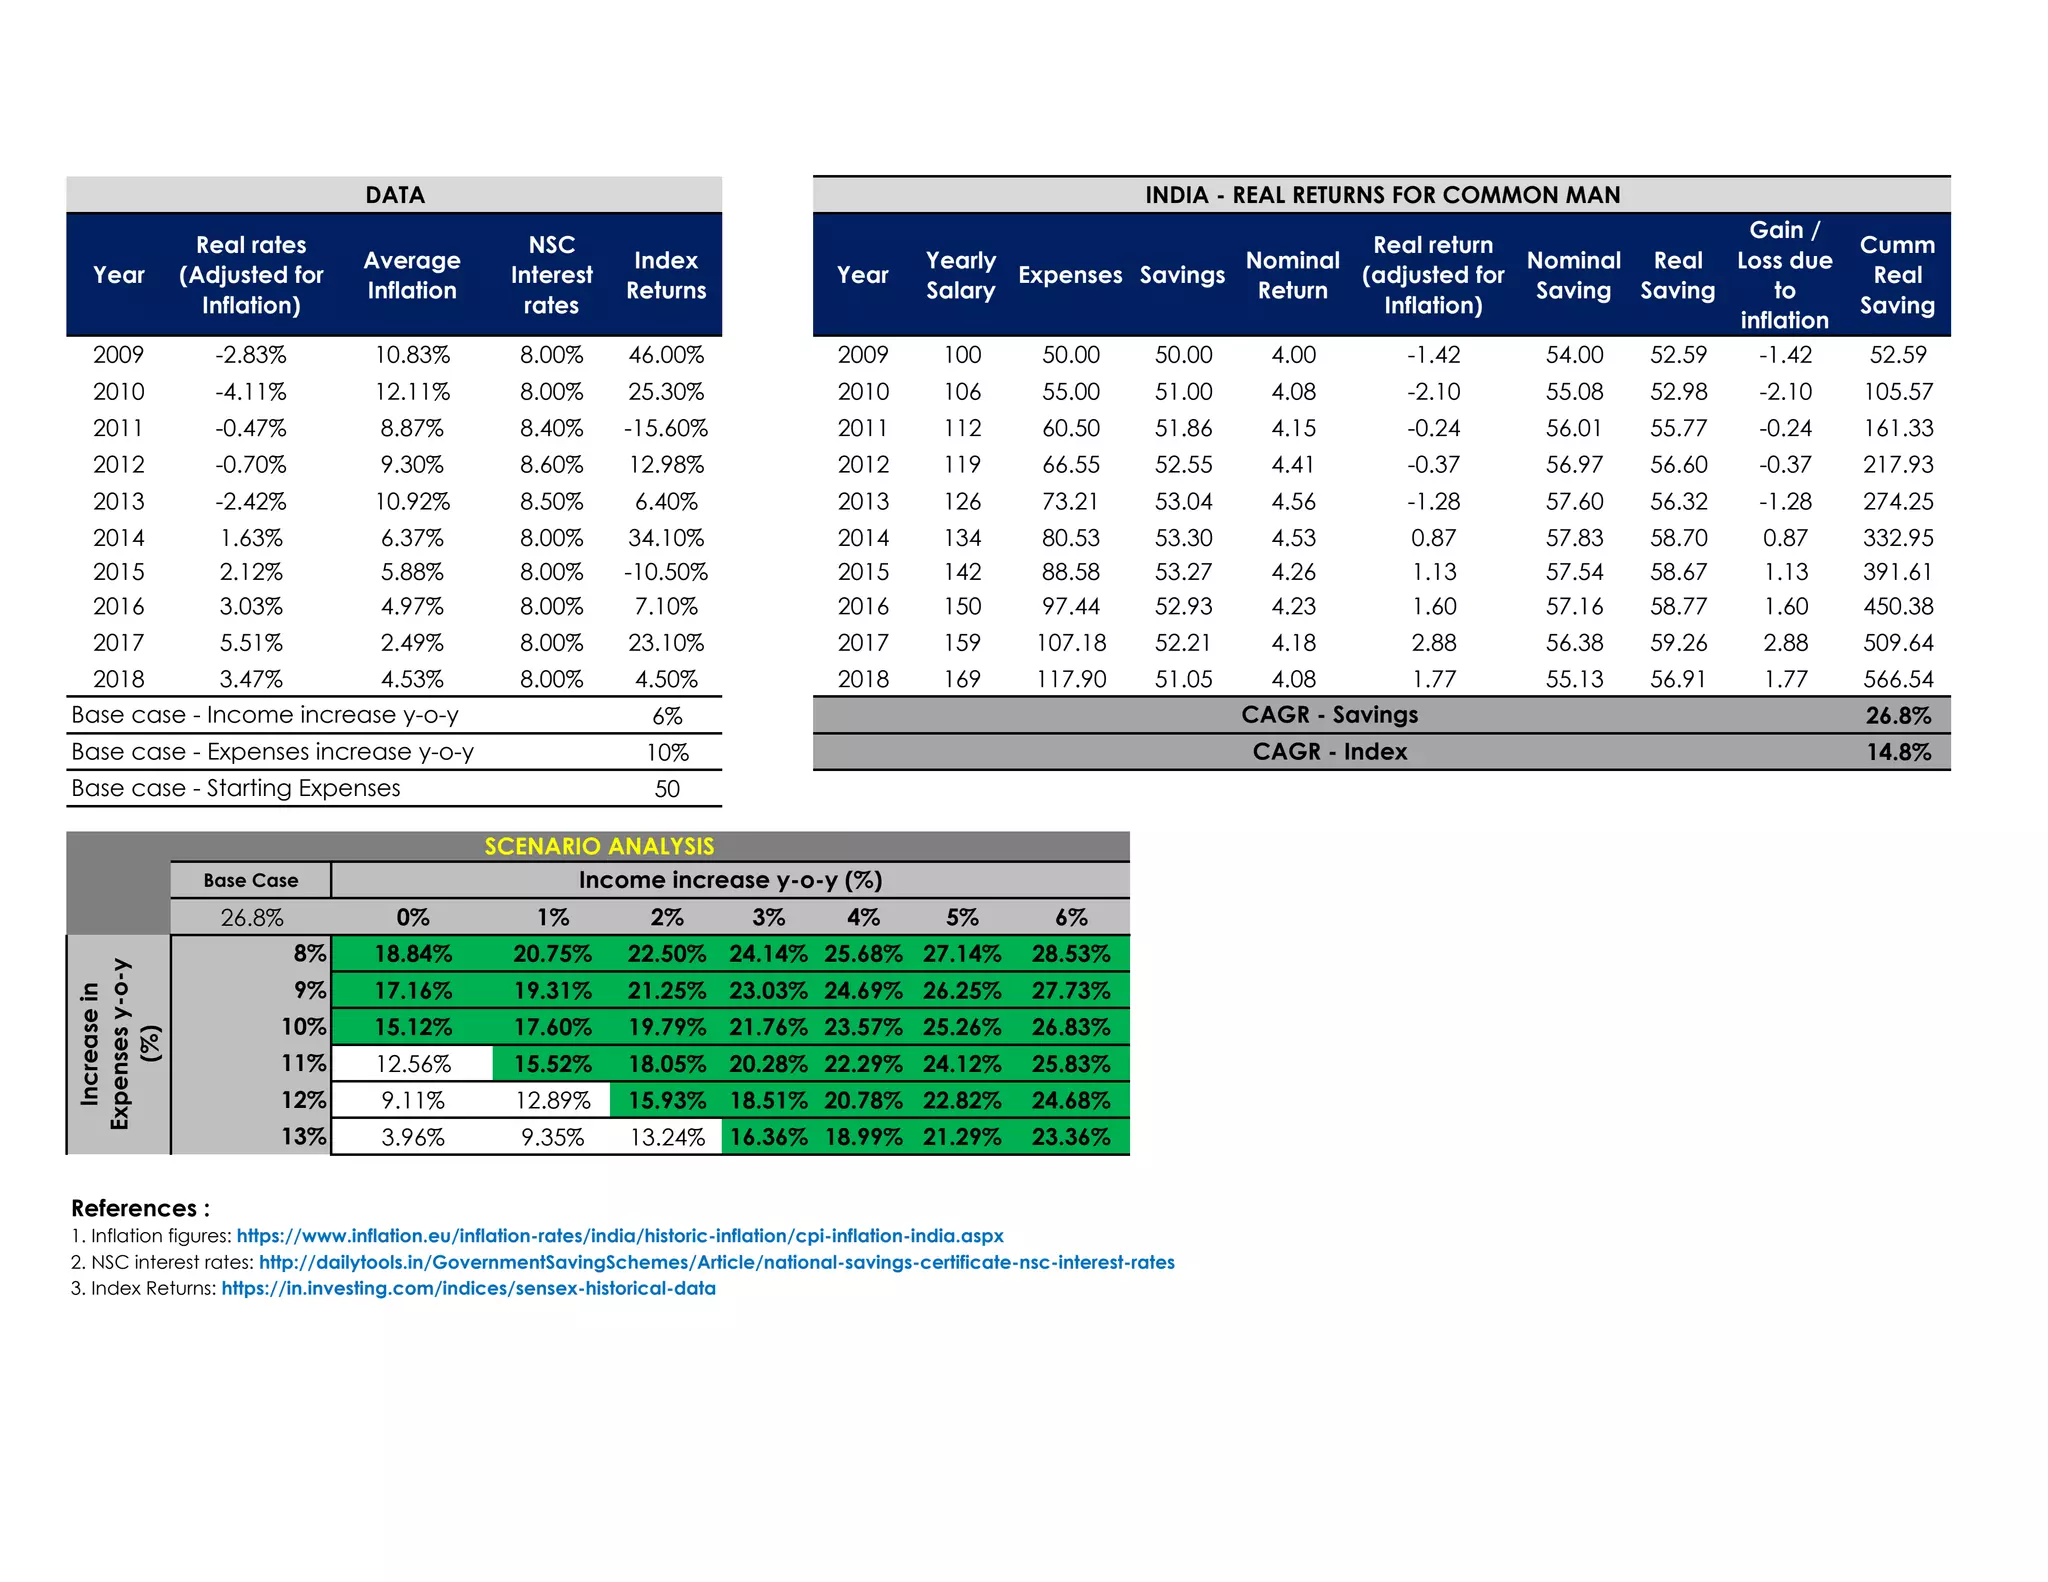

The document presents a detailed financial analysis covering real rates adjusted for inflation, average inflation, NSC interest rates, index returns, and yearly salary alongside expenses and savings from 2009 to 2018. It includes a projection of nominal and real returns, as well as gains or losses due to inflation, providing insights into the impact of inflation on savings over the years. References for inflation figures, NSC interest rates, and index returns are also included for further verification.


