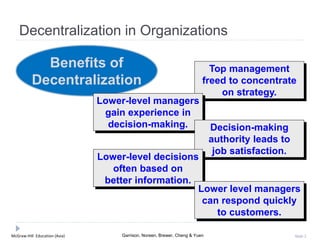
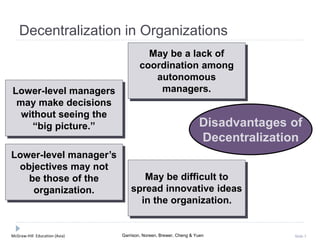
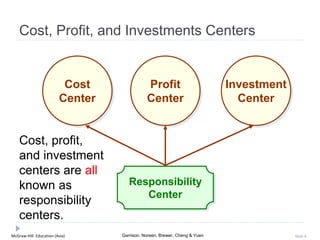
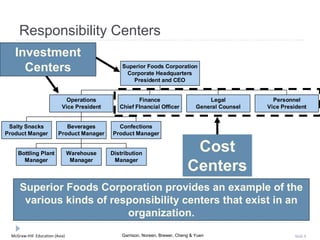
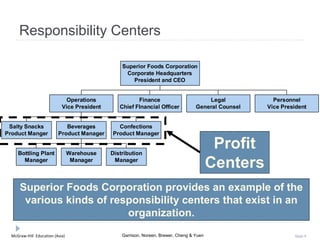
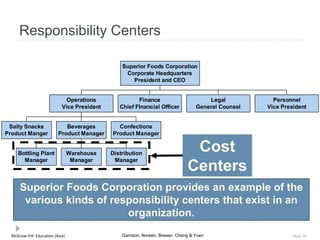
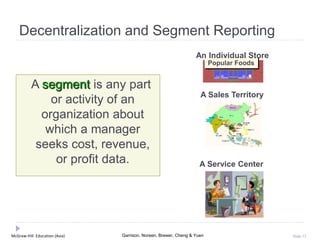
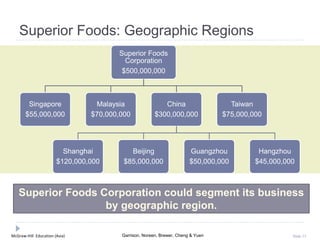
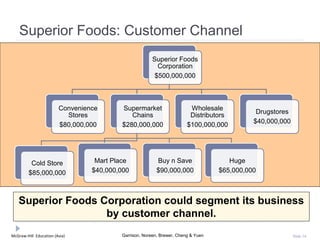
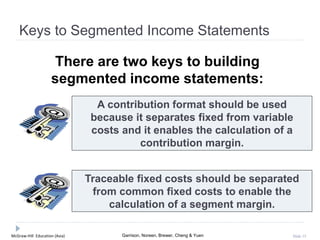
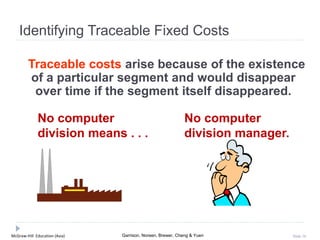
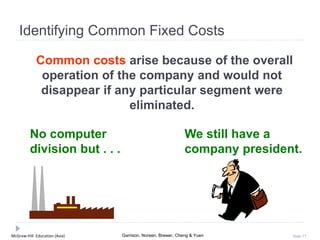
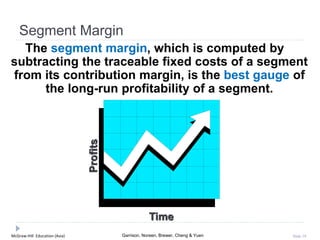
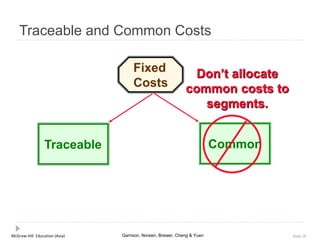
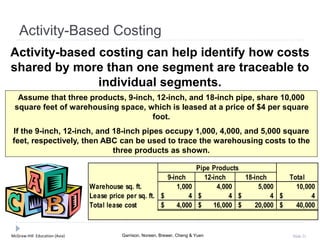
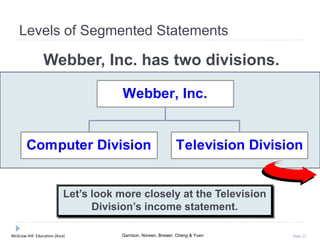
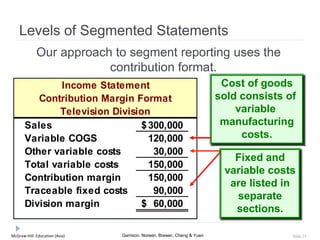
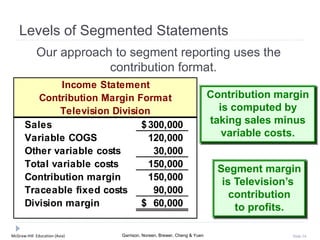
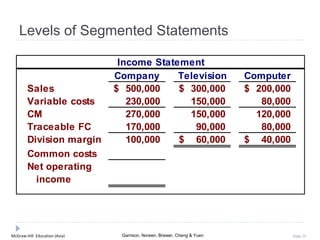
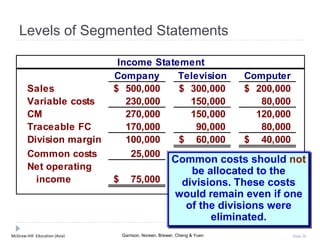
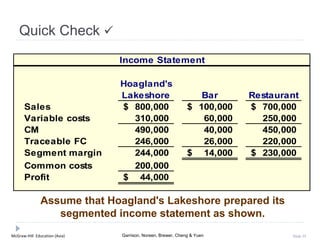
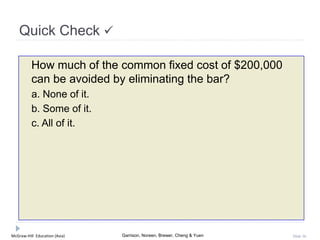
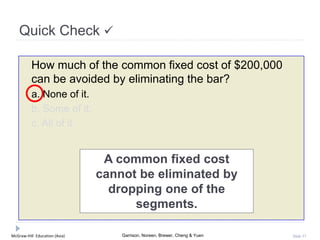
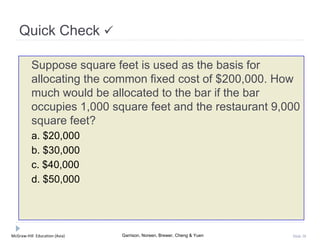
© 2012 McGraw-Hill Education (Asia)
Segment Reporting, Decentralization,
and the Balanced Scorecard
Chapter 13
McGraw-Hill Education (Asia) Garrison, Noreen, Brewer, Cheng & Yuen Slide 2
Decentralization in Organizations
Benefits of
Decentralization
Top management
freed to concentrate
on strategy.
Lower-level managers
gain experience in
decision-making. Decision-making
authority leads to
job satisfaction.
Lower-level decisions
often based on
better information.
Lower level managers
can respond quickly
to customers.
McGraw-Hill Education (Asia) Garrison, Noreen, Brewer, Cheng & Yuen Slide 3
Decentralization in Organizations
Disadvantages of
Decentralization
Lower-level managers
may make decisions
without seeing the
“big picture.”
May be a lack of
coordination among
autonomous
managers.
Lower-level manager’s
objectives may not
be those of the
organization.
May be difficult to
spread innovative ideas
in the organization.
McGraw-Hill Education (Asia) Garrison, Noreen, Brewer, Cheng & Yuen Slide 4
Cost, Profit, and Investments Centers
Responsibility
Center
Cost
Center
Profit
Center
Investment
Center
Cost, profit,
and investment
centers are all
known as
responsibility
centers.
McGraw-Hill Education (Asia) Garrison, Noreen, Brewer, Cheng & Yuen Slide 5
Cost Center
A segment whose manager has control over costs,
but not over revenues or investment funds.
McGraw-Hill Education (Asia) Garrison, Noreen, Brewer, Cheng & Yuen Slide 6
Profit Center
A segment whose
manager has control
over both costs and
revenues,
but no control over
investment funds.
Revenues
Sales
Interest
Other
Costs
Mfg. costs
Commissions
Salaries
Other
McGraw-Hill Education (Asia) Garrison, Noreen, Brewer, Cheng & Yuen Slide 7
Investment Center
A segment whose
manager has control
over costs, revenues,
and investments in
operating assets.
Corporate Headquarters
McGraw-Hill Education (Asia) Garrison, Noreen, Brewer, Cheng & Yuen Slide 8
Responsibility Centers
Salty Snacks
Product Manger
Bottling Plant
Manager
Warehouse
Manager
Distribution
Manager
Beverages
Product Manager
Confections
Product Manager
Operations
Vice President
Finance
Chief FInancial Officer
Legal
General Counsel
Personnel
Vice President
Superior Foods Corporation
Corporate Headquarters
President and CEO
Cost
Centers
Investment
Centers
Superior Foods Corporation provides an example of the
various kinds of responsibility centers that exist in an
organization.
McGraw-Hill Education (Asia) Garrison, Noreen, Brewer, Cheng & Yuen Slide 9
Responsibility Centers
Salty Snacks
Product Manger
Bottling Plant
Manager
Warehouse
Manager
Distribution
Manager
Beverages
Product Manager
Confections
Product Manager
Operations
Vice President
Finance
Chief FInancial Officer
Legal
General Counsel
Personnel
Vice President
Superior Foods Corporation
Corporate Headquarters
President and CEO
Superior Foods Corporation provides an example of the
various kinds of responsibility centers that exist in an
organization.
Profit
Centers
McGraw-Hill Education (Asia) Garrison, Noreen, Brewer, Cheng & Yuen Slide 10
Responsibility Centers
Salty Snacks
Product Manger
Bottling Plant
Manager
Warehouse
Manager
Distribution
Manager
Beverages
Product Manager
Confections
Product Manager
Operations
Vice President
Finance
Chief FInancial Officer
Legal
General Counsel
Personnel
Vice President
Superior Foods Corporation
Corporate Headquarters
President and CEO
Cost
Centers
Superior Foods Corporation provides an example of the
various kinds of responsibility centers that exist in an
organization.
McGraw-Hill Education (Asia) Garrison, Noreen, Brewer, Cheng & Yuen Slide 11
Learning Objective 1
Prepare a segmented income
statement using the
contribution format, and
explain the difference between
traceable fixed costs and
common fixed costs.
McGraw-Hill Education (Asia) Garrison, Noreen, Brewer, Cheng & Yuen Slide 12
Decentralization and Segment Reporting
A segment is any part
or activity of an
organization about
which a manager
seeks cost, revenue,
or profit data.
Popular Foods
An Individual Store
A Sales Territory
A Service Center
McGraw-Hill Education (Asia) Garrison, Noreen, Brewer, Cheng & Yuen Slide 13
Superior Foods: Geographic Regions
Superior Foods Corporation could segment its business
by geographic region.
Superior Foods
Corporation
$500,000,000
Singapore
$55,000,000
Malaysia
$70,000,000
China
$300,000,000
Shanghai
$120,000,000
Beijing
$85,000,000
Guangzhou
$50,000,000
Hangzhou
$45,000,000
Taiwan
$75,000,000
McGraw-Hill Education (Asia) Garrison, Noreen, Brewer, Cheng & Yuen Slide 14
Superior Foods: Customer Channel
Superior Foods Corporation could segment its business
by customer channel.
Superior Foods
Corporation
$500,000,000
Convenience
Stores
$80,000,000
Supermarket
Chains
$280,000,000
Cold Store
$85,000,000
Mart Place
$40,000,000
Buy n Save
$90,000,000
Huge
$65,000,000
Wholesale
Distributors
$100,000,000
Drugstores
$40,000,000
McGraw-Hill Education (Asia) Garrison, Noreen, Brewer, Cheng & Yuen Slide 15
Keys to Segmented Income Statements
There are two keys to building
segmented income statements:
A contribution format should be used
because it separates fixed from variable
costs and it enables the calculation of a
contribution margin.
Traceable fixed costs should be separated
from common fixed costs to enable the
calculation of a segment margin.
McGraw-Hill Education (Asia) Garrison, Noreen, Brewer, Cheng & Yuen Slide 16
Identifying Traceable Fixed Costs
Traceable costs arise because of the existence
of a particular segment and would disappear
over time if the segment itself disappeared.
No computer
division means . . .
No computer
division manager.
McGraw-Hill Education (Asia) Garrison, Noreen, Brewer, Cheng & Yuen Slide 17
Identifying Common Fixed Costs
Common costs arise because of the overall
operation of the company and would not
disappear if any particular segment were
eliminated.
No computer
division but . . .
We still have a
company president.
McGraw-Hill Education (Asia) Garrison, Noreen, Brewer, Cheng & Yuen Slide 18
Traceable Costs Can Become
Common Costs
It is important to realize that the traceable
fixed costs of one segment may be a
common fixed cost of another segment.
For example, the landing fee
paid to land an airplane at an
airport is traceable to the
particular flight, but it is not
traceable to first-class,
business-class, and
economy-class passengers.
McGraw-Hill Education (Asia) Garrison, Noreen, Brewer, Cheng & Yuen Slide 19
Segment Margin
The segment margin, which is computed by
subtracting the traceable fixed costs of a segment
from its contribution margin, is the best gauge of
the long-run profitability of a segment.
Time
Profits
McGraw-Hill Education (Asia) Garrison, Noreen, Brewer, Cheng & Yuen Slide 20
Traceable and Common Costs
Fixed
Costs
Traceable Common
Don’t allocate
common costs to
segments.
McGraw-Hill Education (Asia) Garrison, Noreen, Brewer, Cheng & Yuen Slide 21
Activity-Based Costing
9-inch 12-inch 18-inch Total
Warehouse sq. ft. 1,000 4,000 5,000 10,000
Lease price per sq. ft. 4$ 4$ 4$ 4$
Total lease cost 4,000$ 16,000$ 20,000$ 40,000$
Pipe Products
Activity-based costing can help identify how costs
shared by more than one segment are traceable to
individual segments.
Assume that three products, 9-inch, 12-inch, and 18-inch pipe, share 10,000
square feet of warehousing space, which is leased at a price of $4 per square
foot.
If the 9-inch, 12-inch, and 18-inch pipes occupy 1,000, 4,000, and 5,000 square
feet, respectively, then ABC can be used to trace the warehousing costs to the
three products as shown.
McGraw-Hill Education (Asia) Garrison, Noreen, Brewer, Cheng & Yuen Slide 22
Levels of Segmented Statements
Let’s look more closely at the Television
Division’s income statement.
Webber, Inc. has two divisions.
Computer Division Television Division
Webber, Inc.
McGraw-Hill Education (Asia) Garrison, Noreen, Brewer, Cheng & Yuen Slide 23
Levels of Segmented Statements
Our approach to segment reporting uses the
contribution format.
Income Statement
Contribution Margin Format
Television Division
Sales 300,000$
Variable COGS 120,000
Other variable costs 30,000
Total variable costs 150,000
Contribution margin 150,000
Traceable fixed costs 90,000
Division margin 60,000$
Cost of goods
sold consists of
variable
manufacturing
costs.
Fixed and
variable costs
are listed in
separate
sections.
McGraw-Hill Education (Asia) Garrison, Noreen, Brewer, Cheng & Yuen Slide 24
Levels of Segmented Statements
Segment margin
is Television’s
contribution
to profits.
Income Statement
Contribution Margin Format
Television Division
Sales 300,000$
Variable COGS 120,000
Other variable costs 30,000
Total variable costs 150,000
Contribution margin 150,000
Traceable fixed costs 90,000
Division margin 60,000$
Contribution margin
is computed by
taking sales minus
variable costs.
Our approach to segment reporting uses the
contribution format.
McGraw-Hill Education (Asia) Garrison, Noreen, Brewer, Cheng & Yuen Slide 25
Levels of Segmented Statements
Income Statement
Company Television Computer
Sales 500,000$ 300,000$ 200,000$
Variable costs 230,000 150,000 80,000
CM 270,000 150,000 120,000
Traceable FC 170,000 90,000 80,000
Division margin 100,000 60,000$ 40,000$
Common costs
Net operating
income
McGraw-Hill Education (Asia) Garrison, Noreen, Brewer, Cheng & Yuen Slide 26
Levels of Segmented Statements
Income Statement
Company Television Computer
Sales 500,000$ 300,000$ 200,000$
Variable costs 230,000 150,000 80,000
CM 270,000 150,000 120,000
Traceable FC 170,000 90,000 80,000
Division margin 100,000 60,000$ 40,000$
Common costs 25,000
Net operating
income 75,000$
Common costs should not
be allocated to the
divisions. These costs
would remain even if one
of the divisions were
eliminated.
McGraw-Hill Education (Asia) Garrison, Noreen, Brewer, Cheng & Yuen Slide 27
Traceable Costs Can Become
Common Costs
As previously mentioned, fixed costs that
are traceable to one segment can become
common if the company is divided into
smaller segments.
Let’s see how this works
using the Webber, Inc.
example!
McGraw-Hill Education (Asia) Garrison, Noreen, Brewer, Cheng & Yuen Slide 28
Traceable Costs Can Become
Common Costs
Product
Lines
Regular Big Screen
Television
Division
Webber’s Television Division
McGraw-Hill Education (Asia) Garrison, Noreen, Brewer, Cheng & Yuen Slide 29
Traceable Costs Can Become
Common Costs
We obtained the following information from
the Regular and Big Screen segments.
Income Statement
Television
Division Regular Big Screen
Sales 200,000$ 100,000$
Variable costs 95,000 55,000
CM 105,000 45,000
Traceable FC 45,000 35,000
Product line margin 60,000$ 10,000$
Common costs
Divisional margin
McGraw-Hill Education (Asia) Garrison, Noreen, Brewer, Cheng & Yuen Slide 30
Income Statement
Television
Division Regular Big Screen
Sales 300,000$ 200,000$ 100,000$
Variable costs 150,000 95,000 55,000
CM 150,000 105,000 45,000
Traceable FC 80,000 45,000 35,000
Product line margin 70,000 60,000$ 10,000$
Common costs 10,000
Divisional margin 60,000$
Traceable Costs Can Become
Common Costs
Fixed costs directly traced
to the Television Division
$80,000 + $10,000 = $90,000
McGraw-Hill Education (Asia) Garrison, Noreen, Brewer, Cheng & Yuen Slide 31
External Reports
The International Financial Reporting Standards (IFRS)
and US GAAP require companies to include segmented
financial data in their annual reports.
1. In addition to some compulsory
disclosure, companies must report
segmented results to shareholders
using the same measures to be used by
the Chief Operating Decision Maker
(CODM) to make decisions
2. Since the contribution approach to
segment reporting does not comply with
financial reporting standards, it is likely
that some managers will choose to
construct their segmented financial
statements using the absorption
approach to comply with GAAP.
McGraw-Hill Education (Asia) Garrison, Noreen, Brewer, Cheng & Yuen Slide 32
Omission of Costs
Costs assigned to a segment should include all
costs attributable to that segment from the
company’s entire value chain.
Product Customer
R&D Design Manufacturing Marketing Distribution Service
Business Functions
Making Up The
Value Chain
McGraw-Hill Education (Asia) Garrison, Noreen, Brewer, Cheng & Yuen Slide 33
Inappropriate Methods of Allocating Costs
Among Segments
Segment
1
Segment
3
Segment
4
Inappropriate
allocation base
Segment
2
Failure to trace
costs directly
McGraw-Hill Education (Asia) Garrison, Noreen, Brewer, Cheng & Yuen Slide 34
Common Costs and Segments
Segment
1
Segment
3
Segment
4
Segment
2
Common costs should not be arbitrarily allocated to segments
based on the rationale that “someone has to cover the
common costs” for two reasons:
1. This practice may make a profitable business segment appear
to be unprofitable.
2. Allocating common fixed costs forces managers to be held
accountable for costs they cannot control.
McGraw-Hill Education (Asia) Garrison, Noreen, Brewer, Cheng & Yuen Slide 35
Income Statement
Hoagland's
Lakeshore Bar Restaurant
Sales 800,000$ 100,000$ 700,000$
Variable costs 310,000 60,000 250,000
CM 490,000 40,000 450,000
Traceable FC 246,000 26,000 220,000
Segment margin 244,000 14,000$ 230,000$
Common costs 200,000
Profit 44,000$
Quick Check 
Assume that Hoagland's Lakeshore prepared its
segmented income statement as shown.
McGraw-Hill Education (Asia) Garrison, Noreen, Brewer, Cheng & Yuen Slide 36
Quick Check 
How much of the common fixed cost of $200,000
can be avoided by eliminating the bar?
a. None of it.
b. Some of it.
c. All of it.
McGraw-Hill Education (Asia) Garrison, Noreen, Brewer, Cheng & Yuen Slide 37
Quick Check 
How much of the common fixed cost of $200,000
can be avoided by eliminating the bar?
a. None of it.
b. Some of it.
c. All of it.
A common fixed cost
cannot be eliminated by
dropping one of the
segments.
McGraw-Hill Education (Asia) Garrison, Noreen, Brewer, Cheng & Yuen Slide 38
Quick Check 
Suppose square feet is used as the basis for
allocating the common fixed cost of $200,000. How
much would be allocated to the bar if the bar
occupies 1,000 square feet and the restaurant 9,000
square feet?
a. $20,000
b. $30,000
c. $40,000
d. $50,000
McGraw-Hill Education (Asia) Garrison, Noreen, Brewer, Cheng & Yuen Slide 39
Suppose square feet is used as the basis for
allocating the common fixed cost of $200,000. How
much would be allocated to the bar if the bar
occupies 1,000 square feet and the restaurant 9,000
square feet?
a. $20,000
b. $30,000
c. $40,000
d. $50,000
Quick Check 
The bar would be
allocated 1/10 of the cost
or $20,000.
McGraw-Hill Education (Asia) Garrison, Noreen, Brewer, Cheng & Yuen Slide 40
Quick Check 
If Hoagland's allocates its common
costs to the bar and the restaurant,
what would be the reported profit of
each segment?
McGraw-Hill Education (Asia) Garrison, Noreen, Brewer, Cheng & Yuen Slide 41
Income Statement
Hoagland's
Lakeshore Bar Restaurant
Sales 800,000$ 100,000$ 700,000$
Variable costs 310,000 60,000 250,000
CM 490,000 40,000 450,000
Traceable FC 246,000 26,000 220,000
Segment margin 244,000 14,000 230,000
Common costs 200,000 20,000 180,000
Profit 44,000$ (6,000)$ 50,000$
Allocations of Common Costs
Hurray, now everything adds up!!!
McGraw-Hill Education (Asia) Garrison, Noreen, Brewer, Cheng & Yuen Slide 42
Quick Check 
Should the bar be eliminated?
a. Yes
b. No
McGraw-Hill Education (Asia) Garrison, Noreen, Brewer, Cheng & Yuen Slide 43
Should the bar be eliminated?
a. Yes
b. No
Quick Check 
Income Statement
Hoagland's
Lakeshore Bar Restaurant
Sales 700,000$ 700,000$
Variable costs 250,000 250,000
CM 450,000 450,000
Traceable FC 220,000 220,000
Segment margin 230,000 230,000
Common costs 200,000 200,000
Profit 30,000$ 30,000$
The profit was $44,000 before
eliminating the bar. If we eliminate
the bar, profit drops to $30,000!
McGraw-Hill Education (Asia) Garrison, Noreen, Brewer, Cheng & Yuen Slide 44
Learning Objective 2
Compute return on investment
(ROI) and show how changes in
sales, expenses, and assets
affect ROI.
McGraw-Hill Education (Asia) Garrison, Noreen, Brewer, Cheng & Yuen Slide 45
Return on Investment (ROI) Formula
ROI =
Net operating income
Average operating assets
Cash, accounts receivable, inventory,
plant and equipment, and other
productive assets.
Income before interest
and taxes (EBIT)
McGraw-Hill Education (Asia) Garrison, Noreen, Brewer, Cheng & Yuen Slide 46
Net Book Value vs. Gross Cost
Most companies use the net book value of
depreciable assets to calculate average
operating assets.
Acquisition cost
Less: Accumulated depreciation
Net book value
McGraw-Hill Education (Asia) Garrison, Noreen, Brewer, Cheng & Yuen Slide 47
Understanding ROI
ROI =
Net operating income
Average operating assets
Margin =
Net operating income
Sales
Turnover =
Sales
Average operating assets
ROI = Margin  Turnover
McGraw-Hill Education (Asia) Garrison, Noreen, Brewer, Cheng & Yuen Slide 48
Increasing ROI
There are three ways to increase ROI . . .
Increase
Sales
Reduce
Expenses Reduce
Assets
McGraw-Hill Education (Asia) Garrison, Noreen, Brewer, Cheng & Yuen Slide 49
Increasing ROI – An Example
Regal Company reports the following:
Net operating income $ 30,000
Average operating assets $ 200,000
Sales $ 500,000
Operating expenses $ 470,000
ROI = Margin  Turnover
Net operating income
Sales
Sales
Average operating assets
×ROI =
What is Regal Company’s ROI?
McGraw-Hill Education (Asia) Garrison, Noreen, Brewer, Cheng & Yuen Slide 50
Increasing ROI – An Example
$30,000
$500,000
×
$500,000
$200,000
ROI =
6%  2.5 = 15%ROI =
ROI = Margin  Turnover
Net operating income
Sales
Sales
Average operating assets
×ROI =
McGraw-Hill Education (Asia) Garrison, Noreen, Brewer, Cheng & Yuen Slide 51
Investing in Operating Assets to Increase
Sales
Assume that Regal's manager invests in a $30,000
piece of equipment that increases sales by
$35,000, while increasing operating expenses
by $15,000.
Let’s calculate the new ROI.
Regal Company reports the following:
Net operating income $ 50,000
Average operating assets $ 230,000
Sales $ 535,000
Operating expenses $ 485,000
McGraw-Hill Education (Asia) Garrison, Noreen, Brewer, Cheng & Yuen Slide 52
Investing in Operating Assets to Increase
Sales
$50,000
$535,000
×
$535,000
$230,000
ROI =
9.35%  2.33 = 21.8%ROI =
ROI increased from 15% to 21.8%.
ROI = Margin  Turnover
Net operating income
Sales
Sales
Average operating assets
×ROI =
McGraw-Hill Education (Asia) Garrison, Noreen, Brewer, Cheng & Yuen Slide 53
Criticisms of ROI
In the absence of the balanced
scorecard, management may
not know how to increase ROI.
Managers often inherit many
committed costs over which
they have no control.
Managers evaluated on ROI
may reject profitable
investment opportunities.
McGraw-Hill Education (Asia) Garrison, Noreen, Brewer, Cheng & Yuen Slide 54
Learning Objective 3
Compute residual income and
understand its strengths and
weaknesses.
McGraw-Hill Education (Asia) Garrison, Noreen, Brewer, Cheng & Yuen Slide 55
Residual Income - Another Measure of
Performance
Net operating income
above some minimum
return on operating
assets
McGraw-Hill Education (Asia) Garrison, Noreen, Brewer, Cheng & Yuen Slide 56
Calculating Residual Income
Residual
income
=
Net
operating
income
-
Average
operating
assets

Minimum
required rate of
return
( )
This computation differs from ROI.
ROI measures net operating income earned relative
to the investment in average operating assets.
Residual income measures net operating income
earned less the minimum required return on average
operating assets.
McGraw-Hill Education (Asia) Garrison, Noreen, Brewer, Cheng & Yuen Slide 57
Residual Income – An Example
The Retail Division of Zephyr, Inc. has
average operating assets of $100,000 and is
required to earn a return of 20% on these
assets.
In the current period, the division earns
$30,000.
Let’s calculate residual income.
McGraw-Hill Education (Asia) Garrison, Noreen, Brewer, Cheng & Yuen Slide 58
Residual Income – An Example
Operating assets 100,000$
Required rate of return × 20%
Minimum required return 20,000$
Actual income 30,000$
Minimum required return (20,000)
Residual income 10,000$
McGraw-Hill Education (Asia) Garrison, Noreen, Brewer, Cheng & Yuen Slide 59
Motivation and Residual Income
Residual income encourages managers to
make profitable investments that would
be rejected by managers using ROI.
McGraw-Hill Education (Asia) Garrison, Noreen, Brewer, Cheng & Yuen Slide 60
Quick Check 
Redmond Awnings, a division of Wrap-up Corp., has
a net operating income of $60,000 and average
operating assets of $300,000. The required rate of
return for the company is 15%. What is the division’s
ROI?
a. 25%
b. 5%
c. 15%
d. 20%
McGraw-Hill Education (Asia) Garrison, Noreen, Brewer, Cheng & Yuen Slide 61
Quick Check 
Redmond Awnings, a division of Wrap-up Corp., has
a net operating income of $60,000 and average
operating assets of $300,000. The required rate of
return for the company is 15%. What is the division’s
ROI?
a. 25%
b. 5%
c. 15%
d. 20%
ROI = NOI/Average operating assets
= $60,000/$300,000 = 20%
McGraw-Hill Education (Asia) Garrison, Noreen, Brewer, Cheng & Yuen Slide 62
Quick Check 
Redmond Awnings, a division of Wrap-up Corp.,
has a net operating income of $60,000 and
average operating assets of $300,000. If the
manager of the division is evaluated based on
ROI, will she want to make an investment of
$100,000 that would generate additional net
operating income of $18,000 per year?
a. Yes
b. No
McGraw-Hill Education (Asia) Garrison, Noreen, Brewer, Cheng & Yuen Slide 63
Quick Check 
Redmond Awnings, a division of Wrap-up Corp.,
has a net operating income of $60,000 and
average operating assets of $300,000. If the
manager of the division is evaluated based on
ROI, will she want to make an investment of
$100,000 that would generate additional net
operating income of $18,000 per year?
a. Yes
b. No
ROI = $78,000/$400,000 = 19.5%
This lowers the division’s ROI from
20.0% down to 19.5%.
McGraw-Hill Education (Asia) Garrison, Noreen, Brewer, Cheng & Yuen Slide 64
Quick Check 
The company’s required rate of return is 15%.
Would the company want the manager of the
Redmond Awnings division to make an
investment of $100,000 that would generate
additional net operating income of $18,000 per
year?
a. Yes
b. No
McGraw-Hill Education (Asia) Garrison, Noreen, Brewer, Cheng & Yuen Slide 65
Quick Check 
The company’s required rate of return is 15%.
Would the company want the manager of the
Redmond Awnings division to make an
investment of $100,000 that would generate
additional net operating income of $18,000 per
year?
a. Yes
b. No
ROI = $18,000/$100,000 = 18%
The return on the investment
exceeds the minimum required rate
of return.
McGraw-Hill Education (Asia) Garrison, Noreen, Brewer, Cheng & Yuen Slide 66
Quick Check 
Redmond Awnings, a division of Wrap-up Corp., has
a net operating income of $60,000 and average
operating assets of $300,000. The required rate of
return for the company is 15%. What is the division’s
residual income?
a. $240,000
b. $ 45,000
c. $ 15,000
d. $ 51,000
McGraw-Hill Education (Asia) Garrison, Noreen, Brewer, Cheng & Yuen Slide 67
Quick Check 
Redmond Awnings, a division of Wrap-up Corp., has
a net operating income of $60,000 and average
operating assets of $300,000. The required rate of
return for the company is 15%. What is the division’s
residual income?
a. $240,000
b. $ 45,000
c. $ 15,000
d. $ 51,000
Net operating income $60,000
Required return (15% of $300,000) (45,000)
Residual income $15,000
McGraw-Hill Education (Asia) Garrison, Noreen, Brewer, Cheng & Yuen Slide 68
Quick Check 
If the manager of the Redmond Awnings division
is evaluated based on residual income, will she
want to make an investment of $100,000 that
would generate additional net operating income
of $18,000 per year?
a. Yes
b. No
McGraw-Hill Education (Asia) Garrison, Noreen, Brewer, Cheng & Yuen Slide 69
Quick Check 
If the manager of the Redmond Awnings division
is evaluated based on residual income, will she
want to make an investment of $100,000 that
would generate additional net operating income
of $18,000 per year?
a. Yes
b. No Net operating income $78,000
Required return (15% of $400,000) (60,000)
Residual income $18,000
Yields an increase of $3,000 in the residual income.
McGraw-Hill Education (Asia) Garrison, Noreen, Brewer, Cheng & Yuen Slide 70
Divisional Comparisons and Residual
Income
The residual
income approach
has one major
disadvantage.
It cannot be used
to compare the
performance of
divisions of
different sizes.
McGraw-Hill Education (Asia) Garrison, Noreen, Brewer, Cheng & Yuen Slide 71
Zephyr, Inc. - Continued
Retail Wholesale
Operating assets 100,000$ 1,000,000$
Required rate of return × 20% 20%
Minimum required return 20,000$ 200,000$
Retail Wholesale
Actual income 30,000$ 220,000$
Minimum required return (20,000) (200,000)
Residual income 10,000$ 20,000$
Recall the following
information for the Retail
Division of Zephyr, Inc.
Assume the following
information for the Wholesale
Division of Zephyr, Inc.
McGraw-Hill Education (Asia) Garrison, Noreen, Brewer, Cheng & Yuen Slide 72
Zephyr, Inc. - Continued
Retail Wholesale
Operating assets 100,000$ 1,000,000$
Required rate of return × 20% 20%
Minimum required return 20,000$ 200,000$
Retail Wholesale
Actual income 30,000$ 220,000$
Minimum required return (20,000) (200,000)
Residual income 10,000$ 20,000$
The residual income numbers suggest that the Wholesale Division outperformed
the Retail Division because its residual income is $10,000 higher. However, the
Retail Division earned an ROI of 30% compared to an ROI of 22% for the
Wholesale Division. The Wholesale Division’s residual income is larger than the
Retail Division simply because it is a bigger division.
McGraw-Hill Education (Asia) Garrison, Noreen, Brewer, Cheng & Yuen Slide 73
Learning Objective 4
Understand how to construct
and use a balanced scorecard.
McGraw-Hill Education (Asia) Garrison, Noreen, Brewer, Cheng & Yuen Slide 74
The Balanced Scorecard
Management translates its strategy into
performance measures that employees
understand and influence.
Performance
measures
Customers
Learning
and growth
Internal
business
processes
Financial
McGraw-Hill Education (Asia) Garrison, Noreen, Brewer, Cheng & Yuen Slide 75
The Balanced Scorecard: From
Strategy to Performance Measures
Financial
Has our financial
performance improved?
Customer
Do customers recognize that
we are delivering more value?
Internal Business Processes
Have we improved key business
processes so that we can deliver
more value to customers?
Learning and Growth
Are we maintaining our ability
to change and improve?
Performance Measures
What are our
financial goals?
What customers do
we want to serve and
how are we going to
win and retain them?
What internal busi-
ness processes are
critical to providing
value to customers?
Vision
and
Strategy
McGraw-Hill Education (Asia) Garrison, Noreen, Brewer, Cheng & Yuen Slide 76
The Balanced Scorecard:
Non-financial Measures
The balanced scorecard relies on non-financial measures
in addition to financial measures for two reasons:
 Financial measures are lag indicators that summarize
the results of past actions. Non-financial measures are
leading indicators of future financial performance.
 Top managers are ordinarily responsible for financial
performance measures – not lower level managers.
Non-financial measures are more likely to be
understood and controlled by lower level managers.
McGraw-Hill Education (Asia) Garrison, Noreen, Brewer, Cheng & Yuen Slide 77
The Balanced Scorecard for Individuals
A personal scorecard should contain measures that can be
influenced by the individual being evaluated and that
support the measures in the overall balanced scorecard.
The entire organization
should have an overall
balanced scorecard.
Each individual should
have a personal
balanced scorecard.
McGraw-Hill Education (Asia) Garrison, Noreen, Brewer, Cheng & Yuen Slide 78
The balanced scorecard lays out concrete
actions to attain desired outcomes.
A balanced scorecard should have measures
that are linked together on a cause-and-effect basis.
If we improve
one performance
measure . . .
Another desired
performance measure
will improve.
The Balanced Scorecard
Then
McGraw-Hill Education (Asia) Garrison, Noreen, Brewer, Cheng & Yuen Slide 79
The Balanced Scorecard and Compensation
Incentive compensation should be linked to
balanced scorecard performance
measures.
McGraw-Hill Education (Asia) Garrison, Noreen, Brewer, Cheng & Yuen Slide 80
Employee skills in
installing options
Number of
options available
Time to
install option
Customer satisfaction
with options
Number of cars sold
Contribution per car
Profit
Learning
and Growth
Internal
Business
Processes
Customer
Financial
The Balanced Scorecard ─ Jaguar Example
McGraw-Hill Education (Asia) Garrison, Noreen, Brewer, Cheng & Yuen Slide 81
Employee skills in
installing options
Number of
options available
Time to
install option
Customer satisfaction
with options
Number of cars sold
Contribution per car
Profit
Increase
Options Time
Decreases
Strategies
Satisfaction
Increases
Increase
Skills
Results
The Balanced Scorecard ─ Jaguar Example
McGraw-Hill Education (Asia) Garrison, Noreen, Brewer, Cheng & Yuen Slide 82
Employee skills in
installing options
Number of
options available
Time to
install option
Customer satisfaction
with options
Number of cars sold
Contribution per car
Profit
Satisfaction
Increases
Results
Cars sold
Increase
The Balanced Scorecard ─ Jaguar Example
McGraw-Hill Education (Asia) Garrison, Noreen, Brewer, Cheng & Yuen Slide 83
Employee skills in
installing options
Number of
options available
Time to
install option
Customer satisfaction
with options
Number of cars sold
Contribution per car
Profit
Results
Time
Decreases
Contribution
Increases
Satisfaction
Increases
The Balanced Scorecard ─ Jaguar Example
McGraw-Hill Education (Asia) Garrison, Noreen, Brewer, Cheng & Yuen Slide 84
The Balanced Scorecard ─ Jaguar Example
Employee skills in
installing options
Number of
options available
Time to
install option
Customer satisfaction
with options
Number of cars sold
Contribution per car
Profit
Results
Contribution
Increases
Profits
Increase
If number
of cars sold
and contribution
per car increase,
profits
increase.
Cars Sold
Increases
McGraw-Hill Education (Asia) Garrison, Noreen, Brewer, Cheng & Yuen Slide 85
Key Performance Indicators for a Balanced
Scorecard
Key performance indicators (KPIs) should address
•Missions and Vision of the organization
•Management principles and objectives (i.e. Execution of strategy)
•Critical success factors of the organization and operations
•Key objectives of the subsidiary/division/department/employee
•Balance of lead and lag measures (i.e. measures that lead to
future success and measures that reflect historical performance)
Number of KPI s should be kept at a controllable number.
McGraw-Hill Education (Asia) Garrison, Noreen, Brewer, Cheng & Yuen Slide 86
Summary of the Measures and Their Purposes
Financial Customer
Internal
Business
Process
Learning &
Growth
Performance Measures F1 F2 C1 C2 IBP1 IBP2 LG1 LG2
Objectives / Critical Success Factors
Missions
&Vision
Employee Satisfaction **  
Customer Satisfaction **  
Management
Principles
Innovative Products **  
Profitable Growth 
Focus on delivery of quality
products to valued customers
 
Responsibilities to Society     
Critical
Factors
Quality  
Response Time 
Cost    
Division’s
Objective
Sales Growth **  
** = Also a critical success factor
F1 = residual income (or EVATM
) Improvement IBP1 = production defect rate
F2 = sales growth IBP2 = percentage goods returned to sales
C1 = turnover percentage from key customers LG1 = employee productivity
C2 = percentage of delivery accuracy LG2 = employee satisfaction index
McGraw-Hill Education (Asia) Garrison, Noreen, Brewer, Cheng & Yuen Slide 87
A Balanced Scorecard Example for a Business Division of a Media Product Manufacturer
Measures Targets Review
Frequency
Objectives
Financial
F1 EVA improvement This year’s EVA– Previous year′
s EVA
Previous year′ s EVA
15% Annually Profitability
and effective
use of funds
F2 Sales growth This year’s sales dollar – Previous year′
sales dollar
Previous year′ sales dollar
15% Annually Sales growth
Customer
C1 Turnover
percentage from
key customers
Loss of number of customers with annual
revenue of more than $10m.
0% Frequently
(Minimum
Quarterly)
 Quality of
products and
services
 Customer
satisfaction
 Sales and
marketing
effort
C2 Delivery accuracy On-time delivery per order 100% Frequently
(Minimum
Quarterly)
 Customer
satisfaction
 Coordinating
effort
Internal Business Process
IBP1 Defects per
million units
Defects per million units 3 Monthly  Quality
 Cost
IBP2 Percentage of
goods returned
Actual sales value of goods returned
Sales value before goods returns
0.3% Monthly  Production
quality
 On time
delivery
Learning and Growth
LG1 Employee
productivity
Sales dollar per man-hour $300 per
man-hour
Annually  Employee
training and
productivity
 Employee
satisfaction
LG2 Employee
satisfaction index
Survey’s index score Index score
85
Six months Employee
satisfaction
Strategic Linkage between measures and perspectives
© 2012 McGraw-Hill Education (Asia)
Transfer Pricing
Appendix 13A
McGraw-Hill Education (Asia) Garrison, Noreen, Brewer, Cheng & Yuen Slide 89
Key Concepts/Definitions
A transfer price is the price
charged when one segment of
a company provides goods or
services to another segment of
the company.
The fundamental objective in
setting transfer prices is to
motivate managers to act in the
best interests of the overall
company.
McGraw-Hill Education (Asia) Garrison, Noreen, Brewer, Cheng & Yuen Slide 90
Three Primary Approaches
There are three primary
approaches to setting
transfer prices:
1. Negotiated transfer prices;
2. Transfers at the cost to the
selling division; and
3. Transfers at market price.
McGraw-Hill Education (Asia) Garrison, Noreen, Brewer, Cheng & Yuen Slide 91
Learning Objective 5
Determine the range, if any,
within which a negotiated
transfer price should fall.
McGraw-Hill Education (Asia) Garrison, Noreen, Brewer, Cheng & Yuen Slide 92
Negotiated Transfer Prices
A negotiated transfer price results from discussions
between the selling and buying divisions.
Advantages of negotiated transfer prices:
1. They preserve the autonomy of the
divisions, which is consistent with
the spirit of decentralization.
2. The managers negotiating the
transfer price are likely to have much
better information about the potential
costs and benefits of the transfer
than others in the company.
Upper limit is
determined by the
buying division.
Lower limit is
determined by the
selling division.
Range of Acceptable
Transfer Prices
McGraw-Hill Education (Asia) Garrison, Noreen, Brewer, Cheng & Yuen Slide 93
Grocery Storehouse – An Example
West Coast Plantations:
Naval orange harvest capactiy per month 10,000 crates
Variable cost per crate of naval oranges 10$ per crate
Fixed costs per month 100,000$
Selling price of navel oranges on the outside
market 25$ per crate
Grocery Mart:
Purchase price of current naval oranges 20$ per crate
Monthly sales of naval oranges 1,000 crates
Assume the information as shown with
respect to West Coast Plantations and Grocery
Mart (both companies are owned by Grocery
Storehouse).
McGraw-Hill Education (Asia) Garrison, Noreen, Brewer, Cheng & Yuen Slide 94
Grocery Storehouse – An Example
The selling division’s (West Coast Plantations) lowest acceptable transfer
price is calculated as:
Variable cost Total contribution margin on lost sales
per unit Number of units transferred
Transfer Price  +
Transfer Price  Cost of buying from outside supplier
The buying division’s (Grocery Mart) highest acceptable transfer price is
calculated as:
Let’s calculate the lowest and highest acceptable
transfer prices under three scenarios.
Transfer Price  Profit to be earned per unit sold (not including the transfer price)
If an outside supplier does not exist, the highest acceptable transfer price
is calculated as:
McGraw-Hill Education (Asia) Garrison, Noreen, Brewer, Cheng & Yuen Slide 95
Grocery Storehouse – An Example
If West Coast Plantations has sufficient idle capacity (3,000 crates) to
satisfy Grocery Mart’s demands (1,000 crates), without sacrificing
sales to other customers, then the lowest and highest possible
transfer prices are computed as follows:
-$
1,000
= 10$Transfer Price  +10$
Selling division’s lowest possible transfer price:
Transfer Price  Cost of buying from outside supplier = 20$
Buying division’s highest possible transfer price:
Therefore, the range of acceptable
transfer prices is $10 – $20.
McGraw-Hill Education (Asia) Garrison, Noreen, Brewer, Cheng & Yuen Slide 96
Grocery Storehouse – An Example
If West Coast Plantations has no idle capacity (0 crates) and must
sacrifice other customer orders (1,000 crates) to meet Grocery Mart’s
demands (1,000 crates), then the lowest and highest possible transfer
prices are computed as follows:
( $25 - $10) × 1,000
1,000
= 25$Transfer Price  +10$
Selling division’s lowest possible transfer price:
Transfer Price  Cost of buying from outside supplier = 20$
Buying division’s highest possible transfer price:
Therefore, there is no range of
acceptable transfer prices.
McGraw-Hill Education (Asia) Garrison, Noreen, Brewer, Cheng & Yuen Slide 97
Grocery Storehouse – An Example
If West Coast Plantations has some idle capacity (500 crates) and
must sacrifice other customer orders (500 crates) to meet Grocery
Mart’s demands (1,000 crates), then the lowest and highest possible
transfer prices are computed as follows:
Transfer Price  Cost of buying from outside supplier = 20$
Buying division’s highest possible transfer price:
Therefore, the range of acceptable
transfer prices is $17.50 – $20.00.
Selling division’s lowest possible transfer price:
( $25 - $10) × 500
1,000
= 17.50$Transfer Price  +10$
McGraw-Hill Education (Asia) Garrison, Noreen, Brewer, Cheng & Yuen Slide 98
Evaluation of Negotiated Transfer Prices
If a transfer within a company would result in
higher overall profits for the company, there is
always a range of transfer prices within which
both the selling and buying divisions would have
higher profits if they agree to the transfer.
If managers are pitted against each other rather
than against their past performance or
reasonable benchmarks, a noncooperative
atmosphere is almost guaranteed.
Given the disputes that often accompany the
negotiation process, most companies rely on
some other means of setting transfer prices.
McGraw-Hill Education (Asia) Garrison, Noreen, Brewer, Cheng & Yuen Slide 99
Transfers at the Cost to the Selling Division
Many companies set transfer prices at either
the variable cost or full (absorption) cost
incurred by the selling division.
Drawbacks of this approach include:
1. Using full cost as a transfer price
can lead to suboptimization.
2. The selling division will never
show a profit on any internal
transfer.
3. Cost-based transfer prices do not
provide incentives to control
costs.
McGraw-Hill Education (Asia) Garrison, Noreen, Brewer, Cheng & Yuen Slide 100
Transfers at Market Price
A market price (i.e., the price charged for an
item on the open market) is often regarded as
the best approach to the transfer pricing
problem.
1. A market price approach works
best when the product or service
is sold in its present form to
outside customers and the
selling division has no idle
capacity.
2. A market price approach does
not work well when the selling
division has idle capacity.
McGraw-Hill Education (Asia) Garrison, Noreen, Brewer, Cheng & Yuen Slide 101
Divisional Autonomy and Suboptimization
The principles of
decentralization suggest
that companies should
grant managers autonomy
to set transfer prices and
to decide whether to sell
internally or externally,
even if this may
occasionally result in
suboptimal decisions.
This way top management
allows subordinates to
control their own destiny.
McGraw-Hill Education (Asia) Garrison, Noreen, Brewer, Cheng & Yuen Slide 102
End of Chapter 13

Bab 5

  • 1.
    © 2012 McGraw-HillEducation (Asia) Segment Reporting, Decentralization, and the Balanced Scorecard Chapter 13
  • 2.
    McGraw-Hill Education (Asia)Garrison, Noreen, Brewer, Cheng & Yuen Slide 2 Decentralization in Organizations Benefits of Decentralization Top management freed to concentrate on strategy. Lower-level managers gain experience in decision-making. Decision-making authority leads to job satisfaction. Lower-level decisions often based on better information. Lower level managers can respond quickly to customers.
  • 3.
    McGraw-Hill Education (Asia)Garrison, Noreen, Brewer, Cheng & Yuen Slide 3 Decentralization in Organizations Disadvantages of Decentralization Lower-level managers may make decisions without seeing the “big picture.” May be a lack of coordination among autonomous managers. Lower-level manager’s objectives may not be those of the organization. May be difficult to spread innovative ideas in the organization.
  • 4.
    McGraw-Hill Education (Asia)Garrison, Noreen, Brewer, Cheng & Yuen Slide 4 Cost, Profit, and Investments Centers Responsibility Center Cost Center Profit Center Investment Center Cost, profit, and investment centers are all known as responsibility centers.
  • 5.
    McGraw-Hill Education (Asia)Garrison, Noreen, Brewer, Cheng & Yuen Slide 5 Cost Center A segment whose manager has control over costs, but not over revenues or investment funds.
  • 6.
    McGraw-Hill Education (Asia)Garrison, Noreen, Brewer, Cheng & Yuen Slide 6 Profit Center A segment whose manager has control over both costs and revenues, but no control over investment funds. Revenues Sales Interest Other Costs Mfg. costs Commissions Salaries Other
  • 7.
    McGraw-Hill Education (Asia)Garrison, Noreen, Brewer, Cheng & Yuen Slide 7 Investment Center A segment whose manager has control over costs, revenues, and investments in operating assets. Corporate Headquarters
  • 8.
    McGraw-Hill Education (Asia)Garrison, Noreen, Brewer, Cheng & Yuen Slide 8 Responsibility Centers Salty Snacks Product Manger Bottling Plant Manager Warehouse Manager Distribution Manager Beverages Product Manager Confections Product Manager Operations Vice President Finance Chief FInancial Officer Legal General Counsel Personnel Vice President Superior Foods Corporation Corporate Headquarters President and CEO Cost Centers Investment Centers Superior Foods Corporation provides an example of the various kinds of responsibility centers that exist in an organization.
  • 9.
    McGraw-Hill Education (Asia)Garrison, Noreen, Brewer, Cheng & Yuen Slide 9 Responsibility Centers Salty Snacks Product Manger Bottling Plant Manager Warehouse Manager Distribution Manager Beverages Product Manager Confections Product Manager Operations Vice President Finance Chief FInancial Officer Legal General Counsel Personnel Vice President Superior Foods Corporation Corporate Headquarters President and CEO Superior Foods Corporation provides an example of the various kinds of responsibility centers that exist in an organization. Profit Centers
  • 10.
    McGraw-Hill Education (Asia)Garrison, Noreen, Brewer, Cheng & Yuen Slide 10 Responsibility Centers Salty Snacks Product Manger Bottling Plant Manager Warehouse Manager Distribution Manager Beverages Product Manager Confections Product Manager Operations Vice President Finance Chief FInancial Officer Legal General Counsel Personnel Vice President Superior Foods Corporation Corporate Headquarters President and CEO Cost Centers Superior Foods Corporation provides an example of the various kinds of responsibility centers that exist in an organization.
  • 11.
    McGraw-Hill Education (Asia)Garrison, Noreen, Brewer, Cheng & Yuen Slide 11 Learning Objective 1 Prepare a segmented income statement using the contribution format, and explain the difference between traceable fixed costs and common fixed costs.
  • 12.
    McGraw-Hill Education (Asia)Garrison, Noreen, Brewer, Cheng & Yuen Slide 12 Decentralization and Segment Reporting A segment is any part or activity of an organization about which a manager seeks cost, revenue, or profit data. Popular Foods An Individual Store A Sales Territory A Service Center
  • 13.
    McGraw-Hill Education (Asia)Garrison, Noreen, Brewer, Cheng & Yuen Slide 13 Superior Foods: Geographic Regions Superior Foods Corporation could segment its business by geographic region. Superior Foods Corporation $500,000,000 Singapore $55,000,000 Malaysia $70,000,000 China $300,000,000 Shanghai $120,000,000 Beijing $85,000,000 Guangzhou $50,000,000 Hangzhou $45,000,000 Taiwan $75,000,000
  • 14.
    McGraw-Hill Education (Asia)Garrison, Noreen, Brewer, Cheng & Yuen Slide 14 Superior Foods: Customer Channel Superior Foods Corporation could segment its business by customer channel. Superior Foods Corporation $500,000,000 Convenience Stores $80,000,000 Supermarket Chains $280,000,000 Cold Store $85,000,000 Mart Place $40,000,000 Buy n Save $90,000,000 Huge $65,000,000 Wholesale Distributors $100,000,000 Drugstores $40,000,000
  • 15.
    McGraw-Hill Education (Asia)Garrison, Noreen, Brewer, Cheng & Yuen Slide 15 Keys to Segmented Income Statements There are two keys to building segmented income statements: A contribution format should be used because it separates fixed from variable costs and it enables the calculation of a contribution margin. Traceable fixed costs should be separated from common fixed costs to enable the calculation of a segment margin.
  • 16.
    McGraw-Hill Education (Asia)Garrison, Noreen, Brewer, Cheng & Yuen Slide 16 Identifying Traceable Fixed Costs Traceable costs arise because of the existence of a particular segment and would disappear over time if the segment itself disappeared. No computer division means . . . No computer division manager.
  • 17.
    McGraw-Hill Education (Asia)Garrison, Noreen, Brewer, Cheng & Yuen Slide 17 Identifying Common Fixed Costs Common costs arise because of the overall operation of the company and would not disappear if any particular segment were eliminated. No computer division but . . . We still have a company president.
  • 18.
    McGraw-Hill Education (Asia)Garrison, Noreen, Brewer, Cheng & Yuen Slide 18 Traceable Costs Can Become Common Costs It is important to realize that the traceable fixed costs of one segment may be a common fixed cost of another segment. For example, the landing fee paid to land an airplane at an airport is traceable to the particular flight, but it is not traceable to first-class, business-class, and economy-class passengers.
  • 19.
    McGraw-Hill Education (Asia)Garrison, Noreen, Brewer, Cheng & Yuen Slide 19 Segment Margin The segment margin, which is computed by subtracting the traceable fixed costs of a segment from its contribution margin, is the best gauge of the long-run profitability of a segment. Time Profits
  • 20.
    McGraw-Hill Education (Asia)Garrison, Noreen, Brewer, Cheng & Yuen Slide 20 Traceable and Common Costs Fixed Costs Traceable Common Don’t allocate common costs to segments.
  • 21.
    McGraw-Hill Education (Asia)Garrison, Noreen, Brewer, Cheng & Yuen Slide 21 Activity-Based Costing 9-inch 12-inch 18-inch Total Warehouse sq. ft. 1,000 4,000 5,000 10,000 Lease price per sq. ft. 4$ 4$ 4$ 4$ Total lease cost 4,000$ 16,000$ 20,000$ 40,000$ Pipe Products Activity-based costing can help identify how costs shared by more than one segment are traceable to individual segments. Assume that three products, 9-inch, 12-inch, and 18-inch pipe, share 10,000 square feet of warehousing space, which is leased at a price of $4 per square foot. If the 9-inch, 12-inch, and 18-inch pipes occupy 1,000, 4,000, and 5,000 square feet, respectively, then ABC can be used to trace the warehousing costs to the three products as shown.
  • 22.
    McGraw-Hill Education (Asia)Garrison, Noreen, Brewer, Cheng & Yuen Slide 22 Levels of Segmented Statements Let’s look more closely at the Television Division’s income statement. Webber, Inc. has two divisions. Computer Division Television Division Webber, Inc.
  • 23.
    McGraw-Hill Education (Asia)Garrison, Noreen, Brewer, Cheng & Yuen Slide 23 Levels of Segmented Statements Our approach to segment reporting uses the contribution format. Income Statement Contribution Margin Format Television Division Sales 300,000$ Variable COGS 120,000 Other variable costs 30,000 Total variable costs 150,000 Contribution margin 150,000 Traceable fixed costs 90,000 Division margin 60,000$ Cost of goods sold consists of variable manufacturing costs. Fixed and variable costs are listed in separate sections.
  • 24.
    McGraw-Hill Education (Asia)Garrison, Noreen, Brewer, Cheng & Yuen Slide 24 Levels of Segmented Statements Segment margin is Television’s contribution to profits. Income Statement Contribution Margin Format Television Division Sales 300,000$ Variable COGS 120,000 Other variable costs 30,000 Total variable costs 150,000 Contribution margin 150,000 Traceable fixed costs 90,000 Division margin 60,000$ Contribution margin is computed by taking sales minus variable costs. Our approach to segment reporting uses the contribution format.
  • 25.
    McGraw-Hill Education (Asia)Garrison, Noreen, Brewer, Cheng & Yuen Slide 25 Levels of Segmented Statements Income Statement Company Television Computer Sales 500,000$ 300,000$ 200,000$ Variable costs 230,000 150,000 80,000 CM 270,000 150,000 120,000 Traceable FC 170,000 90,000 80,000 Division margin 100,000 60,000$ 40,000$ Common costs Net operating income
  • 26.
    McGraw-Hill Education (Asia)Garrison, Noreen, Brewer, Cheng & Yuen Slide 26 Levels of Segmented Statements Income Statement Company Television Computer Sales 500,000$ 300,000$ 200,000$ Variable costs 230,000 150,000 80,000 CM 270,000 150,000 120,000 Traceable FC 170,000 90,000 80,000 Division margin 100,000 60,000$ 40,000$ Common costs 25,000 Net operating income 75,000$ Common costs should not be allocated to the divisions. These costs would remain even if one of the divisions were eliminated.
  • 27.
    McGraw-Hill Education (Asia)Garrison, Noreen, Brewer, Cheng & Yuen Slide 27 Traceable Costs Can Become Common Costs As previously mentioned, fixed costs that are traceable to one segment can become common if the company is divided into smaller segments. Let’s see how this works using the Webber, Inc. example!
  • 28.
    McGraw-Hill Education (Asia)Garrison, Noreen, Brewer, Cheng & Yuen Slide 28 Traceable Costs Can Become Common Costs Product Lines Regular Big Screen Television Division Webber’s Television Division
  • 29.
    McGraw-Hill Education (Asia)Garrison, Noreen, Brewer, Cheng & Yuen Slide 29 Traceable Costs Can Become Common Costs We obtained the following information from the Regular and Big Screen segments. Income Statement Television Division Regular Big Screen Sales 200,000$ 100,000$ Variable costs 95,000 55,000 CM 105,000 45,000 Traceable FC 45,000 35,000 Product line margin 60,000$ 10,000$ Common costs Divisional margin
  • 30.
    McGraw-Hill Education (Asia)Garrison, Noreen, Brewer, Cheng & Yuen Slide 30 Income Statement Television Division Regular Big Screen Sales 300,000$ 200,000$ 100,000$ Variable costs 150,000 95,000 55,000 CM 150,000 105,000 45,000 Traceable FC 80,000 45,000 35,000 Product line margin 70,000 60,000$ 10,000$ Common costs 10,000 Divisional margin 60,000$ Traceable Costs Can Become Common Costs Fixed costs directly traced to the Television Division $80,000 + $10,000 = $90,000
  • 31.
    McGraw-Hill Education (Asia)Garrison, Noreen, Brewer, Cheng & Yuen Slide 31 External Reports The International Financial Reporting Standards (IFRS) and US GAAP require companies to include segmented financial data in their annual reports. 1. In addition to some compulsory disclosure, companies must report segmented results to shareholders using the same measures to be used by the Chief Operating Decision Maker (CODM) to make decisions 2. Since the contribution approach to segment reporting does not comply with financial reporting standards, it is likely that some managers will choose to construct their segmented financial statements using the absorption approach to comply with GAAP.
  • 32.
    McGraw-Hill Education (Asia)Garrison, Noreen, Brewer, Cheng & Yuen Slide 32 Omission of Costs Costs assigned to a segment should include all costs attributable to that segment from the company’s entire value chain. Product Customer R&D Design Manufacturing Marketing Distribution Service Business Functions Making Up The Value Chain
  • 33.
    McGraw-Hill Education (Asia)Garrison, Noreen, Brewer, Cheng & Yuen Slide 33 Inappropriate Methods of Allocating Costs Among Segments Segment 1 Segment 3 Segment 4 Inappropriate allocation base Segment 2 Failure to trace costs directly
  • 34.
    McGraw-Hill Education (Asia)Garrison, Noreen, Brewer, Cheng & Yuen Slide 34 Common Costs and Segments Segment 1 Segment 3 Segment 4 Segment 2 Common costs should not be arbitrarily allocated to segments based on the rationale that “someone has to cover the common costs” for two reasons: 1. This practice may make a profitable business segment appear to be unprofitable. 2. Allocating common fixed costs forces managers to be held accountable for costs they cannot control.
  • 35.
    McGraw-Hill Education (Asia)Garrison, Noreen, Brewer, Cheng & Yuen Slide 35 Income Statement Hoagland's Lakeshore Bar Restaurant Sales 800,000$ 100,000$ 700,000$ Variable costs 310,000 60,000 250,000 CM 490,000 40,000 450,000 Traceable FC 246,000 26,000 220,000 Segment margin 244,000 14,000$ 230,000$ Common costs 200,000 Profit 44,000$ Quick Check  Assume that Hoagland's Lakeshore prepared its segmented income statement as shown.
  • 36.
    McGraw-Hill Education (Asia)Garrison, Noreen, Brewer, Cheng & Yuen Slide 36 Quick Check  How much of the common fixed cost of $200,000 can be avoided by eliminating the bar? a. None of it. b. Some of it. c. All of it.
  • 37.
    McGraw-Hill Education (Asia)Garrison, Noreen, Brewer, Cheng & Yuen Slide 37 Quick Check  How much of the common fixed cost of $200,000 can be avoided by eliminating the bar? a. None of it. b. Some of it. c. All of it. A common fixed cost cannot be eliminated by dropping one of the segments.
  • 38.
    McGraw-Hill Education (Asia)Garrison, Noreen, Brewer, Cheng & Yuen Slide 38 Quick Check  Suppose square feet is used as the basis for allocating the common fixed cost of $200,000. How much would be allocated to the bar if the bar occupies 1,000 square feet and the restaurant 9,000 square feet? a. $20,000 b. $30,000 c. $40,000 d. $50,000
  • 39.
    McGraw-Hill Education (Asia)Garrison, Noreen, Brewer, Cheng & Yuen Slide 39 Suppose square feet is used as the basis for allocating the common fixed cost of $200,000. How much would be allocated to the bar if the bar occupies 1,000 square feet and the restaurant 9,000 square feet? a. $20,000 b. $30,000 c. $40,000 d. $50,000 Quick Check  The bar would be allocated 1/10 of the cost or $20,000.
  • 40.
    McGraw-Hill Education (Asia)Garrison, Noreen, Brewer, Cheng & Yuen Slide 40 Quick Check  If Hoagland's allocates its common costs to the bar and the restaurant, what would be the reported profit of each segment?
  • 41.
    McGraw-Hill Education (Asia)Garrison, Noreen, Brewer, Cheng & Yuen Slide 41 Income Statement Hoagland's Lakeshore Bar Restaurant Sales 800,000$ 100,000$ 700,000$ Variable costs 310,000 60,000 250,000 CM 490,000 40,000 450,000 Traceable FC 246,000 26,000 220,000 Segment margin 244,000 14,000 230,000 Common costs 200,000 20,000 180,000 Profit 44,000$ (6,000)$ 50,000$ Allocations of Common Costs Hurray, now everything adds up!!!
  • 42.
    McGraw-Hill Education (Asia)Garrison, Noreen, Brewer, Cheng & Yuen Slide 42 Quick Check  Should the bar be eliminated? a. Yes b. No
  • 43.
    McGraw-Hill Education (Asia)Garrison, Noreen, Brewer, Cheng & Yuen Slide 43 Should the bar be eliminated? a. Yes b. No Quick Check  Income Statement Hoagland's Lakeshore Bar Restaurant Sales 700,000$ 700,000$ Variable costs 250,000 250,000 CM 450,000 450,000 Traceable FC 220,000 220,000 Segment margin 230,000 230,000 Common costs 200,000 200,000 Profit 30,000$ 30,000$ The profit was $44,000 before eliminating the bar. If we eliminate the bar, profit drops to $30,000!
  • 44.
    McGraw-Hill Education (Asia)Garrison, Noreen, Brewer, Cheng & Yuen Slide 44 Learning Objective 2 Compute return on investment (ROI) and show how changes in sales, expenses, and assets affect ROI.
  • 45.
    McGraw-Hill Education (Asia)Garrison, Noreen, Brewer, Cheng & Yuen Slide 45 Return on Investment (ROI) Formula ROI = Net operating income Average operating assets Cash, accounts receivable, inventory, plant and equipment, and other productive assets. Income before interest and taxes (EBIT)
  • 46.
    McGraw-Hill Education (Asia)Garrison, Noreen, Brewer, Cheng & Yuen Slide 46 Net Book Value vs. Gross Cost Most companies use the net book value of depreciable assets to calculate average operating assets. Acquisition cost Less: Accumulated depreciation Net book value
  • 47.
    McGraw-Hill Education (Asia)Garrison, Noreen, Brewer, Cheng & Yuen Slide 47 Understanding ROI ROI = Net operating income Average operating assets Margin = Net operating income Sales Turnover = Sales Average operating assets ROI = Margin  Turnover
  • 48.
    McGraw-Hill Education (Asia)Garrison, Noreen, Brewer, Cheng & Yuen Slide 48 Increasing ROI There are three ways to increase ROI . . . Increase Sales Reduce Expenses Reduce Assets
  • 49.
    McGraw-Hill Education (Asia)Garrison, Noreen, Brewer, Cheng & Yuen Slide 49 Increasing ROI – An Example Regal Company reports the following: Net operating income $ 30,000 Average operating assets $ 200,000 Sales $ 500,000 Operating expenses $ 470,000 ROI = Margin  Turnover Net operating income Sales Sales Average operating assets ×ROI = What is Regal Company’s ROI?
  • 50.
    McGraw-Hill Education (Asia)Garrison, Noreen, Brewer, Cheng & Yuen Slide 50 Increasing ROI – An Example $30,000 $500,000 × $500,000 $200,000 ROI = 6%  2.5 = 15%ROI = ROI = Margin  Turnover Net operating income Sales Sales Average operating assets ×ROI =
  • 51.
    McGraw-Hill Education (Asia)Garrison, Noreen, Brewer, Cheng & Yuen Slide 51 Investing in Operating Assets to Increase Sales Assume that Regal's manager invests in a $30,000 piece of equipment that increases sales by $35,000, while increasing operating expenses by $15,000. Let’s calculate the new ROI. Regal Company reports the following: Net operating income $ 50,000 Average operating assets $ 230,000 Sales $ 535,000 Operating expenses $ 485,000
  • 52.
    McGraw-Hill Education (Asia)Garrison, Noreen, Brewer, Cheng & Yuen Slide 52 Investing in Operating Assets to Increase Sales $50,000 $535,000 × $535,000 $230,000 ROI = 9.35%  2.33 = 21.8%ROI = ROI increased from 15% to 21.8%. ROI = Margin  Turnover Net operating income Sales Sales Average operating assets ×ROI =
  • 53.
    McGraw-Hill Education (Asia)Garrison, Noreen, Brewer, Cheng & Yuen Slide 53 Criticisms of ROI In the absence of the balanced scorecard, management may not know how to increase ROI. Managers often inherit many committed costs over which they have no control. Managers evaluated on ROI may reject profitable investment opportunities.
  • 54.
    McGraw-Hill Education (Asia)Garrison, Noreen, Brewer, Cheng & Yuen Slide 54 Learning Objective 3 Compute residual income and understand its strengths and weaknesses.
  • 55.
    McGraw-Hill Education (Asia)Garrison, Noreen, Brewer, Cheng & Yuen Slide 55 Residual Income - Another Measure of Performance Net operating income above some minimum return on operating assets
  • 56.
    McGraw-Hill Education (Asia)Garrison, Noreen, Brewer, Cheng & Yuen Slide 56 Calculating Residual Income Residual income = Net operating income - Average operating assets  Minimum required rate of return ( ) This computation differs from ROI. ROI measures net operating income earned relative to the investment in average operating assets. Residual income measures net operating income earned less the minimum required return on average operating assets.
  • 57.
    McGraw-Hill Education (Asia)Garrison, Noreen, Brewer, Cheng & Yuen Slide 57 Residual Income – An Example The Retail Division of Zephyr, Inc. has average operating assets of $100,000 and is required to earn a return of 20% on these assets. In the current period, the division earns $30,000. Let’s calculate residual income.
  • 58.
    McGraw-Hill Education (Asia)Garrison, Noreen, Brewer, Cheng & Yuen Slide 58 Residual Income – An Example Operating assets 100,000$ Required rate of return × 20% Minimum required return 20,000$ Actual income 30,000$ Minimum required return (20,000) Residual income 10,000$
  • 59.
    McGraw-Hill Education (Asia)Garrison, Noreen, Brewer, Cheng & Yuen Slide 59 Motivation and Residual Income Residual income encourages managers to make profitable investments that would be rejected by managers using ROI.
  • 60.
    McGraw-Hill Education (Asia)Garrison, Noreen, Brewer, Cheng & Yuen Slide 60 Quick Check  Redmond Awnings, a division of Wrap-up Corp., has a net operating income of $60,000 and average operating assets of $300,000. The required rate of return for the company is 15%. What is the division’s ROI? a. 25% b. 5% c. 15% d. 20%
  • 61.
    McGraw-Hill Education (Asia)Garrison, Noreen, Brewer, Cheng & Yuen Slide 61 Quick Check  Redmond Awnings, a division of Wrap-up Corp., has a net operating income of $60,000 and average operating assets of $300,000. The required rate of return for the company is 15%. What is the division’s ROI? a. 25% b. 5% c. 15% d. 20% ROI = NOI/Average operating assets = $60,000/$300,000 = 20%
  • 62.
    McGraw-Hill Education (Asia)Garrison, Noreen, Brewer, Cheng & Yuen Slide 62 Quick Check  Redmond Awnings, a division of Wrap-up Corp., has a net operating income of $60,000 and average operating assets of $300,000. If the manager of the division is evaluated based on ROI, will she want to make an investment of $100,000 that would generate additional net operating income of $18,000 per year? a. Yes b. No
  • 63.
    McGraw-Hill Education (Asia)Garrison, Noreen, Brewer, Cheng & Yuen Slide 63 Quick Check  Redmond Awnings, a division of Wrap-up Corp., has a net operating income of $60,000 and average operating assets of $300,000. If the manager of the division is evaluated based on ROI, will she want to make an investment of $100,000 that would generate additional net operating income of $18,000 per year? a. Yes b. No ROI = $78,000/$400,000 = 19.5% This lowers the division’s ROI from 20.0% down to 19.5%.
  • 64.
    McGraw-Hill Education (Asia)Garrison, Noreen, Brewer, Cheng & Yuen Slide 64 Quick Check  The company’s required rate of return is 15%. Would the company want the manager of the Redmond Awnings division to make an investment of $100,000 that would generate additional net operating income of $18,000 per year? a. Yes b. No
  • 65.
    McGraw-Hill Education (Asia)Garrison, Noreen, Brewer, Cheng & Yuen Slide 65 Quick Check  The company’s required rate of return is 15%. Would the company want the manager of the Redmond Awnings division to make an investment of $100,000 that would generate additional net operating income of $18,000 per year? a. Yes b. No ROI = $18,000/$100,000 = 18% The return on the investment exceeds the minimum required rate of return.
  • 66.
    McGraw-Hill Education (Asia)Garrison, Noreen, Brewer, Cheng & Yuen Slide 66 Quick Check  Redmond Awnings, a division of Wrap-up Corp., has a net operating income of $60,000 and average operating assets of $300,000. The required rate of return for the company is 15%. What is the division’s residual income? a. $240,000 b. $ 45,000 c. $ 15,000 d. $ 51,000
  • 67.
    McGraw-Hill Education (Asia)Garrison, Noreen, Brewer, Cheng & Yuen Slide 67 Quick Check  Redmond Awnings, a division of Wrap-up Corp., has a net operating income of $60,000 and average operating assets of $300,000. The required rate of return for the company is 15%. What is the division’s residual income? a. $240,000 b. $ 45,000 c. $ 15,000 d. $ 51,000 Net operating income $60,000 Required return (15% of $300,000) (45,000) Residual income $15,000
  • 68.
    McGraw-Hill Education (Asia)Garrison, Noreen, Brewer, Cheng & Yuen Slide 68 Quick Check  If the manager of the Redmond Awnings division is evaluated based on residual income, will she want to make an investment of $100,000 that would generate additional net operating income of $18,000 per year? a. Yes b. No
  • 69.
    McGraw-Hill Education (Asia)Garrison, Noreen, Brewer, Cheng & Yuen Slide 69 Quick Check  If the manager of the Redmond Awnings division is evaluated based on residual income, will she want to make an investment of $100,000 that would generate additional net operating income of $18,000 per year? a. Yes b. No Net operating income $78,000 Required return (15% of $400,000) (60,000) Residual income $18,000 Yields an increase of $3,000 in the residual income.
  • 70.
    McGraw-Hill Education (Asia)Garrison, Noreen, Brewer, Cheng & Yuen Slide 70 Divisional Comparisons and Residual Income The residual income approach has one major disadvantage. It cannot be used to compare the performance of divisions of different sizes.
  • 71.
    McGraw-Hill Education (Asia)Garrison, Noreen, Brewer, Cheng & Yuen Slide 71 Zephyr, Inc. - Continued Retail Wholesale Operating assets 100,000$ 1,000,000$ Required rate of return × 20% 20% Minimum required return 20,000$ 200,000$ Retail Wholesale Actual income 30,000$ 220,000$ Minimum required return (20,000) (200,000) Residual income 10,000$ 20,000$ Recall the following information for the Retail Division of Zephyr, Inc. Assume the following information for the Wholesale Division of Zephyr, Inc.
  • 72.
    McGraw-Hill Education (Asia)Garrison, Noreen, Brewer, Cheng & Yuen Slide 72 Zephyr, Inc. - Continued Retail Wholesale Operating assets 100,000$ 1,000,000$ Required rate of return × 20% 20% Minimum required return 20,000$ 200,000$ Retail Wholesale Actual income 30,000$ 220,000$ Minimum required return (20,000) (200,000) Residual income 10,000$ 20,000$ The residual income numbers suggest that the Wholesale Division outperformed the Retail Division because its residual income is $10,000 higher. However, the Retail Division earned an ROI of 30% compared to an ROI of 22% for the Wholesale Division. The Wholesale Division’s residual income is larger than the Retail Division simply because it is a bigger division.
  • 73.
    McGraw-Hill Education (Asia)Garrison, Noreen, Brewer, Cheng & Yuen Slide 73 Learning Objective 4 Understand how to construct and use a balanced scorecard.
  • 74.
    McGraw-Hill Education (Asia)Garrison, Noreen, Brewer, Cheng & Yuen Slide 74 The Balanced Scorecard Management translates its strategy into performance measures that employees understand and influence. Performance measures Customers Learning and growth Internal business processes Financial
  • 75.
    McGraw-Hill Education (Asia)Garrison, Noreen, Brewer, Cheng & Yuen Slide 75 The Balanced Scorecard: From Strategy to Performance Measures Financial Has our financial performance improved? Customer Do customers recognize that we are delivering more value? Internal Business Processes Have we improved key business processes so that we can deliver more value to customers? Learning and Growth Are we maintaining our ability to change and improve? Performance Measures What are our financial goals? What customers do we want to serve and how are we going to win and retain them? What internal busi- ness processes are critical to providing value to customers? Vision and Strategy
  • 76.
    McGraw-Hill Education (Asia)Garrison, Noreen, Brewer, Cheng & Yuen Slide 76 The Balanced Scorecard: Non-financial Measures The balanced scorecard relies on non-financial measures in addition to financial measures for two reasons:  Financial measures are lag indicators that summarize the results of past actions. Non-financial measures are leading indicators of future financial performance.  Top managers are ordinarily responsible for financial performance measures – not lower level managers. Non-financial measures are more likely to be understood and controlled by lower level managers.
  • 77.
    McGraw-Hill Education (Asia)Garrison, Noreen, Brewer, Cheng & Yuen Slide 77 The Balanced Scorecard for Individuals A personal scorecard should contain measures that can be influenced by the individual being evaluated and that support the measures in the overall balanced scorecard. The entire organization should have an overall balanced scorecard. Each individual should have a personal balanced scorecard.
  • 78.
    McGraw-Hill Education (Asia)Garrison, Noreen, Brewer, Cheng & Yuen Slide 78 The balanced scorecard lays out concrete actions to attain desired outcomes. A balanced scorecard should have measures that are linked together on a cause-and-effect basis. If we improve one performance measure . . . Another desired performance measure will improve. The Balanced Scorecard Then
  • 79.
    McGraw-Hill Education (Asia)Garrison, Noreen, Brewer, Cheng & Yuen Slide 79 The Balanced Scorecard and Compensation Incentive compensation should be linked to balanced scorecard performance measures.
  • 80.
    McGraw-Hill Education (Asia)Garrison, Noreen, Brewer, Cheng & Yuen Slide 80 Employee skills in installing options Number of options available Time to install option Customer satisfaction with options Number of cars sold Contribution per car Profit Learning and Growth Internal Business Processes Customer Financial The Balanced Scorecard ─ Jaguar Example
  • 81.
    McGraw-Hill Education (Asia)Garrison, Noreen, Brewer, Cheng & Yuen Slide 81 Employee skills in installing options Number of options available Time to install option Customer satisfaction with options Number of cars sold Contribution per car Profit Increase Options Time Decreases Strategies Satisfaction Increases Increase Skills Results The Balanced Scorecard ─ Jaguar Example
  • 82.
    McGraw-Hill Education (Asia)Garrison, Noreen, Brewer, Cheng & Yuen Slide 82 Employee skills in installing options Number of options available Time to install option Customer satisfaction with options Number of cars sold Contribution per car Profit Satisfaction Increases Results Cars sold Increase The Balanced Scorecard ─ Jaguar Example
  • 83.
    McGraw-Hill Education (Asia)Garrison, Noreen, Brewer, Cheng & Yuen Slide 83 Employee skills in installing options Number of options available Time to install option Customer satisfaction with options Number of cars sold Contribution per car Profit Results Time Decreases Contribution Increases Satisfaction Increases The Balanced Scorecard ─ Jaguar Example
  • 84.
    McGraw-Hill Education (Asia)Garrison, Noreen, Brewer, Cheng & Yuen Slide 84 The Balanced Scorecard ─ Jaguar Example Employee skills in installing options Number of options available Time to install option Customer satisfaction with options Number of cars sold Contribution per car Profit Results Contribution Increases Profits Increase If number of cars sold and contribution per car increase, profits increase. Cars Sold Increases
  • 85.
    McGraw-Hill Education (Asia)Garrison, Noreen, Brewer, Cheng & Yuen Slide 85 Key Performance Indicators for a Balanced Scorecard Key performance indicators (KPIs) should address •Missions and Vision of the organization •Management principles and objectives (i.e. Execution of strategy) •Critical success factors of the organization and operations •Key objectives of the subsidiary/division/department/employee •Balance of lead and lag measures (i.e. measures that lead to future success and measures that reflect historical performance) Number of KPI s should be kept at a controllable number.
  • 86.
    McGraw-Hill Education (Asia)Garrison, Noreen, Brewer, Cheng & Yuen Slide 86 Summary of the Measures and Their Purposes Financial Customer Internal Business Process Learning & Growth Performance Measures F1 F2 C1 C2 IBP1 IBP2 LG1 LG2 Objectives / Critical Success Factors Missions &Vision Employee Satisfaction **   Customer Satisfaction **   Management Principles Innovative Products **   Profitable Growth  Focus on delivery of quality products to valued customers   Responsibilities to Society      Critical Factors Quality   Response Time  Cost     Division’s Objective Sales Growth **   ** = Also a critical success factor F1 = residual income (or EVATM ) Improvement IBP1 = production defect rate F2 = sales growth IBP2 = percentage goods returned to sales C1 = turnover percentage from key customers LG1 = employee productivity C2 = percentage of delivery accuracy LG2 = employee satisfaction index
  • 87.
    McGraw-Hill Education (Asia)Garrison, Noreen, Brewer, Cheng & Yuen Slide 87 A Balanced Scorecard Example for a Business Division of a Media Product Manufacturer Measures Targets Review Frequency Objectives Financial F1 EVA improvement This year’s EVA– Previous year′ s EVA Previous year′ s EVA 15% Annually Profitability and effective use of funds F2 Sales growth This year’s sales dollar – Previous year′ sales dollar Previous year′ sales dollar 15% Annually Sales growth Customer C1 Turnover percentage from key customers Loss of number of customers with annual revenue of more than $10m. 0% Frequently (Minimum Quarterly)  Quality of products and services  Customer satisfaction  Sales and marketing effort C2 Delivery accuracy On-time delivery per order 100% Frequently (Minimum Quarterly)  Customer satisfaction  Coordinating effort Internal Business Process IBP1 Defects per million units Defects per million units 3 Monthly  Quality  Cost IBP2 Percentage of goods returned Actual sales value of goods returned Sales value before goods returns 0.3% Monthly  Production quality  On time delivery Learning and Growth LG1 Employee productivity Sales dollar per man-hour $300 per man-hour Annually  Employee training and productivity  Employee satisfaction LG2 Employee satisfaction index Survey’s index score Index score 85 Six months Employee satisfaction Strategic Linkage between measures and perspectives
  • 88.
    © 2012 McGraw-HillEducation (Asia) Transfer Pricing Appendix 13A
  • 89.
    McGraw-Hill Education (Asia)Garrison, Noreen, Brewer, Cheng & Yuen Slide 89 Key Concepts/Definitions A transfer price is the price charged when one segment of a company provides goods or services to another segment of the company. The fundamental objective in setting transfer prices is to motivate managers to act in the best interests of the overall company.
  • 90.
    McGraw-Hill Education (Asia)Garrison, Noreen, Brewer, Cheng & Yuen Slide 90 Three Primary Approaches There are three primary approaches to setting transfer prices: 1. Negotiated transfer prices; 2. Transfers at the cost to the selling division; and 3. Transfers at market price.
  • 91.
    McGraw-Hill Education (Asia)Garrison, Noreen, Brewer, Cheng & Yuen Slide 91 Learning Objective 5 Determine the range, if any, within which a negotiated transfer price should fall.
  • 92.
    McGraw-Hill Education (Asia)Garrison, Noreen, Brewer, Cheng & Yuen Slide 92 Negotiated Transfer Prices A negotiated transfer price results from discussions between the selling and buying divisions. Advantages of negotiated transfer prices: 1. They preserve the autonomy of the divisions, which is consistent with the spirit of decentralization. 2. The managers negotiating the transfer price are likely to have much better information about the potential costs and benefits of the transfer than others in the company. Upper limit is determined by the buying division. Lower limit is determined by the selling division. Range of Acceptable Transfer Prices
  • 93.
    McGraw-Hill Education (Asia)Garrison, Noreen, Brewer, Cheng & Yuen Slide 93 Grocery Storehouse – An Example West Coast Plantations: Naval orange harvest capactiy per month 10,000 crates Variable cost per crate of naval oranges 10$ per crate Fixed costs per month 100,000$ Selling price of navel oranges on the outside market 25$ per crate Grocery Mart: Purchase price of current naval oranges 20$ per crate Monthly sales of naval oranges 1,000 crates Assume the information as shown with respect to West Coast Plantations and Grocery Mart (both companies are owned by Grocery Storehouse).
  • 94.
    McGraw-Hill Education (Asia)Garrison, Noreen, Brewer, Cheng & Yuen Slide 94 Grocery Storehouse – An Example The selling division’s (West Coast Plantations) lowest acceptable transfer price is calculated as: Variable cost Total contribution margin on lost sales per unit Number of units transferred Transfer Price  + Transfer Price  Cost of buying from outside supplier The buying division’s (Grocery Mart) highest acceptable transfer price is calculated as: Let’s calculate the lowest and highest acceptable transfer prices under three scenarios. Transfer Price  Profit to be earned per unit sold (not including the transfer price) If an outside supplier does not exist, the highest acceptable transfer price is calculated as:
  • 95.
    McGraw-Hill Education (Asia)Garrison, Noreen, Brewer, Cheng & Yuen Slide 95 Grocery Storehouse – An Example If West Coast Plantations has sufficient idle capacity (3,000 crates) to satisfy Grocery Mart’s demands (1,000 crates), without sacrificing sales to other customers, then the lowest and highest possible transfer prices are computed as follows: -$ 1,000 = 10$Transfer Price  +10$ Selling division’s lowest possible transfer price: Transfer Price  Cost of buying from outside supplier = 20$ Buying division’s highest possible transfer price: Therefore, the range of acceptable transfer prices is $10 – $20.
  • 96.
    McGraw-Hill Education (Asia)Garrison, Noreen, Brewer, Cheng & Yuen Slide 96 Grocery Storehouse – An Example If West Coast Plantations has no idle capacity (0 crates) and must sacrifice other customer orders (1,000 crates) to meet Grocery Mart’s demands (1,000 crates), then the lowest and highest possible transfer prices are computed as follows: ( $25 - $10) × 1,000 1,000 = 25$Transfer Price  +10$ Selling division’s lowest possible transfer price: Transfer Price  Cost of buying from outside supplier = 20$ Buying division’s highest possible transfer price: Therefore, there is no range of acceptable transfer prices.
  • 97.
    McGraw-Hill Education (Asia)Garrison, Noreen, Brewer, Cheng & Yuen Slide 97 Grocery Storehouse – An Example If West Coast Plantations has some idle capacity (500 crates) and must sacrifice other customer orders (500 crates) to meet Grocery Mart’s demands (1,000 crates), then the lowest and highest possible transfer prices are computed as follows: Transfer Price  Cost of buying from outside supplier = 20$ Buying division’s highest possible transfer price: Therefore, the range of acceptable transfer prices is $17.50 – $20.00. Selling division’s lowest possible transfer price: ( $25 - $10) × 500 1,000 = 17.50$Transfer Price  +10$
  • 98.
    McGraw-Hill Education (Asia)Garrison, Noreen, Brewer, Cheng & Yuen Slide 98 Evaluation of Negotiated Transfer Prices If a transfer within a company would result in higher overall profits for the company, there is always a range of transfer prices within which both the selling and buying divisions would have higher profits if they agree to the transfer. If managers are pitted against each other rather than against their past performance or reasonable benchmarks, a noncooperative atmosphere is almost guaranteed. Given the disputes that often accompany the negotiation process, most companies rely on some other means of setting transfer prices.
  • 99.
    McGraw-Hill Education (Asia)Garrison, Noreen, Brewer, Cheng & Yuen Slide 99 Transfers at the Cost to the Selling Division Many companies set transfer prices at either the variable cost or full (absorption) cost incurred by the selling division. Drawbacks of this approach include: 1. Using full cost as a transfer price can lead to suboptimization. 2. The selling division will never show a profit on any internal transfer. 3. Cost-based transfer prices do not provide incentives to control costs.
  • 100.
    McGraw-Hill Education (Asia)Garrison, Noreen, Brewer, Cheng & Yuen Slide 100 Transfers at Market Price A market price (i.e., the price charged for an item on the open market) is often regarded as the best approach to the transfer pricing problem. 1. A market price approach works best when the product or service is sold in its present form to outside customers and the selling division has no idle capacity. 2. A market price approach does not work well when the selling division has idle capacity.
  • 101.
    McGraw-Hill Education (Asia)Garrison, Noreen, Brewer, Cheng & Yuen Slide 101 Divisional Autonomy and Suboptimization The principles of decentralization suggest that companies should grant managers autonomy to set transfer prices and to decide whether to sell internally or externally, even if this may occasionally result in suboptimal decisions. This way top management allows subordinates to control their own destiny.
  • 102.
    McGraw-Hill Education (Asia)Garrison, Noreen, Brewer, Cheng & Yuen Slide 102 End of Chapter 13