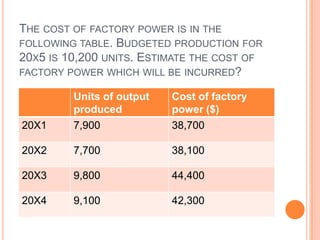
Based on the historical data provided, I would estimate the cost of factory power for 10,200 units of output in 20X5 using the scatter graph method as follows:
1. Plot the units of output and cost of factory power for each year on a scatter graph
2. Draw a best fit line through the data points
3. Use the best fit line to estimate the cost of factory power for 10,200 units of output
This would provide a more accurate estimate than simply selecting a single data point, by utilizing the trend in the relationship between units of output and factory power costs. Of course, the estimate would still involve some subjective judgement in drawing the best fit line.