1. CHAPTER III
RESEARCH METHOD
A. Objective of the Study
The objective of the study as follows:
To find out the effectiveness of using mind-mapping to improve students’
understanding on modal in the eight grade students of SMP NU 05 Awwalul
Hidayah Gemuh Kab. Kendal.
B. Setting of the Study
The writer did research at SMP NU 05 Awwalul Hidayah Gemuh Kab.
Kendal. He conducted this research from 12th
of Augustus 2009 to 11th
of
September 2009.
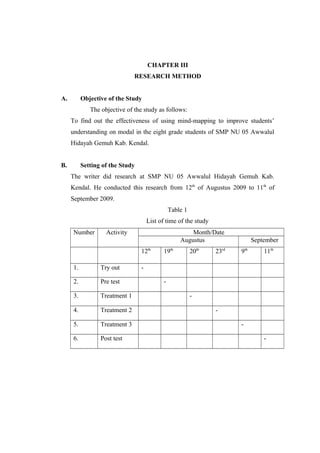
Table 1
List of time of the study
Number Activity Month/Date
Augustus September
12th
19th
20th
23rd
9th
11th
1. Try out -
2. Pre test -
3. Treatment 1 -
4. Treatment 2 -
5. Treatment 3 -
6. Post test -
2. C. Variable of the Research
Variable is the object of research or something that become the
concern of research.1
In this study there are two variables. They are
Independent Variable (x) and Dependent Variable (y).
1. Independent Variable (x)
Independent variable is variable that influences or those to be cause
of change or emergence the dependent variable.2
Independent variable in this research is the use of mind-mapping in
teaching modal.
2. Dependent Variable (y)
Dependent variable is variable that was affected or that be the
result because of the existence of the independent variable.3
Dependent variable in this study is the students’ score of grammar test.
D. Research Method
In this research, the writer conducted an experimental study. An
experimental is “defined as a situation in which one observes the relationship
between two variables by deliberately producing a change in one and looking
to see whether this alteration produces a change in the other (Anderson
1969)”.4
In other words, experiment is the way to find the causal relationship
between two factors which are raised by the researcher in purpose by reducing
or eliminating any distracting factors.
The subjects of this research were divided into two groups:
experimental class which were taught using mind-mapping and control class
which were taught using non-mind-mapping.
In this study, the approach used by writer was quantitative approach. It
is quantitative because the data that was gained were numeric and was
analyzed by using statistical computation. Quantitative approach stressed the
1
Suharsimi Arikunto, Prosedur Penelitian: Suatu Pendekatan Praktik, (Jakarta: PT
Rineka Cipta, 2006), 13th
Ed., p. 118.
2
Mohammad Ali, Strategi Penelitian Pendidikan, (Bandung: Angkasa, 1993), 10th
Ed, p.
26
3
Ibid, p.
4
Rodgers and Brown, Doing Second Language Research, (Cambridge: Oxford Press
2002), p. 211.
3. analysis to the numerical data that is processed by statistical method.5
It will
explain the result of pre - test and post – test.
E. Population and Sample
1. Population
Population is “the whole subject of research”.6
Population of this
research is the second year students of SMP NU 05 Awwalul Hidayah
Gemuh in academic year 2009/2010. The second year Students of SMP
NU 05 Awwalul Hidayah Gemuh is divided into two classes. There are
class VIII A and VIII B. There are 59 students in each class. The total
number of the population is 118 students.
Table 2
List of population
Class Male Female Total
VIII A 33 26 59
VIII B 33 26 59
Total 66 52 118
2. Sample
Sample is taking of a part population using certain procedure. So,
that can be expected to represent its population. In this connection,
Arikunto states that sample is “a part of research population”7
The writer
took sample in this research because the respondents are more than 100.
The respondents are less than 100, it is better to take them all as sample.8
Sample in this research is class VIII A is as experimental class;
VIII B is as control class.
F. Technique of Data Collection
5
M. Burhan Bungin, Metodologi Penelitian Kuantitatif : Komunikasi, Ekonomi dan
Kebijakan Publik Serta Ilmu-Ilmu Social Lainnya (Jakarta: Kencana, 2006), p. 50.
6
Suharsimi Arikunto, op.cit, p. 130.
7
Sutrisno Hadi, Statistik (Yogyakarta: Andi, 2004) 2 nd Vol, 2 nd Ed, p. 182.
8
Suharsimi Arikunto, op cit, p. 134.
4. Instrument that are used to collect the date as follows:
1. Test
Test is a question which is used to measure competence, knowledge,
intelligence, and ability of talent which is possessed by individual or group to
collect data.9
In this research, the test was given to tryout class, control class
and experimental class.
The instrument of the test in this research is objective test. Objective test is
frequently criticized on the grounds that they are simpler to answer than
subjective test. Objective tests are divided into transformation, completion,
combination, addition, rearrangement, matching, correct and incorrect
(true/false) and multiple choice.10
The writer used multiple choice forms and
matching items form. The choice of the test type is based on the consideration
that multiple choice test are:
a. The technique of scoring is easy.
b. It was easy to compute and determine the reliability of the test.
c. It was more practical for the students to answer
In this research, the writer used pre test and post test, they are:
a. Pre-test
Before the teacher taught new material by using mind-
mapping, the teacher gave grammar test to the students. Pre-test was
given to the experimental and control classes in same way. This test
was given before the experiment was run.
b. Post-test
Post-test was given to the experiment class and control class. It
was given in order to know the score of students’ achievement after
they were taught using mind-mapping (experimental class) and without
using mind-mapping (control class).
9
M. Chabib Thoha, Teknik Evaluasi Pendidikan (Jakarta: PT Raja Grafindo Persada, 2001),
p. 43.
10
J.B Heaton, Writing English Language Tests (London: Longman, 1975), p. 12-13.
5. The score of students’ achievement can be calculated by using
this following formula:11
%100x
questionsofnumberThe
answerrigthofnumberThe
Score =
G. Technique of Data Analysis
1. Try-out instrument of the test
The writer prepared 30 items as the instrument of the test. Before
the items were given to the students, the writer gave tryout test to analyze
validity, reliability, difficulty level and also the discrimination power of
each item. The tryout was given to VIII A of the students of MTs NU 08
Gemuh. After finishing the test, the answer sheets were collected in order
to be scored. An analysis was made based on the result of test by using the
formula of validity, reliability, the degree of test difficulty and
discriminating power.
From 30 items test of tryout, some items were chosen as the
instrument of the test. The choosing of the instrument had been done by
considering: validity, reliability, the degree of test difficulty and
discriminating power.
a. The Validity
The validity is an important quality of any test. It is a condition
in which a test can measure what is supposed to be measured.
According to Arikunto, a test is valid if it measures what it purpose to
be measured.12
Is measurement that shows the validity of instrument? The
validity of an item can be known by doing item analysis. It is counted
using product – moment correlation formula:
( ) ( )
( ){ } ( ){ }∑ ∑∑∑
∑∑∑
−−
−
=
2222
YYNXXN
YXXYN
rxy
rxy : The correlation coefficient between X variable and Y variable
11
Suharsimi arikunto, op, cit., p. 235.
12
Suharsimi Arikunto, op cit, p. 65.
6. N : The number of students
X : The number of each item score
Y : The number of total score
Calculation result of rxy is compared with r table of product
moment by 5% degree of significance. If rxy is higher than r table , the
item of question is valid.13
b. Reliability
It means “consistent”.14
Reliability refers to the consistency of
test scores. Besides having high validity, a good test should have high
reliability too. Alpha formula is used to know reliability of test is
K - R. 20.
−
−
=
∑
211
1 S
pqS
n
n
r
Where:
r11 : The reliability coefficient of items
n : The number of item in the test
P : The proportion of students who give the right answer
q : The proportion of students who give the wrong answer
2
S : The standard deviation of the test
Calculation result of r 11 is compared with r table of product
moment by 5% degree of significance. If r 11 is higher than r table , the
item of question is reliable.15
c. Degree of Test Difficulty
A good question is a question that is not really difficult and not
really easy. Formula for degree of test difficulty is.
JS
B
P =
Where:
13
Suharsimi Arikunto, Dasar-Dasar Evaluasi Pendidikan (Jakarta: Bumi Aksara, 2007)
7th
Ed, p. 78.
14
J.B. Heaton, op cit, p. 155.
15
Suharsimi Arikunto, op cit., p. 100.
7. P : The difficulty’s index
B : The Number of students who has right answer
JS : The number of students16
The criteria are:
P = 0,00 30,0≤≤ p Difficult question
P= 0,30 70,0≤≤ p Sufficient
P= 0,70 00,1≤≤ p Easy.
d. Discriminating Power
It is used to know how accurate the question differ higher
subject and lower subject. The formula for discriminating power is
Split Half:
BA
B
B
A
A
PP
J
B
J
B
D −=−=
Where:
D : The degree of question distinctive
JA : The number of participant the upper group
JB : The number of participant in the lower group
BA : The number of participants in the upper group who answered the
item correctly
BB : The number of participants in the lower group who answered the
item correctly
PA : The proportion of participants in upper group that answered true
PB : The proportion of participants in lower group that answered
true.17
The criteria are:
0,00 20,0≤≤ p Less
0,20 40,0≤≤ p Enough
0,40 70,0≤≤ p Good
0,70 00,1≤≤ p Excellent
2. Pre-request Test
16
Ibid, p. 207-208.
17
Ibid., p. 213.
8. Before the writer determines the statistical analysis technique used,
He examined the normality and homogeneity test of the data.
a. Normality Test
It is used to know the normality of the data that is going to be
analyzed whether both groups have normal distribution or not. The
normality test with Chi-square is done to find out the distribution data.
Step by step Chi-square test is as follows:
1) Determine the range (R); the largest data reduced the
smallest.
2) Determine the many class interval (K) with formula:
K = 1+ (3,3) log n
3) Determine the length of the class, using the formula:
P = classofnumber
range
4) Make a frequency distribution table
5) Determines the class boundaries (bc) of each class
interval
6) Calculating the average Xi ( X ), with the formula:
X =
∑
∑
i
ii
f
xf
7) Calculate variants, with the formula:
1
)( 2
−
−
=
∑
n
xxf
S
ii
8) Calculate the value of Z, with the formula:
Z =
s
xx −
x = limit class
x = Average
S = Standard deviation
9) Define the wide area of each interval
10) Calculate the frequency expository (Ei), with formula:
9. Ei = n x wide area with the n number of sample
11) Make a list of the frequency of observation (Oi), with the
frequency expository as follows:
class bc Z P L Ei
Ei
EiOi −
12) Calculate the chi-square ( 2
X ), with the formula:
( )
∑=
−
=
k
i i
ii
E
EO
X
1
2
2
13) Determine dk = k-3, where k is the number of class
intervals and α = 5%
14) Determining the value of 2
X table
15) Determining the distribution normality with test criteria:
If countX 2
> tableX 2
, the data is not normal distribution and the
other way if the countX 2
< tableX 2
, the data is normal distribution. 18
b. Homogeneity Test
Is used to know whether experiment class and control class,
that are taken from population have same variant or not. According to
Nunan, a test should be given to both classes of students before the
experiment just to make sure that the both classes really are the same.19
The steps as follows:
1) Calculate variants both classes (experimental and control
classes), with the formula:
1
)(
1
2
2
1
−
−
=
∑
n
xx
S And
1
)(
2
2
2
2
−
−
=
∑
n
xx
S
2) Determine
Vk
Vb
F =
18
Sudjana, Metode Statistika, (Bandung: Tarsito, 1996), p. 273.
19
David Nunan, Research Method in Language Learning (Cambridge: University Press,
1992) p. 27.
10. Where:
Vb : Bigger Varian
Vk : Smaller Varian
Determine dk = ( 11 −n ) : ( 12 −n )
3) Determine tableF with α = 5%
4) Determining the distribution homogeneity with test criteria:
If countF > tableF , the data is not homogeneous and the other
way if the countF < tableF , the data is homogeneous.20
c. Test of the Average
It is used to examine average whether experiment group and
control group have been decided having different average. 21
T-test is used to analyze the data of this research. A t-test would
be the measure you would use to compare the mean scores of the two
groups.22
If σ1
2
= σ2
2
(has same variant), the formula is:
21
21
11
nn
S
XX
t
+
−
=
With
2
)1()1(
21
2
22
2
11
−+
−+−
=
nn
SnSn
S
Where:
1X : The mean score of the experimental group
2X : The mean of the control group
n1 : The number of experiment group
n2 : The number of control group
S1
2
: The standard deviation of experiment group
20
Sudjana, op cit, p. 250.
21
Anas Sudijono, Pengantar Statistik Pendidikan (Jakarta: PT. Raja Grafindo Persada,
1995) 6th
Ed, p. 264.
22
Rodgers and Brown, op cit, p. 205.
11. S2
2
: The standard deviation of both groups
If = σ1
2
≠ σ2
2
(has no same variant) the formula is:
2
2
1
1
2
1
21
n
S
n
S
XX
t
+
−
=
The hypotheses are:
Ho = µ1 = µ2
Ha = µ1 ≠ µ2
µ1 : average data of experiment group
µ2 : average data of control group
Criteria test is: Ho is accepted if ( ) ( )αα 2
11
2
11 −−
<<− ttt , where
( )α2
11−
t obtained from the distribution list t with ( )221 −+= nndk and
opportunities ( )α
2
11− . Values for other t Ho rejected.23
3. Analysis Phase End
a. Normality Test
Steps normality second step is the same as the normality test on the
initial data.
b. Homogeneity Test
Steps homogeneity second step is the same as the homogeneity test on
the initial data.
c. Test Average (Right-hand Test)
Proposed hypothesis test in average similarity with the right test is as
follows:
Ho = µ1 = µ2
Ha = µ1 > µ2
If σ1
2
= σ2
2
(has same variant), the formula is:
23
Sudjana., op.cit p. 239.
12. 21
21
11
nn
S
XX
t
+
−
=
With
2
)1()1(
21
2
22
2
11
−+
−+−
=
nn
SnSn
S
Where:
1X : The mean score of the experimental group
2X : The mean of the control group
n1 : The number of experiment group
n2 : The number of control group
S1
2
: The standard deviation of experiment group
S2
2
: The standard deviation of both groups
If = σ1
2
≠ σ2
2
(has no same variant) the formula is:
2
2
1
1
2
1
21
n
S
n
S
XX
t
+
−
=
Testing criteria that apply Ho is accepted if countt > tablet with
determine dk = ( 1n + 2n - 2) and α = 5% with opportunities (1 - α
)
Values for other t Ho rejected.24
24
Sudjana, op cit, p. 243.