
Recommended
Recommended
More Related Content
What's hot
What's hot (20)
Similar to Chapter iii
Similar to Chapter iii (20)
Recently uploaded
Recently uploaded (20)
Chapter iii
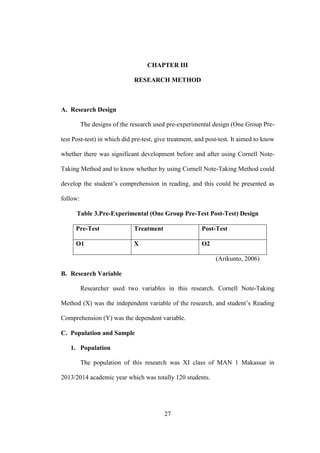
- 1. 27 CHAPTER III RESEARCH METHOD A. Research Design The designs of the research used pre-experimental design (One Group Pre-test Post-test) in which did pre-test, give treatment, and post-test. It aimed to know whether there was significant development before and after using Cornell Note- Taking Method and to know whether by using Cornell Note-Taking Method could develop the student’s comprehension in reading, and this could be presented as follow: Table 3.Pre-Experimental (One Group Pre-Test Post-Test) Design Pre-Test Treatment Post-Test O1 X O2 (Arikunto, 2006) B. Research Variable Researcher used two variables in this research. Cornell Note-Taking Method (X) was the independent variable of the research, and student’s Reading Comprehension (Y) was the dependent variable. C. Population and Sample 1. Population The population of this research was XI class of MAN 1 Makassar in 2013/2014 academic year which was totally 120 students. 27
- 2. 28 Table 4.Number of Population CLASS POPULATION XI IPA 1 20 XI IPA 2 19 XI IPS 1 17 XI IPS 2 21 XI AGAMA 1 23 XI AGAMA 2 20 TOTAL 120 (Tata Usaha MAN 1 Makassar) 2. Sample The sample represented the whole population in this research. So, this research used a purposive sampling that took XI IPA 1 class. D. Research Instrument The instrument of this research was test (Multiple Choice). The test identified the student’s achievement in using Cornell Note-Taking Method to develop Reading Comprehension. From this test the Researcher got information about the student’s Reading Comprehension and found the weakness after giving treatment. Trough this test the researcher identified an error made by the students in reading based on Cornell Note-Taking method. E. Data Collection In collecting data, the researcher used some procedures as follows:
- 3. 29 1. Pre-test The researcher gave test to the sample before applying Cornell Note- Taking Method as a pre-test to measure the prior knowledge of the students. 2. Treatment In giving treatment, the researcher carried out the class meeting. The ways of the researcher in presenting the materials in the classroom interaction were as follows: a. The researcher explained and applied Cornell Note-Taking Method in teaching Reading Comprehension. b. The researcher gave examples and asked the students to use Cornell Note- Taking Method after Reading. c. The researcher gave exercises. d. The researcher checked their work and gave feedback. 3. Post-test After giving the treatment, the students were given a Post-Test and the researcher distributed the post-test to the sample. 4. Comparing the result between pre-test and post-test. The comparison between pre-test and post-test were used to know whether using Cornell Note-Taking method was effective to develop the student’s comprehension in reading. F. Technique of Data Analysis In analyzing data collected through the pre-test and post-test. The researcher analyzed by using the following procedures:
- 4. 30 1. In giving score, the researcher used the formula: ' 10 students correct answer score x total number of items (Sudjana: 1982) 2. Classifying the student’s score based on the score standard of evaluation in the following: NO SCORE CLASSIFICATION 1 9,6 – 10 Excellent 2 8,6 – 9,5 Very Good 3 7,6 – 8,5 Good 4 6,6 – 7,5 Fairly Good 5 5,6 – 6,5 Fair 6 3,6 – 5,5 Poor 7 0 – 3,5 Very Poor (Depdikbud in Muhalim, 2010) 3. Calculating the mean score of the students’ answer by using the following formula: X X N Where: X = mean score X = the sum of all scores N= the total number of students (Gay, 1981) 4. To find out the standard deviation, the researcher used following formula:
- 5. 31 Sd = x x ( ) 1 2 n Where : Sd = Standard deviation n = Number of students tested Σ = Sum Total The value was consulted to the standardization of coefficient reliability. Where: NO COEFFICIENT CLASSIFICATION 1 (+0.90) – (+1.00) Excellent Reliability 2 (+0.85) – (+0.89) Very Good Reliability 3 (+0.80) – (+0.84) Good Reliability 4 (+0.70) – (+0.79) Fair Reliability 5 Less than (+0.70) Poor Reliability (Soehartono, 1998) 5. Then, to know the significant difference between the score of the pre-test and post –test, the researcher calculated the value of the test by using the following formula: t = D ( 1) 2 2 N N N D D D = mean score
- 6. 32 D = the sum of all the scores N = the total number of students t = test of significance (Gay: 1981)