Download to read offline
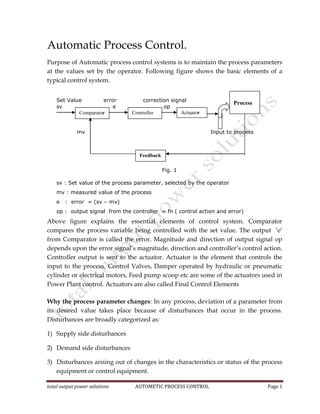
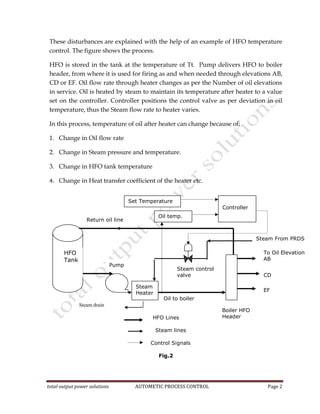
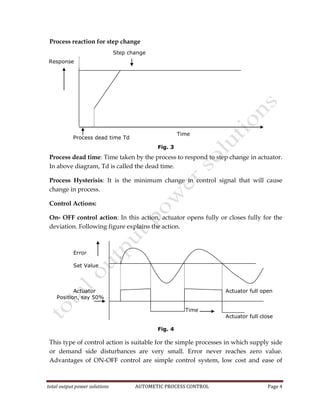
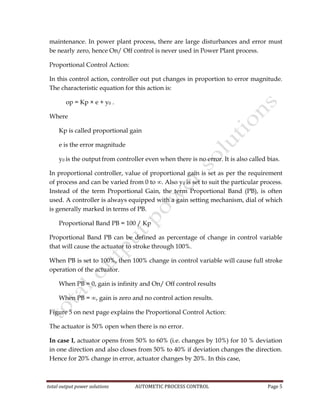
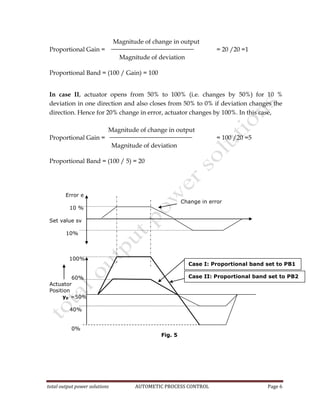
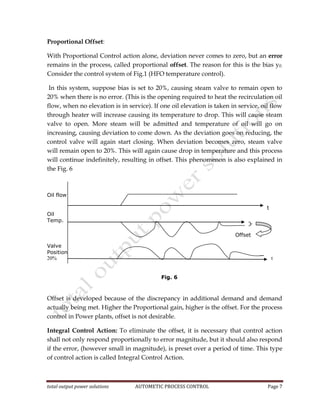

The document discusses automatic process control systems, focusing on maintaining process parameters through various control actions. It outlines the essential elements of a control system, including set value, error, and actuator, and describes types of disturbances affecting process parameters. The document further details different control actions such as on-off, proportional, integral, and derivative control, emphasizing the need for proper tuning to ensure optimal performance in power plant processes.