The document discusses advancements in the automatic home-based screening of obstructive sleep apnea (OSA) using electrocardiogram (ECG) and blood oxygen saturation (SpO2) signals. It presents a study where various machine learning methods were employed to achieve over 85% accuracy in OSA detection from limited biological signals. The findings indicate the method's potential for real-time application and its significance in reducing the burden of traditional polysomnography.
![International Journal of Artificial Intelligence & Applications (IJAIA), Vol.12, No.6, November 2021
DOI: 10.5121/ijaia.2021.12605 47
AUTOMATIC HOME-BASED SCREENING
OF OBSTRUCTIVE SLEEP APNEA USING
SINGLE CHANNEL ELECTROCARDIOGRAM
AND SPO2 SIGNALS
Hosna Ghandeharioun
Department of Electrical and Biomedical Engineering,
Khorasan Institute of Higher Education, Mashhad, Iran
ABSTRACT
Obstructive sleep apnea (OSA) is one of the most widespread respiratory diseases today. Complete or
relative breathing cessations due to upper airway subsidence during sleep is OSA. It has confirmed
potential influence on Covid-19 hospitalization and mortality, and is strongly associated with major
comorbidities of severe Covid-19 infection. Un-diagnosed OSA may also lead to a variety of severe
physical and mental side-effects. To score OSA severity, nocturnal sleep monitoring is performed under
defined protocols and standards called polysomnography (PSG). This method is time-consuming,
expensive, and requiring professional sleep technicians. Automatic home-based detection of OSA is
welcome and in great demand. It is a fast and effective way for referring OSA suspects to sleep clinics for
further monitoring. On-line OSA detection also can be a part of a closed-loop automatic control of the
OSA therapeutic/assistive devices. In this paper, several solutions for online OSA detection are introduced
and tested on 155 subjects of three different databases. The best combinational solution uses mutual
information (MI) analysis for selecting out of ECG and SpO2-based features. Several methods of
supervised and unsupervised machine learning are employed to detect apnoeic episodes. To achieve the
best performance, the most successful classifiers in four different ternary combination methods are used.
The proposed configurations exploit limited use of biological signals, have online working scheme, and
exhibit uniform and acceptable performance (over 85%) in all the employed databases. The benefits have
not been gathered all together in the previous published methods.
KEYWORDS
Obstructive Sleep Apnea, Mutual Information, Machine Learning, Classifier Combination, Biomedical
Signal Processing, Home-based Screening.
1. INTRODUCTION
Obstructive sleep apnea (OSA) is the most prevalent sleep-related breathing disorder worldwide
[1]. Occasional episodes of airway lowering during sleep characterizes OSA [4]. If OSA remains
unrecognised, it follows sudden changes in sympathetic neural activity, sleep fragmentations and
pressure/heart-beat fluctuations. These side-effects may cause severe cardiovascular
complications [5], type 2 diabetes [6], and psychiatric symptoms [7]. OSA is also established as a
comorbidity to Covid-19 [2]. People affected by OSA are at risk for severe adverse outcomes of
Covid-19 infection and close monitoring should be performed on them [3]. Hence the immediate
detection and treatment of OSA is crucial. To detect OSA, the simultaneous evaluation of related
clinical features and the visible signs of abnormal breathing during sleep is needed. [8]. The gold
standard for scoring abnormal breathing during sleep is nocturnal polysomnography (PSG). The
PSG-driven apnea-hypopnea index (AHI) identifies the OSA severity [9, 10]. AHI is derived](https://image.slidesharecdn.com/12621ijaia05-211221061105/75/AUTOMATIC-HOME-BASED-SCREENING-OF-OBSTRUCTIVE-SLEEP-APNEA-USING-SINGLE-CHANNEL-ELECTROCARDIOGRAM-AND-SPO2-SIGNALS-1-2048.jpg)
![International Journal of Artificial Intelligence & Applications (IJAIA), Vol.12, No.6, November 2021
48
through visual inspection according to the guidelines of the American Association of Sleep
Medicine (AASM). It imposes a heavy work-load on the public health section [11]. Therefore,
many automatic methods for pre-clinic detection of OSA have been suggested in the literature
[12-28, 32, 33, 35, 36]. Various biological signals and machine learning methods are used. In
some studies, the features of the electroencephalogram (EEG) are extracted from the
inconsistencies between the right and left hemispheres [12] or tracking non-linear dynamics of
EEG due to changes in sleep depth [13, 30, 31]. Single-channel ECG or simultaneous use of ECG
plus saturated oxygen level of the blood in peripheral veins (SpO2) is also suggested in several
studies due to easy signal acquisition and promising results [13, 14, 16-19, 23].
Most recently, OSA is diagnosed by the ECG-derived features and the newly popular deep
learning methods. In deep learning techniques, the features are generally extracted/reduced
during the learning algorithm, and no separate step is needed [32]. This advantage reduces the
computational burden. However, for the training phase, computers with high processing ability
and good data storage capacity are inevitable [33]. These hardware requirements do not suit
home-based and portable applications. Convolutional neural networks (CNN) are also used for
OSA detection based on nasal pressure signals [34]. Several supervised machine learning
methods are suggested for OSA detectionwith a single channel ECG signal in [35]. The achieved
results are satisfactory, yet reported in a small database.
In this study, several configurations for online OSA diagnosis are suggested. Use of one or two
biological signals, automatic and on-line detection, and acceptable performance over several
databases are the advantages of our proposed method, not integrated together in previous works
to the knowledge of the author.
2. MATERIAL AND METHOD
Detection of respiratory events based on biological signals, and with the help of artificial
intelligence is generally divided into several steps in the supervised strategies [28]. First the
signal records are labeled as apnoeic or normal by an expert clinician. In the second step, some
features are extracted from the recorded signals based on mathematical transforms and relations.
Thirdly, a classifier is trained with the features of apnoeic and normal signals and finally if
classifier is trained properly, it can classify newly recorded signals as normal or apnoeic with an
acceptable accuracy.
We conducted this study based on three databases. The first two databases are public: St.
Vincent, University College Dublin (UCD) database [36], eight subjects of Apnea-ECG database
[37] whose data include more signals than one ECG channel. The third database is exclusively at
our disposal and referred as “the Sina database” hereon. This database includes clinical records of
the sleep laboratory of Ibn-e-Sina Hospital, Mashhad, Iran, from July 2012to May 2014. The
study was approved by the ethics committee overlooking the research proposal (permission
no.92/620792, date 2014/03/07). The PSG (model: Alice LE, part no. 1002387, Philips
Respironics) recordings were conducted in baseline montage with16 channels on the 158 referred
patients. Out of all participants, 134 subjects were diagnosed with OSA, and 24 healthy according
to the International Classification of Sleep Disorders II (ICSD-II) [8]. We considered sleep
apneas as ≥10 s of airflow break offs and hypopnea as a ≥3% of oxygen desaturation/or arousal
after a 50% decline in the baseline airflow. Figure 1 shows a view of the polysomnographic
sensor connections and the subject state in one of the Sina database records.](https://image.slidesharecdn.com/12621ijaia05-211221061105/75/AUTOMATIC-HOME-BASED-SCREENING-OF-OBSTRUCTIVE-SLEEP-APNEA-USING-SINGLE-CHANNEL-ELECTROCARDIOGRAM-AND-SPO2-SIGNALS-2-2048.jpg)
![International Journal of Artificial Intelligence & Applications (IJAIA), Vol.12, No.6, November 2021
49
Figure 1. A view of the polysomnographic sensor connections and the subject in one of the Sina database
records.
Electroencephalogram (EEG), Level of saturated oxygen in peripheral veins (SpO2), and air
pressure/flow have a central role in the clinical definition of apnea. We refer to them as “the main
signals”. Other biological signals (e.g. Electrocardiogram, voice) are subsidiary and can act as
“the auxiliary signals”. Relying on the main signals for an OSA detection system is the first
choice; however, the developed system must be more concise than PSG and perform a pre-clinic
screening. Placing EEG electrodes on the scalp during sleep and pressure/flow sensors is rather
obtrusive; besides, preparations and installation of electrodes and sensors are not straightforward
for an ordinary user. For EEG acquisition and conditioning, a relatively expensive system is
needed. The repeatability of the observed effects of OSA on EEG compared to SpO2 signal is
also on debate [38, 39]. That is why generally EEG and air pressure/flow signals are excluded.
Among the auxiliary signals, ECG is gained more attention in the OSA detection methods. The
effects of the apneas on ECG signal are well understood [4]. The ECG electrodes are installed
simpler than EEG and less obtrusive than those of air pressure/flow signal. The apparent effect of
respiratory events on ECG is called Cyclical Variation of Heart Rate (CVHR) [4]. The challenge
of ECG-based detection systems is their lower specificity since their modulating factor is not a
respiratory event only. The presence of cardiovascular problems can also have considerable
effects on ECG. In the absence of OSA, these effects can increase the false positive detection
rate. In practice, the number of false-negative detections also increases, and the sensitivity of the
OSA detection method drops. A decrease in sensitivity is because the database usually includes
subjects with OSA whose problem has been un-diagnosed for years, and lack of treatment has led
to cardiovascular complexities for them [4]. Up to 90% of subjects affected by OSA are not
aware of their problem and have not been treated yet [1].
More successful results are reported for SpO2-based detection methods compared to other single-
channel detection systems. They have reasonable specificity and sensitivity, they can be
performed in real-time, and they have non-obtrusive sensors; additionally, some of them are
realized in smartphones and can serve as useful home-based systems [27, 40].
In this study, we consider PPG(and SpO2) from “the main signals”, and ECG from “the auxiliary
signals”. Paralleluse of these signals, covers their deficienciesand increases the overall accuracy,
sensitivity, and specificity of the detection system [16]. The OSA detection based on ECG and
SpO2 is more popular than other multi-channel detection systems due to simple sensor
installation and powerful representation of respiratory events [13, 14, 16-19, 23].](https://image.slidesharecdn.com/12621ijaia05-211221061105/75/AUTOMATIC-HOME-BASED-SCREENING-OF-OBSTRUCTIVE-SLEEP-APNEA-USING-SINGLE-CHANNEL-ELECTROCARDIOGRAM-AND-SPO2-SIGNALS-3-2048.jpg)
![International Journal of Artificial Intelligence & Applications (IJAIA), Vol.12, No.6, November 2021
50
2.1. Pre-processing and Noise Rejection
Considering the ECG sampling frequency is essential. The insufficient sampling frequency may
negatively affect the resolution and the signal-to-noise ratio of the R-R time series [41, 42]. The
UCD and the Apnea-ECG databases have less sampling frequency than the specified 250Hz
value of the American National Standard Institute (ANSI), yet they are good benchmarks for the
evaluation of automatic OSA detection methods. We have assumed that their subjects are
carefully selected so that exceptions, where their sampling frequencies are insufficient for
representing ECG behavior, are deleted [42]. The ECG signals of the exclusive database are also
down-sampled to 250Hz.
To avoid the aliasing effects of non-integer fractional down-sampling, equating the UCD and the
Apnea-ECG sampling frequencies is avoided [43]. For de-trending and noise rejection, the
decimated lifting wavelet transform (DWT) algorithm [44] is employed [13]. The Daubechies
(D4) wavelet is used with seven levels of decomposition. The R-R time series is extracted by the
famous and robust method of Hamilton-Tompkins [45, 46]. Impulses more or less than 20%
distant to the last normal R-R interval, those with more than 30% values in the R-S difference or
with the negative R-S difference values are assumed to be a sign of ectopic or abnormal beat and
omitted; the resulting signal is called the R-R tachogram [38].
Table 1. The SpO2 features in each 1-minute frame:
2.2. Feature Extraction
We consider values below 50% and fluctuations more than 40% in two consecutive samples of
SpO2 signal (in the sampling period of 1s) artifacts [16, 19]. We eliminate these values and their
corresponding values of other PSG signals from the records (2 minutes of the Apnea-ECG
database, 37 minutes of the UCD database, and 78 minutes of the exclusive database, totally
equal to 1.9% of available data). The resulting signal is divided into non-overlapping 1-minute
frames and is used for feature extraction. Table 1 summarizes the SpO2 features.
Name/ Definition
The minimum value of the frame
The average value of the frame
The standard deviation of the frame
Sequential correlation coefficients [20]
Sequential mutual information [52]
Average value crossing points
The absolute value of the slope of the line fitted over SpO2 [20]
y-Intercept value of the line fitted over SpO2 [20]
Approximate entropy [53]
Sample entropy [53]
Lempel-Zive complexity measure [54]
Central tendency measure ( CTMr) (r=0.25, 0.75, 0.5, 1)[54]
Delta measure () [30]
Baseline [22]
odi2, odi3, odi4: The number of 2%,3%, and 4% desaturations to the baseline [30]
: The number of desaturations more than or equal to x% lasting for y seconds [30]
: The number of desaturations more than or equal to x% [22]
Time elapsed under saturation level x (%tsax ); x=70, 80,85, 90, 95) [30]](https://image.slidesharecdn.com/12621ijaia05-211221061105/75/AUTOMATIC-HOME-BASED-SCREENING-OF-OBSTRUCTIVE-SLEEP-APNEA-USING-SINGLE-CHANNEL-ELECTROCARDIOGRAM-AND-SPO2-SIGNALS-4-2048.jpg)
![International Journal of Artificial Intelligence & Applications (IJAIA), Vol.12, No.6, November 2021
51
We process the ECG signal in 1-minute time windows. The R-R tachogram is extracted from
ECG. It is not a result of uniform ECG sampling. The points of this time series are scattered non-
uniformly across the time axis based on the time interval of consecutive beats. In frequency
analysis of ECG signal, this crucial fact is usually ignored. The pre-assumption of the fast Fourier
transform (FFT) is the uniform sampling of the signal under analysis; hence the FFT-based
frequency analysis of the R-R tachogram and its dependents like the ECG-derived respiration
(EDR) are not appropriate. Frequency analysis tools needless of the uniform sampling
assumption like the Lomb-Scargle periodogram are good candidates for calculating quantities
related to the heart rate variability (HRV) [50].
2.2.1. EDR Extraction
To find the best method for EDR extraction, we have done a quantitive evaluation among all
EDR extraction methods based on single-channel ECG. Figure 2 summarizes all the suggested
EDR extraction methods, based on their approach. Shaded blocks need at least two perpendicular
ECG channels hence, immediately excluded from our choices [150-152].
Figure 2. Categorization of EDR extraction methods; VCG (Vectorcardiogram), SVD (Singular value
decomposition), AR(Auto-regressive) HR (Heart rate), HF (High frequency), HRV (Heart rate variability),
IPFM (Integral pulse frequency modulation), The shaded blocks need at least two perpendicular ECG
channels and are excluded from evaluation.
Due to excessive computational load, and need for off-line processing, approaches that integrate
results of two separate methods (e.g. methods based on joint analysis of EDRs extracted
separately from Hear rate (HR) and ECG signals[150,156]), methods than lie upon modelling
(e.g. auto-regressive [155] or Integral pulse frequency modulation models [167]) or](https://image.slidesharecdn.com/12621ijaia05-211221061105/75/AUTOMATIC-HOME-BASED-SCREENING-OF-OBSTRUCTIVE-SLEEP-APNEA-USING-SINGLE-CHANNEL-ELECTROCARDIOGRAM-AND-SPO2-SIGNALS-5-2048.jpg)
![International Journal of Artificial Intelligence & Applications (IJAIA), Vol.12, No.6, November 2021
52
computationally intensive transforms (e.g. S-transform as a generalization of continuous wavelet
transform [154] or singular value decomposition [153]) are also disregarded. We use approaches
based on morphology of ECG waves [142,150-162]. Base of evaluation is comparing the
dominant frequency of EDR signal and the dominant frequency of the respiratory signal (Oro-
nasal air flow and thoracic and abdominal respiratory effort signals) simultaneously recorded
with ECG. To reach the results, the FFT is performed on the three respiratory signals. The signals
ate truncated into 30 s frames with 24 s overlap. The frequency components of the resulting
periodogram are reported every 6 s and compared with dominant frequency of EDR signal.
EDR is extracted as a time series. To reach its dominant frequency, a 30 s window of the signal is
selected and de-trended. A straight line is fitted over this 30-s window with the least-squares
estimation and the difference is calculated. Then the EDR periodogram is computed by Lomb-
Scargel method and dominant frequency is reported. Overlap of EDR windows is 24 s to have a
new frequency every 6 seconds. The results are reported in table 2.
Table 2. The correlation coefficient between frequencies derived from respiratory signals and extracted
EDRs. Numbers are reported as mean Standard deviation.
Respiration Frequency
EDR Frequency
Abdominal respiratory
effort
Thoracic respiratory
effort
Oro-nasal air flow
Exclu
sive
Data
base
Apne
a-
ECG
UCD
Exclu
sive
Data
base
Apne
a-
ECG
UCD
Exclu
sive
Data
base
Apne
a-
ECG
UCD
0.92
±
0.05
0.89
±
0.05
0.90
±
0.05
0.89
±
0.08
0.85
±
0.08
0.87
±
0.08
0.90
±
0.07
0.81
±
0.07
0.85±
0.07
Area under QRS
complex graph
0.93
±
0.05
0.88
±
0.05
0.90±
0.05
0.88
±
0.07
0.84
±
0.07
0.83
±
0.07
0.90
±
0.09
0.80
±
0.09
0.83 ±
0.09
R-S amplitude
difference
0.90
±
0.06
0.85
±
0.06
0.84
±
0.06
0.85
±
0.08
0.80
±
0.08
0.82
±
0.08
0.88
±
0.07
0.80
±
0.07
0.82 ±
0.07
R wave duration
0.89
±
0.05
0.9±
0.05
0.9±
0.05
0.85
±
0.06
0.89
±
0.06
0.88
±
0.06
0.86
±
0.07
0.9±
0.07
0.89 ±
0.07
T wave
amplitude
0.89±
0.07
0.94
±
0.07
0.95
±
0.05
0.88
±
0.04
0.91±
0.07
0.91
±
0.07
0.89
±
0.05
0.92
±
0.05
0.91 ±
0.05
T wave duration
0.89
±
0.05
0.88
±
0.05
0.86
±
0.05
0.87
±
0.06
0.88
±
0.06
0.85
±
0.06
0.86
±
0.08
0.85±
0.08
0.87 ±
0.08
Band-pass
filtered R-R time
series (0.2Hz-0.4
Hz, realized by
wavelet)
We use the Lomb-Scargle periodogram and the DWT with Daubechies (D4) wavelet (with 18
levels of decomposition) to extract frequency-domain features of the R-R tachogram, and the
EDR signals [44]. The ECG features are categorized as the time-domain, and the frequency-
domain features in tables 2, 3 and 4.](https://image.slidesharecdn.com/12621ijaia05-211221061105/75/AUTOMATIC-HOME-BASED-SCREENING-OF-OBSTRUCTIVE-SLEEP-APNEA-USING-SINGLE-CHANNEL-ELECTROCARDIOGRAM-AND-SPO2-SIGNALS-6-2048.jpg)
![International Journal of Artificial Intelligence & Applications (IJAIA), Vol.12, No.6, November 2021
53
Table 3. The time-domain ECG features
The R-R tachogram: , the EDR:
Definition Name
Time window
mid-time
M length ECG
Average beat
[115]
U(.): step function
NN50-version 1
[115]
U(.): step function
NN50-version 2
[115]
pNN50-version 1
[115]
pNN50-version 2
[115]
Tachogram
standard deviation
,
SDSD [115]
RMSSD [115]
Sequential
correlation
coefficients [115]
Pn: Probability distribution function
Sequential mutual
information [319]
: Number of beats in the ith
section of a k-second signal
Allan Factor [124]
Number of
Extreme Points
[116]
Average EDR
Standard
Deviation EDR](https://image.slidesharecdn.com/12621ijaia05-211221061105/75/AUTOMATIC-HOME-BASED-SCREENING-OF-OBSTRUCTIVE-SLEEP-APNEA-USING-SINGLE-CHANNEL-ELECTROCARDIOGRAM-AND-SPO2-SIGNALS-7-2048.jpg)
![International Journal of Artificial Intelligence & Applications (IJAIA), Vol.12, No.6, November 2021
54
Table 4. The frequency-domain features of the R-R tachogram:
Definition Name
Sample deviation of
Sample deviation of (LF band)
Sample deviation of (HF band)
: Lomb-Scargel periodogram [348,86]
HRV Power spectrum (LF band)
HRV Power spectrum (HF band)
LF-HF power ratio in the HRV spectrum
Lomb-Scargel periodogram samples in LF-HF
band
Estimated respiration frequency (Dominant HF-
band frequency of HRV) [86]
Power at the dominant HF-band frequency of
HRV
Probability of estimated respiration frequency
occurrence with power
Most probable frequency of the HRV spectrum
Probability of ProbMax occurrence with power
Power of the HRV spectrum at ProbMax](https://image.slidesharecdn.com/12621ijaia05-211221061105/75/AUTOMATIC-HOME-BASED-SCREENING-OF-OBSTRUCTIVE-SLEEP-APNEA-USING-SINGLE-CHANNEL-ELECTROCARDIOGRAM-AND-SPO2-SIGNALS-8-2048.jpg)
![International Journal of Artificial Intelligence & Applications (IJAIA), Vol.12, No.6, November 2021
55
Table 5. The frequency-domain features of the EDR:
2.3. Feature Reduction
Most automatic OSA detection methods [11-13, 16-19, 27, 29] use no feature reduction or
employ linear dependency and correlation-based strategies or principal component analysis
(PCA) for feature selection. Dependency and mutual information (MI) proved to outperform
linear methods of feature selection, especially in respiratory event detection [14, 31]. Feature
selection can be performed by individual analysis of each feature [13, 21, 26]. It is also possible
to define a measure to evaluate a subset of features [14, 16]. The first method speculates the inter-
relations among features but, the second method searches for features with both the tightest
relations with the class label and the loosest interaction with each other. We use the second
strategy for feature reduction.
To calculate the mutual interactions, we consider MI rather than a simple statistical correlation.
We select the features which have the highest MI with the class label (normal of apnoeic) and the
least MI with each other. The approach to search the feature space is forward feature selection. In
this approach, the subset of selected features is gradually built by adding single features to an
initial null set [14, 54].
Definition Name
Sample deviation of
Sample deviation of (LF band)
Sample deviation of (HF band)
EDR Power spectrum (LF band)
EDR Power spectrum (HF band)
LF-HF power ratio in the EDR spectrum
Lomb-Scargel periodogram samples in LF-HF
band
Dominant HF-band frequency of the EDR
Power at the dominant HF-band frequency of
the EDR
Probability of occurrence with
power
Most probable frequency of the EDR
spectrum
Probability of edr-ProbMax occurrence with
power
Power of the HRV spectrum at edr-ProbMax](https://image.slidesharecdn.com/12621ijaia05-211221061105/75/AUTOMATIC-HOME-BASED-SCREENING-OF-OBSTRUCTIVE-SLEEP-APNEA-USING-SINGLE-CHANNEL-ELECTROCARDIOGRAM-AND-SPO2-SIGNALS-9-2048.jpg)
![International Journal of Artificial Intelligence & Applications (IJAIA), Vol.12, No.6, November 2021
56
2.4. Classification
We employ nine classifiers in this study; support vector machines (SVM) [55], K nearest
neighbors (KNN) [60], decision table [56], C4.5 [57] decision tree, reduced-error pruning tree
(REPT) [58], functional trees [59], the meta-algorithm of adaptive boosting accompanied with
the simple classifier of decision stump [60], and the meta-algorithm of bagging along with the
alternating decision tree (ADT) [61]. The meta-algorithms make a new data set out of the primary
data set and devise a new classifier for each set in one trial. These trials are repeated T times, and
eventually, the results of the T classifiers are combined to achieve a more accurate result.
In this study, four classifier combination methods are also performed on a group of three binary
classifiers. Combination methods are max probability, average probability, the product of
probability, and majority voting [16].
3. RESULTS
Table 2 demonstrates the Pierson`s correlation coefficients between frequencies derived from
respiratory signals and the extracted EDRs in each database. (8 subjects from Apnea-ECG
database, 25 subjects of the UCD database, and 158 subjects of the exclusive database are
considered). Separate evaluation in databases is due to their different sampling frequencies of
ECG signals. The best performances are shaded. According to this table the EDR is extracted by
the T wave duration method [51, 52] in the UCD and ECG-Apnea databases. We calculate the
EDR with the help of the area under the QRS graph [53] in our exclusive database.
Higher correlation coefficients for the “area under the QRS graph” method comparing to
approaches based on R wave amplitude and duration approach exhibits its priority and better
performance. The area under graph is more stable and robust to noise [thesis161].
Relatively low sampling frequency of ECG signal in the UCD and Apnea-ECG database (less
than 250Hz) makes the representation of the area under the graph inaccurate. The most rapid
changes in ECG signal is occurred during systole and ejection of blood out of ventricles. This is
the reason why these methods cannot represent respiratory frequency well especially during
respiratory events. The best alternative is T wave EDR extraction. T wave is the result of slow
repolarization of ventricles after systolic activity and is not affected by low sampling frequency
of ECG signal [145 thesis]. Only when the T wave is not observed in one beat or inverted due to
a cardiac problem, QRS area methods are considered [116thesis].
Table 5 demonstrates the selected features employing the MI measure. According to table 5, as
the number of database subjects increases, the number of selected features also increases. There
are several similarities between the selected measures; fewer ECG features are among the
selected ones, mostly the time domain ECG features. This result is consistent with the previously
published reports. Most of the selected features are based on the SpO2 signal, which indicates
their power for the OSA detection. However, simultaneous use of the ECG and the SPO2 features
enhances the performance of the OSA detection method [16].](https://image.slidesharecdn.com/12621ijaia05-211221061105/75/AUTOMATIC-HOME-BASED-SCREENING-OF-OBSTRUCTIVE-SLEEP-APNEA-USING-SINGLE-CHANNEL-ELECTROCARDIOGRAM-AND-SPO2-SIGNALS-10-2048.jpg)
![International Journal of Artificial Intelligence & Applications (IJAIA), Vol.12, No.6, November 2021
57
Table 6. The selected features through forward feature selection based on the MI criterion. Name and
definition of features stated in tables 1 to 4
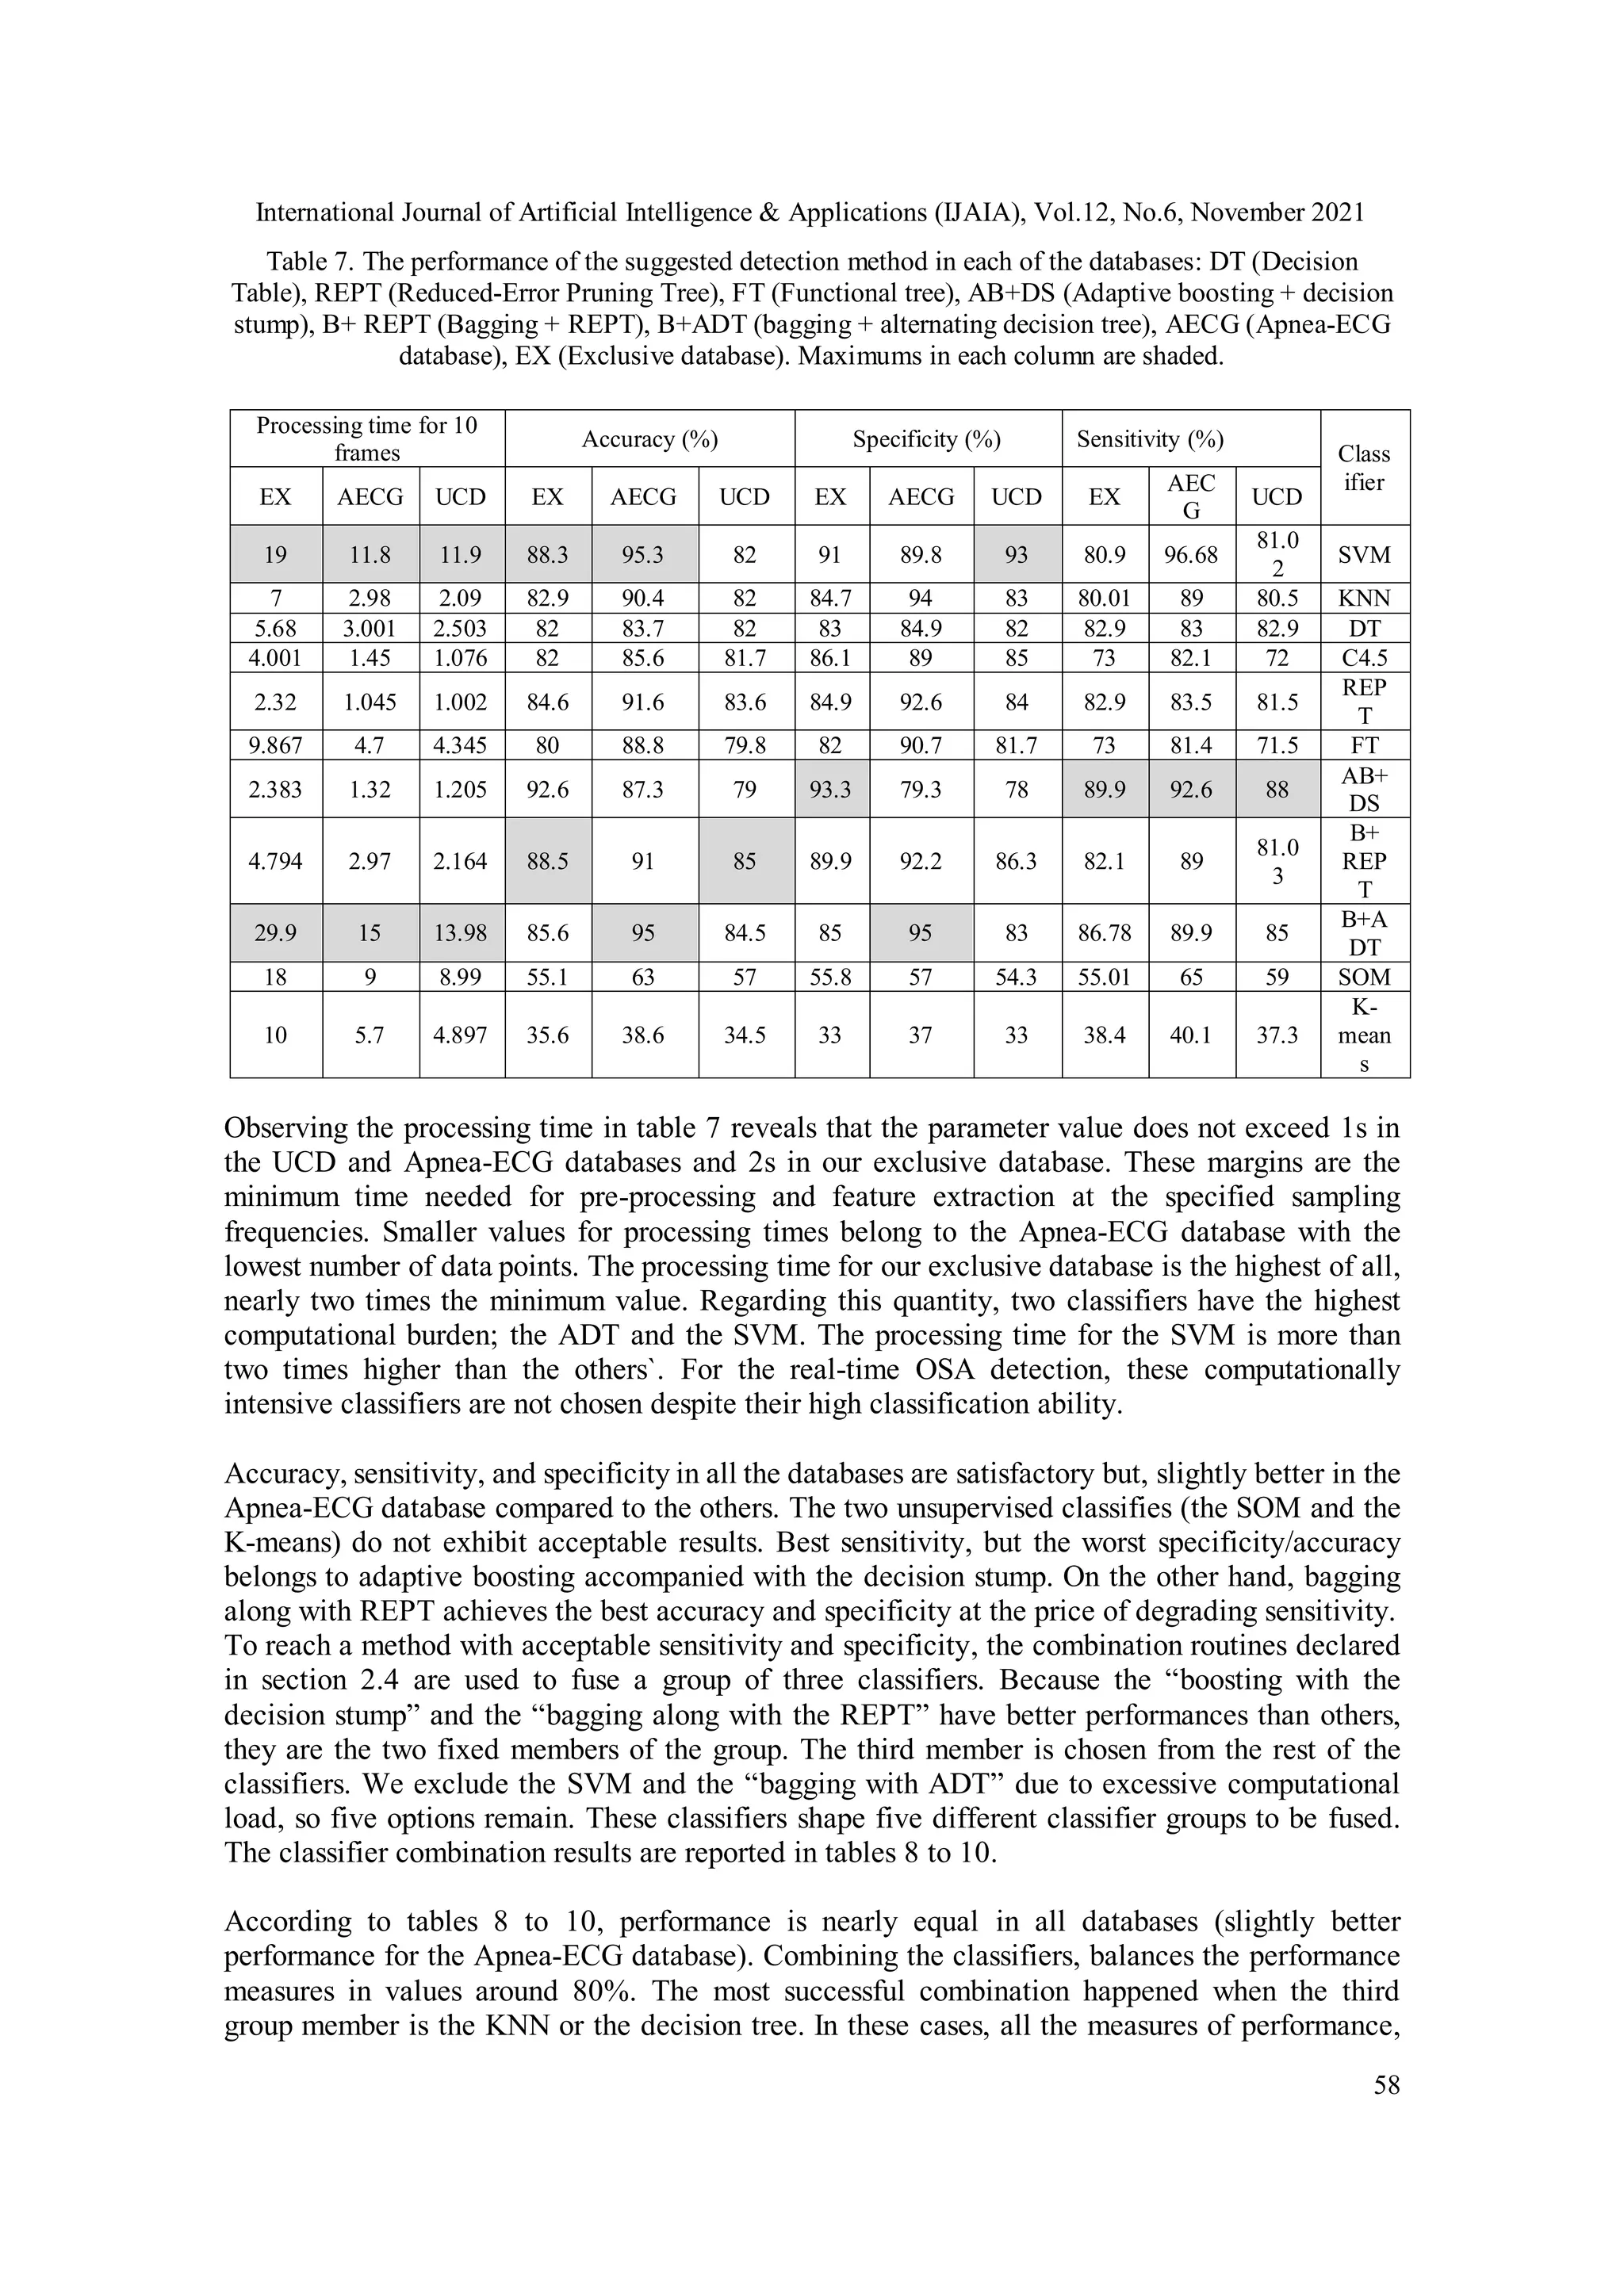
Table 6 illustrates the performance of our real-time detection method in each of the databases.
We obtain the results from a system equipped with Windows 10 Pro, version 1511, the Intel
processor Core i7CPU M640@2.8GHz and a RAM of 4GB. All the classifiers are realized in
Java language. Evaluation is 10-fold cross-validation.
In some references, only the classifier`s training time is reported [16]. This parameter is not
enough to represent the total computational burden of the suggested method. In some previous
works, the processing time is reported for a specified number of samples [14]. In our study, “the
processing time for a fixed number of data samples” is not an accurate measure since several
databases with different ECG sampling rates are observed.
Database
Selected features
Num
ber
UCD
MI3, spo2min, NEP1, Sspo2, , , LZdown, odi4, CTM0.5, ODI55,
tsa80, tsa85, tsa90, , , , , ،samples 13th
and 55th
of sample 4th
of
20
Apnea-ECG
Sspo2, , , LZCup, CTM0.25, CTM0.5, ODI55, tsa80, tsa85,
tsa90, , , , samples 11th
, 18th
, 22th
and 55th
of
and sample 4th
of
18
Exclusive
database
Spo2min, , Sspo2, ZC, ApEn, SpEn, LZCup, ,
, , ODIS4, ODI23, ODI25, ODI31, ODI35, ODI51,
ODI53, ODI55, odi3, odi4, odi5, tsa95, tsa85, tsa80, CTM0.5,
CTM0.75, CTM1, ، sample 4th
of
29](https://image.slidesharecdn.com/12621ijaia05-211221061105/75/AUTOMATIC-HOME-BASED-SCREENING-OF-OBSTRUCTIVE-SLEEP-APNEA-USING-SINGLE-CHANNEL-ELECTROCARDIOGRAM-AND-SPO2-SIGNALS-11-2048.jpg)
![International Journal of Artificial Intelligence & Applications (IJAIA), Vol.12, No.6, November 2021
59
including sensitivity, specificity, and accuracy, have achieved values of more than 85%. These
results outperform all the suggested methods to date [13, 14, 16, 19, 32, 35]. The principal
difference between the KNN and the decision tree lies in their nature. KNN benefits from slow,
moment-based training. It is appropriate for subject-dependant applications, in which models are
built and tested with the same data. In subject-dependant applications each classifier model
should be trained (i.e. updated) with the user data before utilization. On the other hand, the
decision table is suitable for subject-independent applications where the classifier model is
trained with a database of several subjects before being tested by the user.
Surveying the processing time shows that this quantity is approximately equal to the sum of the
processing time needed for each classifier of the group. There is no distinguished difference
between different combination routines. It is worth saying that combination methods based on
probability need the sensitivity and the specificity of the classifier to weigh their decisions. This
issue entails a more complex online realization than that of majority voting. Therefore, in online
realization, the majority voting method will suffice.
Table 8. The performance of the suggested classifier combination detection method in the UCD database.
Three classifiers are combined with four different methods (MP: Maximum probability, PP: Probability
product, AP: Average probability, MV: Majority voting). Other abbreviations are similar to table 6. The
two highest values in each column are shaded.
Table 9. The performance of the suggested classifier combination detection method in the Apnea-ECG
database. Three classifiers are combined with four different methods (MP: Maximum probability, PP:
Probability product, AP: Average probability, MV: Majority voting). Other abbreviations are similar to
table 6. The two highest values in each column are shaded.
rd
3
classifier
Sensitivity (%)
Specificity (%)
Accuracy (%)
Processing time for 10
frames
MP
PP
A
P
M
V
M
P
PP
A
P
M
V
MP
P
P
AP
M
V
MP
PP
AP
MV
KNN
86
87.
2
87
.5
87.
6
86.
17
86.
23
86
.1
85.
34
86.
15
86
.2
7
86.
2
85.
38
5.2
9
5.5
55
5.6
34
5.68
DT
86.
23
86.
6
86
.7
3
86.
70
85.
5
85.
48
85
.3
9
84.
2
85.
2
85
.8
85.
7
85.
02
5.2
91
5.3
4
5.1
25
5.23
rd
3
classifi
er
Sensitivity (%)
Specificity (%)
Accuracy (%)
Processing time for 10
frames
M
P
P
P
AP
M
V
MP
PP
AP
M
V
MP
PP
AP
M
V
MP
PP
AP
MV
KNN
85
.8
7
87
.1
9
87.
41
87.
55
86.
07
86.
16
86.
03
85.
25
86.
12
86.
2
86.
12
85.
28
4.4
4.4
7
4.6
8
4.3
6
DT
86
.1
4
86
.5
7
86.
68
87.
61
85.
47
85.
42
85.
35
84.
16
85.
64
85.
7
85.
68
85
4.8
69
4.7
6
4.6
5
4.5
5
C4.5
81
.8
7
82
.1
9
82.
41
83.
55
82.
07
82.
16
82.
03
81.
25
82.
02
82.
17
82.
12
81.
81
3.9
63
3.7
9
3.9
2
4
REPT
82
.1
4
82
.5
7
82.
68
83.
61
81.
47
81.
42
81.
35
80.
16
81.
64
81.
70
81.
68
81
3.2
45
3.3
9
3.5
6
3.6
5
FT
81
.8
2
82
.2
5
82.
41
82.
9
80.
69
80.
57
80.
48
80.
43
80.
96
80.
98
80.
95
81.
03
5.5
6
5.6
3
5.3
4
5.2
1](https://image.slidesharecdn.com/12621ijaia05-211221061105/75/AUTOMATIC-HOME-BASED-SCREENING-OF-OBSTRUCTIVE-SLEEP-APNEA-USING-SINGLE-CHANNEL-ELECTROCARDIOGRAM-AND-SPO2-SIGNALS-13-2048.jpg)
![International Journal of Artificial Intelligence & Applications (IJAIA), Vol.12, No.6, November 2021
60
C4.5
81.
94
82.
2
82
.5
83.
6
82.
1
82.
2
82
.1
82.
33
82.
23
82
.2
82.
25
82.
4
3.4
9
3.6
5
3.7
3.99
REPT
82.
15
82.
6
82
.7
83.
69
81.
5
81.
49
81
.3
8
80.
2
81.
7
81
.7
5
81.
71
81
3.1
1
3.1
28
3.0
68
3.02
5
FT
81.
91
82.
31
82
.5
83
81
80.
7
80
.6
80.
57
81
81
.0
1
81.
2
81.
1
5.9
5.8
7
5.7
9
5.96
9
Table 10. The performance of the suggested classifier combination detection method in the exclusive
database. Three classifiers are combined with four different methods (MP: Maximum probability, PP:
Probability product, AP: Average probability, MV: Majority voting). Other abbreviations are similar to
table 6. The two highest values in each column are shaded.
4. CONCLUSIONS
In this study, several configurations for online detection of the OSA are suggested. The
advantages of the proposed method are: exploiting only two channels of biological signals,
automatic and real-time detection, and uniform acceptable performance over several databases
(over 85%). To date, no other study has achieved all these merits together. Acceptable
performance in well-known databases is due to classifiers that do not possess database-related
parameters (e.g. sampling frequency of signals). The classifiers have covered deficiencies of each
other in a combinational configuration. To reach the best result, the most successful classifiers
are combined in groups of three members with four different combination methods. The features
are also calculated and selected considering generality; in frequency-domain analysis, the refined
Lomb-Scargle periodogram is used to care for the inherent non-uniform sampling of the R-R
tachograms and unequal sampling frequency of the ECG signal in different databases [50].
Feature selection is based on the MI. The MI measure considers non-linear correlations among
features and selects effective features to decrease the computational burden of the classifiers and
avoid over-fitting problems.
On the other hand, the MI feature reduction has an important impact on the family of decision
tree classifiers. MI-based feature selection accompanied by decision tree classifiers, avoids the
classifier sensitivity to MI-biased estimates. In other words, the decision-tree classifiers may be
misled by a fake replica of a feature with more marginal samples and higher maximum entropy
value [62]. Selection of the more appropriate feature with an entropy-normalised MI estimator is
helpful [62, 63].
rd
3
classi
fier
Sensitivity (%)
Specificity (%)
Accuracy (%)
Processing time for 10
frames
MP
PP
A
P
M
V
MP
PP
A
P
MV
M
P
PP
AP
MV
MP
PP
AP
MV
KNN
85.
67
87.
1
87.
35
87.
23
86
86.
11
86
85.
24
86
86.
13
86.
03
85.
32
12
11.
6
11.
81
12.0
5
DT
86
86.
6
86.
65
87.
5
85.
5
85.
34
85
.3
0
84.
14
85.
6
85.
7
85.
48
84.
9
10.
56
10.
68
10.
54
10.4
3
C4.5
81.
85
82.
17
82.
13
83.
51
82.
01
82.
14
82
81.
20
81.
95
82.
13
82.
10
81.
78
9.0
4
9.2
4
9.4
7
9.34
REPT
82.
1
82.
55
82.
7
83.
6
81.
46
81.
43
81
.3
3
81.
55
81.
64
81.
67
81.
68
82.
1
7.3
2
7.4
89
7.3
67
7.34
9
FT
81.
72
82.
15
82.
3
82.
8
80.
59
80.
44
80
.3
6
80.
32
80.
92
80.
93
80.
87
81.
01
14.
86
14.
62
14.
96
15.0
04](https://image.slidesharecdn.com/12621ijaia05-211221061105/75/AUTOMATIC-HOME-BASED-SCREENING-OF-OBSTRUCTIVE-SLEEP-APNEA-USING-SINGLE-CHANNEL-ELECTROCARDIOGRAM-AND-SPO2-SIGNALS-14-2048.jpg)
![International Journal of Artificial Intelligence & Applications (IJAIA), Vol.12, No.6, November 2021
61
ACKNOWLEDGEMENTS
The author appreciates the cooperation of the Ibn-e-Sina Hospital sleep laboratory at Mashhad
University of Medical Sciences.
REFERENCES
[1] C. V. Senaratna, J. L. Perret et al,”Prevalence of obstructive sleep apnea in the general population: A
systematic review”, Sleep Medicine Reviews, vol. 34, pp. 70-81, 2017. ISSN 1087-0792, Available:
https://doi.org/10.1016/j.smrv.2016.07.002.
[2] O. Berdina, I. Madaeva, and L. Rychkova, ”Obstructive Sleep Apnea and COVID-19 Infection
Comorbidity: Analysis of the Problem in the Age Aspect”, International Journal of Biomedicine, vol.
10, no. 4, pp. 312-315, 2020.
[3] Timotius Ivan Hariyanto, Andree Kurniawan, ”Obstructive sleep apnea (OSA) and outcomes from
coronavirus disease 2019 (COVID-19) pneumonia: a systematic review and meta-analysis” ,Sleep
Medicine, vol 82, pp 47-53, 2021,
[4] J. Remmers, W. deGroot, E. Sauerland and A. Anch, "Pathogenesis of upper airway occlusion during
sleep", Journal of Applied Physiology, vol. 44, no. 6, pp. 931-938, 1978. Available:
10.1152/jappl.1978.44.6.931.
[5] B. Dredla and P. Castillo, "Cardiovascular Consequences of Obstructive Sleep Apnea", Current
Cardiology Reports, vol. 21, no. 11, 2019. Available: 10.1007/s11886-019-1228-3.
[6] B. Phillips, "Association of Sleep Apnea and Type II Diabetes: A Population-Based
Study", Yearbook of Pulmonary Disease, vol. 2007, pp. 249-251, 2007. Available: 10.1016/s8756-
3452(08)70452-3.
[7] W. Akberzie, S. Hesselbacher, I. Aiyer, S. Surani and Z. Surani, "The Prevalence of Anxiety and
Depression Symptoms in Obstructive Sleep Apnea", Cureus, 2020. Available: 10.7759/cureus.11203.
[8] W. McNicholas, "Diagnosis of Obstructive Sleep Apnea in Adults", Proceedings of the American
Thoracic Society, vol. 5, no. 2, pp. 154-160, 2008.
[9] International classification of sleep disorders. Darien, Ill.: American Acad. of Sleep Medicine, 4th
ed. New York: Westchester, III; 2014.
[10] T. Lee-Chiong, Sleep. Hoboken, N.J.: Wiley-Liss, 2006.
[11] V. Kapur et al., "The Medical Cost of Undiagnosed Sleep Apnea", Sleep, vol. 22, no. 6, pp. 749-755,
1999. Available: 10.1093/sleep/22.6.749.
[12] U. R. Abeyratne, V. Swarnkar, C. Hukins, and B. Duce, “Interhemispheric Asynchrony Correlates
With Severity of Respiratory Disturbance Index in Patients With Sleep Apnea”, IEEE Trans. Biomed.
Eng., vol. 57, no. 12, pp. 2947-2955, 2010.
[13] Kim PY, McCarty DE, Wang L, Frilot C, Chesson AL, Marino AA. Two-group classification of
patients with obstructive sleep apnea based on analysis of brain recurrence. Clinical
Neurophysiology. 2014 Jun 30;125(6):1174-81.
[14] Bsoul M, Minn H, Tamil L. Apnea MedAssist: real-time sleep apnea monitor using single-lead ECG.
IEEE Transactions on Information Technology in Biomedicine. 2011 May;15(3):416-27.
[15] Nguyen HD, Wilkins BA, Cheng Q, Benjamin BA. An online sleep apnea detection method based on
recurrence quantification analysis. IEEE Journal of Biomedical and Health Informatics. 2014
Jul;18(4):1285-93.
[16] H. M. Al-Angari, and Alan V. Sahakian, “Automated Recognition of Obstructive Sleep Apnea
Syndrome Using Support Vector Machine Classifier,” IEEE Trans. Inf. Tech. Biomed., vol. 16, no. 3,
pp. 463-468, 2012.
[17] Xie B, Minn H. Real-time sleep apnea detection by classifier combination. IEEE Transactions on
Information Technology in Biomedicine. 2012 May;16(3):469-77.
[18] Sannino G, De Falco I, De Pietro G. Monitoring obstructive sleep apnea by means of a real-time
mobile system based on the automatic extraction of sets of rules through differential evolution.
Journal of biomedical informatics. 2014 Jun 30; 49:84-100.
[19] J. V. Marcos et al, “Automated Prediction of the Apnea-Hypopnea Index from Nocturnal Oximetry
Recordings, ”IEEE Trans. Biomed. Eng., vol. 51, no. 1, pp. 141-149, 2012.](https://image.slidesharecdn.com/12621ijaia05-211221061105/75/AUTOMATIC-HOME-BASED-SCREENING-OF-OBSTRUCTIVE-SLEEP-APNEA-USING-SINGLE-CHANNEL-ELECTROCARDIOGRAM-AND-SPO2-SIGNALS-15-2048.jpg)
![International Journal of Artificial Intelligence & Applications (IJAIA), Vol.12, No.6, November 2021
62
[20] Koley BL, Dey D. On-Line Detection of Apnea/Hypopnea Events Using SpO2 Signal: A Rule-Based
Approach Employing Binary Classifier Models. IEEE Journal of Biomedical and Health Informatics.
2014 Jan;18(1):231-9.
[21] Koley BL, Dey D. Automatic detection of sleep apnea and hypopnea events from single channel
measurement of respiration signal employing ensemble binary SVM classifiers. Measurement. 2013
Aug 31;46(7):2082-92.
[22] Koley BL, Dey D. Real-time adaptive apnea and hypopnea event detection methodology for portable
sleep apnea monitoring devices. IEEE Transactions on Biomedical Engineering. 2013
Dec;60(12):3354-63.
[23] S. I. Rathnayake, I. A. Wood, U. R. Abeyratne, and C. Hukins, “Nonlinear features for single-channel
diagnosis of sleep-disordered breathing diseases,” IEEE Trans. Biomed. Eng., vol. 57, no. 8, pp.
1973–1981, Aug. 2010.
[24] Sanchez-Morillo D, Lopez-Gordo MA, Leon A. Novel multiclass classification for home-based
diagnosis of sleep apnea/hypopnea syndrome. Expert Systems with Applications. 2014 Mar
31;41(4):1654-62.
[25] Azarbarzin, Ali, and Zahra MK Moussavi. "Automatic and unsupervised snore sound extraction from
respiratory sound signals." IEEE Transactions on Biomedical Engineering 58.5 (2011): 1156-1162.
[26] E. Goldshtein, A. Tarasiuk, and Y. Zigel, “Automatic Detection of Obstructive Sleep Apnea Using
Speech Signals,” IEEE Trans. Biomed. Eng., vol. 58, no. 5, pp. 1373 1382, Feb. 2011.
[27] Burgos A, Goni A, Illarramendi A, Bermudez J. Real-time detection of apneas on a PDA. IEEE
Transactions on Information Technology in Biomedicine. 2010 Jul;14(4):995-1002.
[28] Behar J, Roebuck A, Shahid M, Daly J, Hallack A, Palmius N, Stradling J, Clifford GD.
SleepAp: An automated obstructive sleep apnoea screening application for smartphones. IEEE
journal of biomedical and health informatics. 2015 Jan;19(1):325 31.
[29] ZhaoD, WangY, WangQ, WangX. Comparative analysis of different characteristics of automatic
sleep stages. Comput Methods Programs Biomed 2019; 175:53–72
[30] Carrubba S, Kim PY, Mccarty DE, Chesson Jr AL, Frilot C, Marino AA. Continuous EEG-based
dynamic markers for sleep depth and phasic events. J. Neurosci. Meth. 2012; 208:1–9.
[31] Ireneusz Jabło´nski, “Modern Methods for the Description of Complex Couplings in the
Neurophysiology of Respiration,” IEEE Sensors Journal, vol. 13, no. 9, pp. 3182-3192, Sep 2013.
[32] H. Ghandeharioun, F. Rezaeitalab, and R. Lotfi, "Analysis of respiratory events n obstructive sleep
apnea syndrome: Inter-relations and association to simple nocturnal features", Revista Portuguesa de
Pneumologia (English Edition), vol. 22, no. 2, pp. 86-92, 2016. Available:
10.1016/j.rppnen.2015.09.008.
[33] ErdenebayarU, KimYJ, ParkJ-U, JooEY, LeeK-J. Deep learning approaches for automatic detection
of sleep apnea events from an electrocardiogram. Comput. Methods Programs Biomed. 2019;
180:105001.
[34] DaldalN, CömertZ, PolatK. Automatic determination of digital modulation types with different noises
using convolutional neural network based on time–frequency information. Appl. Soft Comput. J 2019.
[35] ChoiSH, YoonH, KimHS, KimHB, KwonHB, OhSM, et al. Real-time apnea-hypopnea event
detection during sleep by convolutional neural networks. Comput. Biol. Med. 2018; 100:123–31.
[36] F. Bozkurt, M.K. Uçar, M.R. Bozkurt, C. Bilgin, Detection of Abnormal Respiratory Events with
Single Channel ECG and Hybrid Machine Learning Model in Patients with Obstructive Sleep Apnea,
IRBM, Volume 41, Issue 5,2020, Pages 241-251.
[37] St. Vincent’s University Hospital/University College Dublin Sleep Apnea Database. (2008).
Available: http://www.physionet.org/pn3/ucddb/
[38] “CinC Challenge 2000 data sets: Data for development and evaluation of ECG-based apnea
detectors,” (2000). Available: http://www.physionet.org/physiobank/database/apnea-ecg/
[39] A. Roebuck, V. Monasterio, E. Gederi, M. Osipov, J. Behar, A. Malhotra, T. Penzel and G. Clifford,
"A review of signals used in sleep analysis", Physiological Measurement, vol. 35, no. 1, pp. R1-R57,
2013.
[40] Kuna S T, Benca R, Kushida C A, Walsh J, Younes M, Staley B, Hanlon A, Pack A I, Pien G W and
Malhotra A 2013 Agreement in computer-assisted manual scoring of polysomnograms across sleep
centres, Sleep 36 583–9
[41] Behar J, Roebuck A, Shahid M, Daly J, Hallack A, Palmius N, Stradling JR, Clifford GD. SleepAp:
An automated obstructive sleep apnoea screening application for smartphones, Computing in
Cardiology 2013 2013 Sep 22 (pp. 257-260).](https://image.slidesharecdn.com/12621ijaia05-211221061105/75/AUTOMATIC-HOME-BASED-SCREENING-OF-OBSTRUCTIVE-SLEEP-APNEA-USING-SINGLE-CHANNEL-ELECTROCARDIOGRAM-AND-SPO2-SIGNALS-16-2048.jpg)
![International Journal of Artificial Intelligence & Applications (IJAIA), Vol.12, No.6, November 2021
63
[42] Malik M., Camm A.J. (eds.): Heart Rate Variability, Armonk, N.Y. Futura Pub. Co. Inc.,1995.
[43] Abboud S., Barnea O.: Errors due to sampling frequency of electrocardiogram in spectral analysis of
heart rate signals with low variability, Computers in Cardiology, pp 461-463, 1995.
[44] Oppenheim, Alan V., Willsky, Alan S., Navab, S. Hamid. "Digital signal processing."Printice-Hall,
London (2000). ISBN:0-13-651175-9.
[45] Daubechies, Ingrid. "Ten lectures on wavelets, vol. 61 of CBMS-NSF Regional Conference Series in
Applied Mathematics." (1992).
[46] Hamilton P., Tompkins W.: Quantitative Investigation of QRS Detection Rules Using the MIT/BIH
Arrythmia Database, IEEE Transactions on Biomedical Engineering, vol. BME-33, NO. 12. 1986.
[47] Pan J., Tompkins W.: A real-time QRS detection algorithm, IEEE Transactions on Biomedical
Engineering, vol. BME-32 NO. 3. 1985.
[48] Darbellay, Georges A., and Igor Vajda. "Estimation of the information by an adaptive partitioning of
the observation space." IEEE Transactions on Information Theory 45.4 (1999): 1315-1321.
[49] R. Hornero, D. Alvarez, D. Abasolo, F. del Campo, and C. Zamarron, “Utility of approximate entropy
from overnight pulse oximetry data in the diagnosis of the obstructive sleep apnea syndrome,” IEEE
Trans. Biomed. Eng., vol. 54, no. 1, pp. 107-113, Jan. 2007.
[50] D. Alvarez, R. Hornero, D. Ab´asolo, F. Campo, andC. Zamarr´on, “Nonlinear characteristics of
blood oxygen saturation from nocturnal oximetry for obstructive sleep apnoea detection,” Physiol.
Meas., vol. 27, pp. 399–412, 2006.
[51] Clifford GD. Signal processing methods for heart rate variability (Doctoral dissertation, Department
of Engineering Science, University of Oxford, September 2002.
[52] G. D. Furman, Z. Shinar,A. Baharav, and S. Akselrod, “Electrocardiogram derived respiration during
sleep,” Comput. Cardiol., vol. 32, pp. 351–354, 2005.
[53] Raymond, B., Cayton, R. M., Bates, R. A., & Chappell, M. J.,“Screening for Obstructive Sleep
Apnoea Based on the Electrocardiogram—The Computers in Cardiology Challenge,” Proc.
Computers in Cardiology, Vol. 27, IEEE Press, 2000, pp. 267–270.
[54] G. B. Moody, R. G. Mark, A. Zoccola, and S. Mantero, “Derivation of respiratory signals from multi-
lead ECGs,” Comput. Cardiol., vol. 12, pp. 113–116, 1985.
[55] P. A. Estevez, M. Tesmer, C. A. Perez, and J. M. Zurada, “Normalized mutual information feature
selection,” IEEE Trans. Neural Netw., vol. 20, no. 2, pp. 189–201, Feb. 2009.
[56] Murphy KP. Machine learning: a probabilistic perspective. MIT Press; 2012 Sep 7.
[57] N. Landwehr, M. Hall, and E. Frank. (2005, May). Logistic model trees. Mach. Learn. 59, pp. 161–
205.
[58] R. Quinlan, C4.5: Programs for Machine Learning. San Mateo, CA: Morgan Kaufmann, 1993.
[59] Mingers, John. "An empirical comparison of pruning methods for decision tree induction." Machine
learning 4.2 (1989): 227-243.
[60] Gama, Joao. "Functional trees." Machine Learning, vol. 55, no. 3, pp. 219-250, 2004.
[61] L. Breiman, “Bagging predictors,” Machine Learning, vol. 24, no. 2, pp. 123–140, 1996.
[62] Y. Freund and L. Mason, “The alternating decision tree algorithm,” in Proc. 16th Int. Conf. Mach.
Learning, 1999, pp. 124–133.
[63] J. R. Quinlan, “Induction of decision trees,” Mach. Learn., vol. 1, pp. 81–106, 1986.
[64] Paninski, Liam. "Estimation of entropy and mutual information." Neural computation 15.6 (2003):
1191-1253.
AUTHOR
Dr. Hosna Ghandeharioun received her B.S. degree in electrical engineering from
Ferdowsi University of Mashhad (FUM), Iran, in 2003 and an M.S. degree in Biomedical
Engineering from Iran University of Science & Technology, Iran in 2006. She received her
Ph. D. degree in electrical engineering from FUM in 2016. Now She works as an assistant
professor at the electrical and biomedical Engineering dept. of Khorasan Institute of Higher
Educations. Her research interests are biological signal processing and mobile health.](https://image.slidesharecdn.com/12621ijaia05-211221061105/75/AUTOMATIC-HOME-BASED-SCREENING-OF-OBSTRUCTIVE-SLEEP-APNEA-USING-SINGLE-CHANNEL-ELECTROCARDIOGRAM-AND-SPO2-SIGNALS-17-2048.jpg)