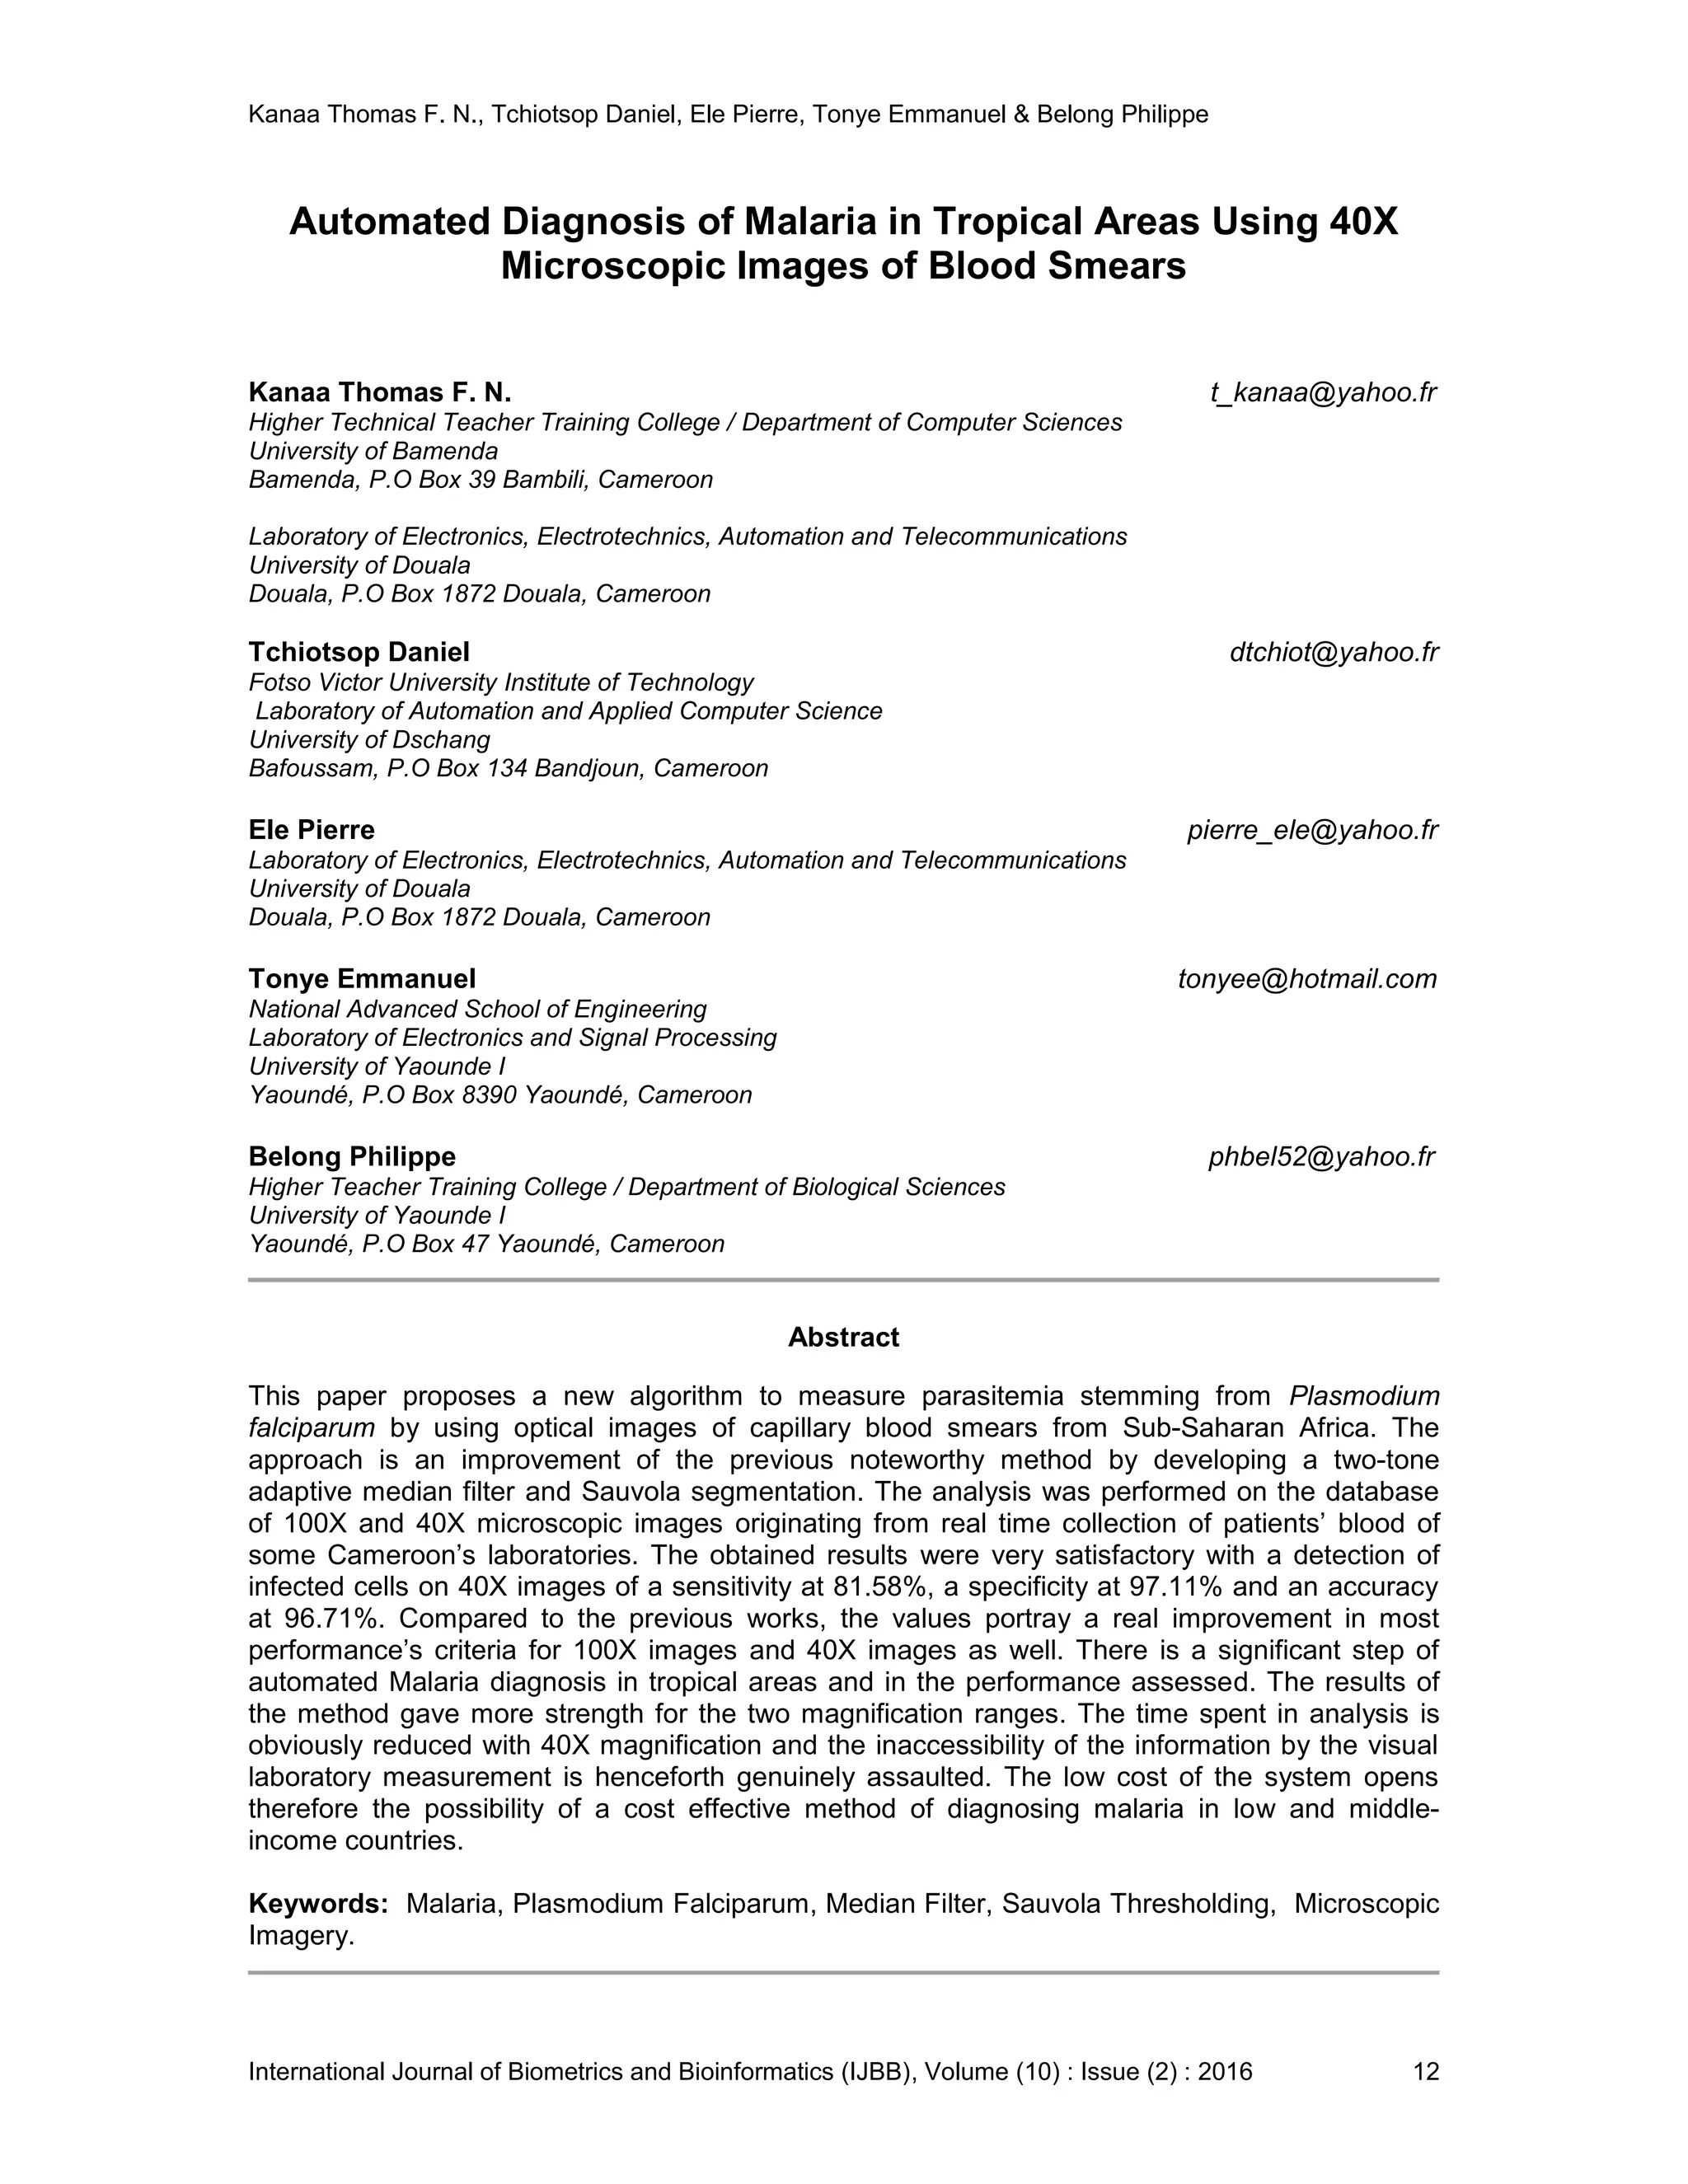
The paper presents a novel algorithm for automated malaria diagnosis using 40x microscopic images of blood smears, improving upon existing methods by utilizing a two-tone adaptive median filter and Sauvola segmentation. The approach demonstrated high sensitivity (81.58%), specificity (97.11%), and accuracy (96.71%) in detecting Plasmodium falciparum compared to previous techniques. This low-cost system could significantly enhance malaria diagnosis in low- and middle-income countries, addressing a critical health issue in endemic regions.
![Kanaa Thomas F. N., Tchiotsop Daniel, Ele Pierre, Tonye Emmanuel & Belong Philippe
International Journal of Biometrics and Bioinformatics (IJBB), Volume (10) : Issue (2) : 2016 13
1. INTRODUCTION
Malaria is an endemic disease which is a leading cause of morbidity and mortality in tropical and
sub-tropical countries. It is a mosquito-borne infectious disease of humans and other animals. In
humans, it is caused by Plasmodium falciparum, vivax, malariae and ovale [1,2]. The most
prevalent type in our context is the P. falciparum which is really a threat to health [3]. A significant
part of literature expands on the subject, turning it to be so current and of high priority [4,5,6,7].
An estimated 207 million cases and 627 thousands malaria deaths are estimated to have
occurred in 2012 [8]. The estimation of disease burden in Cameroon is 30 - 35% and 40 - 45% in
the total deaths and morbidity cases respectively [9]. There is an urgent need to increase funding
for malaria control and to expand program coverage, in order to meet international targets for
reducing malaria cases and deaths [8]. In the exercise of diagnosing malaria reserved as the
cornerstone of WHO’s initiative T3 (Test, Treat and Track), we focused our attention on the
improvement of the first step. Diagnosis of malaria can be achieved using a number of different
methods as Quantitative Buffy Coat (QBC), automated detection of Malaria pigment and image
processing techniques.
In QBC method, nuclear material is stained using acridine orange which highlights white blood
cells and parasites, and they can then be identified using UV light [10,11]. Though achieving a
sensitivity of 75% and a specificity of 84%, the major problems of this technique are the cost of
fluorescent microscopes, the capillary tubes [12,13] as well as the availability of acridine orange
as it is considered hazardous [14]. To improve diagnosis, the detection of stained specific
pigments was performed. An automated process using analyzers, programs flow cytometry,
depolarized laser light and Volume Conductivity [15], was investigated. For 90% in sensitivity and
88% in specificity [16], the method improved from the previous but its required automated
analysis is not available in most endemic regions.
Automated Malaria diagnosis based on Giemsa and Fristain stained blood smear images have
also been addressed in several works using different approaches. A substantial literature review
is presented in the works of Razzak [17] with the outline of some performance criteria in the
recent developments for malarial parasite identification. Savkare et al. [18] implemented the
image smoothening and edge sharpening with the median and Laplacian filters. Isolating the
foreground from the background with Otsu thresholding, they used the distance transform and the
watershed algorithm as tools of Red Blood Cells (RBC) segmentation. The subsequent
deployment of the support vector machine (SVM) for cell classification permitted to obtain a
sensitivity of 93.12% and a specificity of 93.17%.
For a global accuracy of the system at 97.73% in diagnosing malaria from Human RBC, Pranati
et al. [19] exploited Sobel edge followed by Harris corner detection to identify malarial parasites.
Even if performance criteria are becoming more and more interesting, the tools and techniques
are not overemphasized on the improvement of execution time.
Rapid malaria diagnosis proposed by Maitethia [20] proceeds by means of median filter to reduce
noise, the Otsu thresholding for the segmentation of cells and Zack thresholding for parasite
segmentation. The cell and stage classification based on texture and color features are obtained
through the Artificial Neural Network (ANN) for a result of sensitivity at 92% and specificity at
97%.
Still in the aim of accelerating the diagnosis, Imroze et al. [21] deployed an image processing
method and compared it to his Plasmo-vision technique. The image processing develops an
algorithm combining the Median filter, the Smallest Unit value Segment Assimilating Nucleus
(SUSAN), with the Canny Edge detector and the Otsu global thresholding based on variances.
For the segmentation, the marker controlled watershed, Top-Hat and Bottom-Hat Transform were
implemented. The final classification of an erythrocyte and the species of the parasite through a
two-stage binary tree-classifier on first order and moment invariant features helped to achieve a
sensitivity of 90% and Predictive Positive Value of 80%.](https://image.slidesharecdn.com/ijbb-240-170401115536/75/Automated-Diagnosis-of-Malaria-in-Tropical-Areas-Using-40X-Microscopic-Images-of-Blood-Smears-2-2048.jpg)
![Kanaa Thomas F. N., Tchiotsop Daniel, Ele Pierre, Tonye Emmanuel & Belong Philippe
International Journal of Biometrics and Bioinformatics (IJBB), Volume (10) : Issue (2) : 2016 14
Pramit et al. [22], to achieve an accuracy of 91.125%, rather used the Laplacian filtered
separately on Red, Green and Blue components of the color images before the cell segmentation
with an appropriate threshold. The comparison of two sets of binary images reveals or absence of
Plasmodium.
In Aggraini’s works [23], the median filter and global thresholding are used to remove noise and
extract blood cells. The Bayes decision theory is then implemented on separate set of futures to
build a two stage erythrocyte classifier based respectively on range intensity and ratio of
white/black feature. The method performed a sensitivity of 92.59% and as a specificity of 99.65%,
encouraging to classify the parasites by using its shape and size.
A counting of Red and White Blood Cells method with an accuracy of 94.58% by Pooja et al. [24]
is developed from a database of 75 blood smears images. Essentially using the standard median
filtering, the global thresholding and finally the blood cell factor estimation through the dilation of
blood, the depth of the counting chamber and the small squares’ number and area. Reinforced in
accuracy with 0.06% by Pawan et al. [25] with the segmentation and the edge detection through
the Hough Transform method.
Many pathologists use blood analysis with chemical process in diagnosing Malaria. Unfortunately,
it is time consuming, requires blood analyst and can lead to false results. Though they brought a
number of developed systems in accelerating the diagnosis this last decade, most of the
automated diagnosis methods are deployed on 100X microscopes and more. The presented
performance criteria are either one or a maximum of two on the four that are normally awaited,
with an appreciation of a mean sensitivity at 92.22% calculated from [17]. The expensiveness of
these previous systems is an actual condition in decision-making to health access for low-income
countries. The author’s aim is therefore to design a forceful process adapted to microscopic
images of a different standard from the tropical sub-Saharan ecosystem for more efficiency,
availability and financial reasons.
The work is thus organized in presenting the general methodology in section 2, dealing first with
the blood smears preparation, the laboratory count of parasites, the image acquisition process.
This, was followed by the presentation of two noteworthy methods designed for comparison with
the same use constraints. Sections 3 unfolds respectively with the experimental results and
discussion before the conclusion tails the paper in section 4.
2. METHODOLOGY OF WORK
2.1 Laboratory Analysis
We worked on blood collected from PMI Health Center Nkwen at Bamenda, Azire Preventive
Hospital at Bamenda and District Hospital of Logbaba at Douala. Thin blood smears preparation
is performed by using Giemsa coloration in conformity with the standard [26]. The laboratory
count of parasite was carried out with the support of in-situ experts.
2.2 Image Acquisition Process
Images are captured in real time with an acquisition system comprising a binocular microscope,
Type XSZ-107BN (No 002890), with 100X and 40X magnification; a webcam digital camera, type
USB2.0 PC camera (SN9C203); and a computer Intel
®
Core™, 2 Duo processor T6500, 4GB
DDR3 Memory, for images capture and processing. The link between computer and camera is
provided by a USB interface and CyberLink YouCam 4 software drivers. The 100X regions of
interest on 40X images are extracted proportionally according to the magnification ratio.
2.3 Conventional Approach
Moved by white and red blood cells counting method [23], the conventional approach unfolds the
following steps namely image conversion from RGB to gray, median filtering, Gray thresholding,
filling of holes, removal of borders, image labelling. The previous, implemented by author’s care,](https://image.slidesharecdn.com/ijbb-240-170401115536/75/Automated-Diagnosis-of-Malaria-in-Tropical-Areas-Using-40X-Microscopic-Images-of-Blood-Smears-3-2048.jpg)
![Kanaa Thomas F. N., Tchiotsop Daniel, Ele Pierre, Tonye Emmanuel & Belong Philippe
International Journal of Biometrics and Bioinformatics (IJBB), Volume (10) : Issue (2) : 2016 15
are completed with the cells form factor calculation, detection and counting of infected cells as
described in § 2.4.3 for estimation of parasitemia.
2.4. Improved Method
This new approach follows the general synopsis of the conventional method where some new
concepts are included on typical phases for innovation. The 2-stage adaptative median filtering (§
2.4.1) and the Sauvola’s segmentation (§ 2.4.2) are respectively put in place and computed at the
preprocessing and the cells extraction steps. For cells classification (§ 2.4.3), the form factor is
always estimated in order to detect and count infected cells.
2.4.1 Two-stage Adaptive Median Filter
The filter combines two concepts, both adaptative and contextual according to the literature
sources. For the first, the size of our window is not fixed and the filtering is done once a specified
condition is fulfilled [27]. For the second, we partitioned the pre-processing depending of the local
disparity of information in the image [28]. The filtering algorithm is then summarized as follow:
1. Let be the maximum window size and initialize s=1
Let be a window of size s×s centered at (i, j), which means
=
2. Compute , , and which are mean, minimum, maximum and median
of the pixel values in respectively
3. While
4. Compute the negative median, the positive median, the negative gradient and the
positive gradient of the pixel values in , respectively , ,
and , by , with and
5. Compute the mean , the maximum and the standard deviation of
6. Compute the fringing weighting coefficients
7. Compute the index of fit
8. * If , then the median value is not an impulse, the
algorithm goes to 9 to check if the current pixel is an impulse.
* Else the size of the window is increased and 8 is repeated until the median value is
not an impulse, then the algorithm goes to 9; Until the maximum window size is
reached, in which case the median value is assigned as the filtered image pixel value
.
9. * If , then the current pixel value is not an impulse, so
the filtered image pixel is unchanged.
* Else the image pixel is corrupted and can either equal to or to
, then the filtered imaged pixel is assigned the median value from 2.
2.4.2 Image Segmentation
Global thresholding methods like optimal global thresholding typically fails when the background
illumination is highly non uniform. one approach used to compensate for irregularities in
illumination is the use of variable thresholding [29]. This approach computes a threshold value at
every point in the image, based on one or more specified properties of the pixels in the
neighborhood. We illustrated the basic approach to local or variable thresholding using the local
standard deviation and mean of the pixels in a neighborhood of every point in an image [30]. The
local threshold of Sauvola is as follows:](https://image.slidesharecdn.com/ijbb-240-170401115536/75/Automated-Diagnosis-of-Malaria-in-Tropical-Areas-Using-40X-Microscopic-Images-of-Blood-Smears-4-2048.jpg)
![Kanaa Thomas F. N., Tchiotsop Daniel, Ele Pierre, Tonye Emmanuel & Belong Philippe
International Journal of Biometrics and Bioinformatics (IJBB), Volume (10) : Issue (2) : 2016 16
Where is the maximum value of the standard deviation and is a bias, which takes positive
values in the range [0.2, 0.5]. In order to compute the threshold, the integral image of the input
image is first extracted in each single pixel, the local mean and the local variance
[31] are then computed.
2.4.3 Cells Classification
In order to distinguish between infected and non-infected red blood cells, we extracted features
from the image array and computed new variables that concentrated information to separate
classes. One set of features had been chosen for development, geometric shape features [32]:
area, perimeter and form factor. The detection is finally achieved from the form factor values of
cells which varies as the shape of an object varies. Moreover the form factor range of a malaria
infected red blood cell is 1.26 0.14, 1.57 0.38 and 1.35 0.22 for respectively low, medium and
high parasitemia [33].
3. EXPERIMENTAL RESULTS AND DISCUSSION
3.1 Data
After blood extraction, thin blood smears preparation with Giemsa coloring, laboratory count of
parasites and acquisition process with the microscope, we produced a database of 100 original
images of 100X and 40X magnifications, 50 each, with spatial resolutions 300x320 and 120x128
respectively and 8 digits in JPEG format. A set of the sample number 16 of both 100X (coded
10016 in figure 1a) and 40X (coded 4016 in figure 1b) magnification is presented in figure 1. The
region of interest is defined by the 100X magnification image. It is acquired directly from the
microscope with 100X magnification, where infected red blood cells are visibly located in the
laboratory as it is indicated here by two arrows (figure 1a). It is then extracted from the acquired
image from the microscope with 40X magnification. In this case, it is very challenging to identify
the infected red blood cells in the laboratory (figure 1b) without testing an appropriate algorithm.
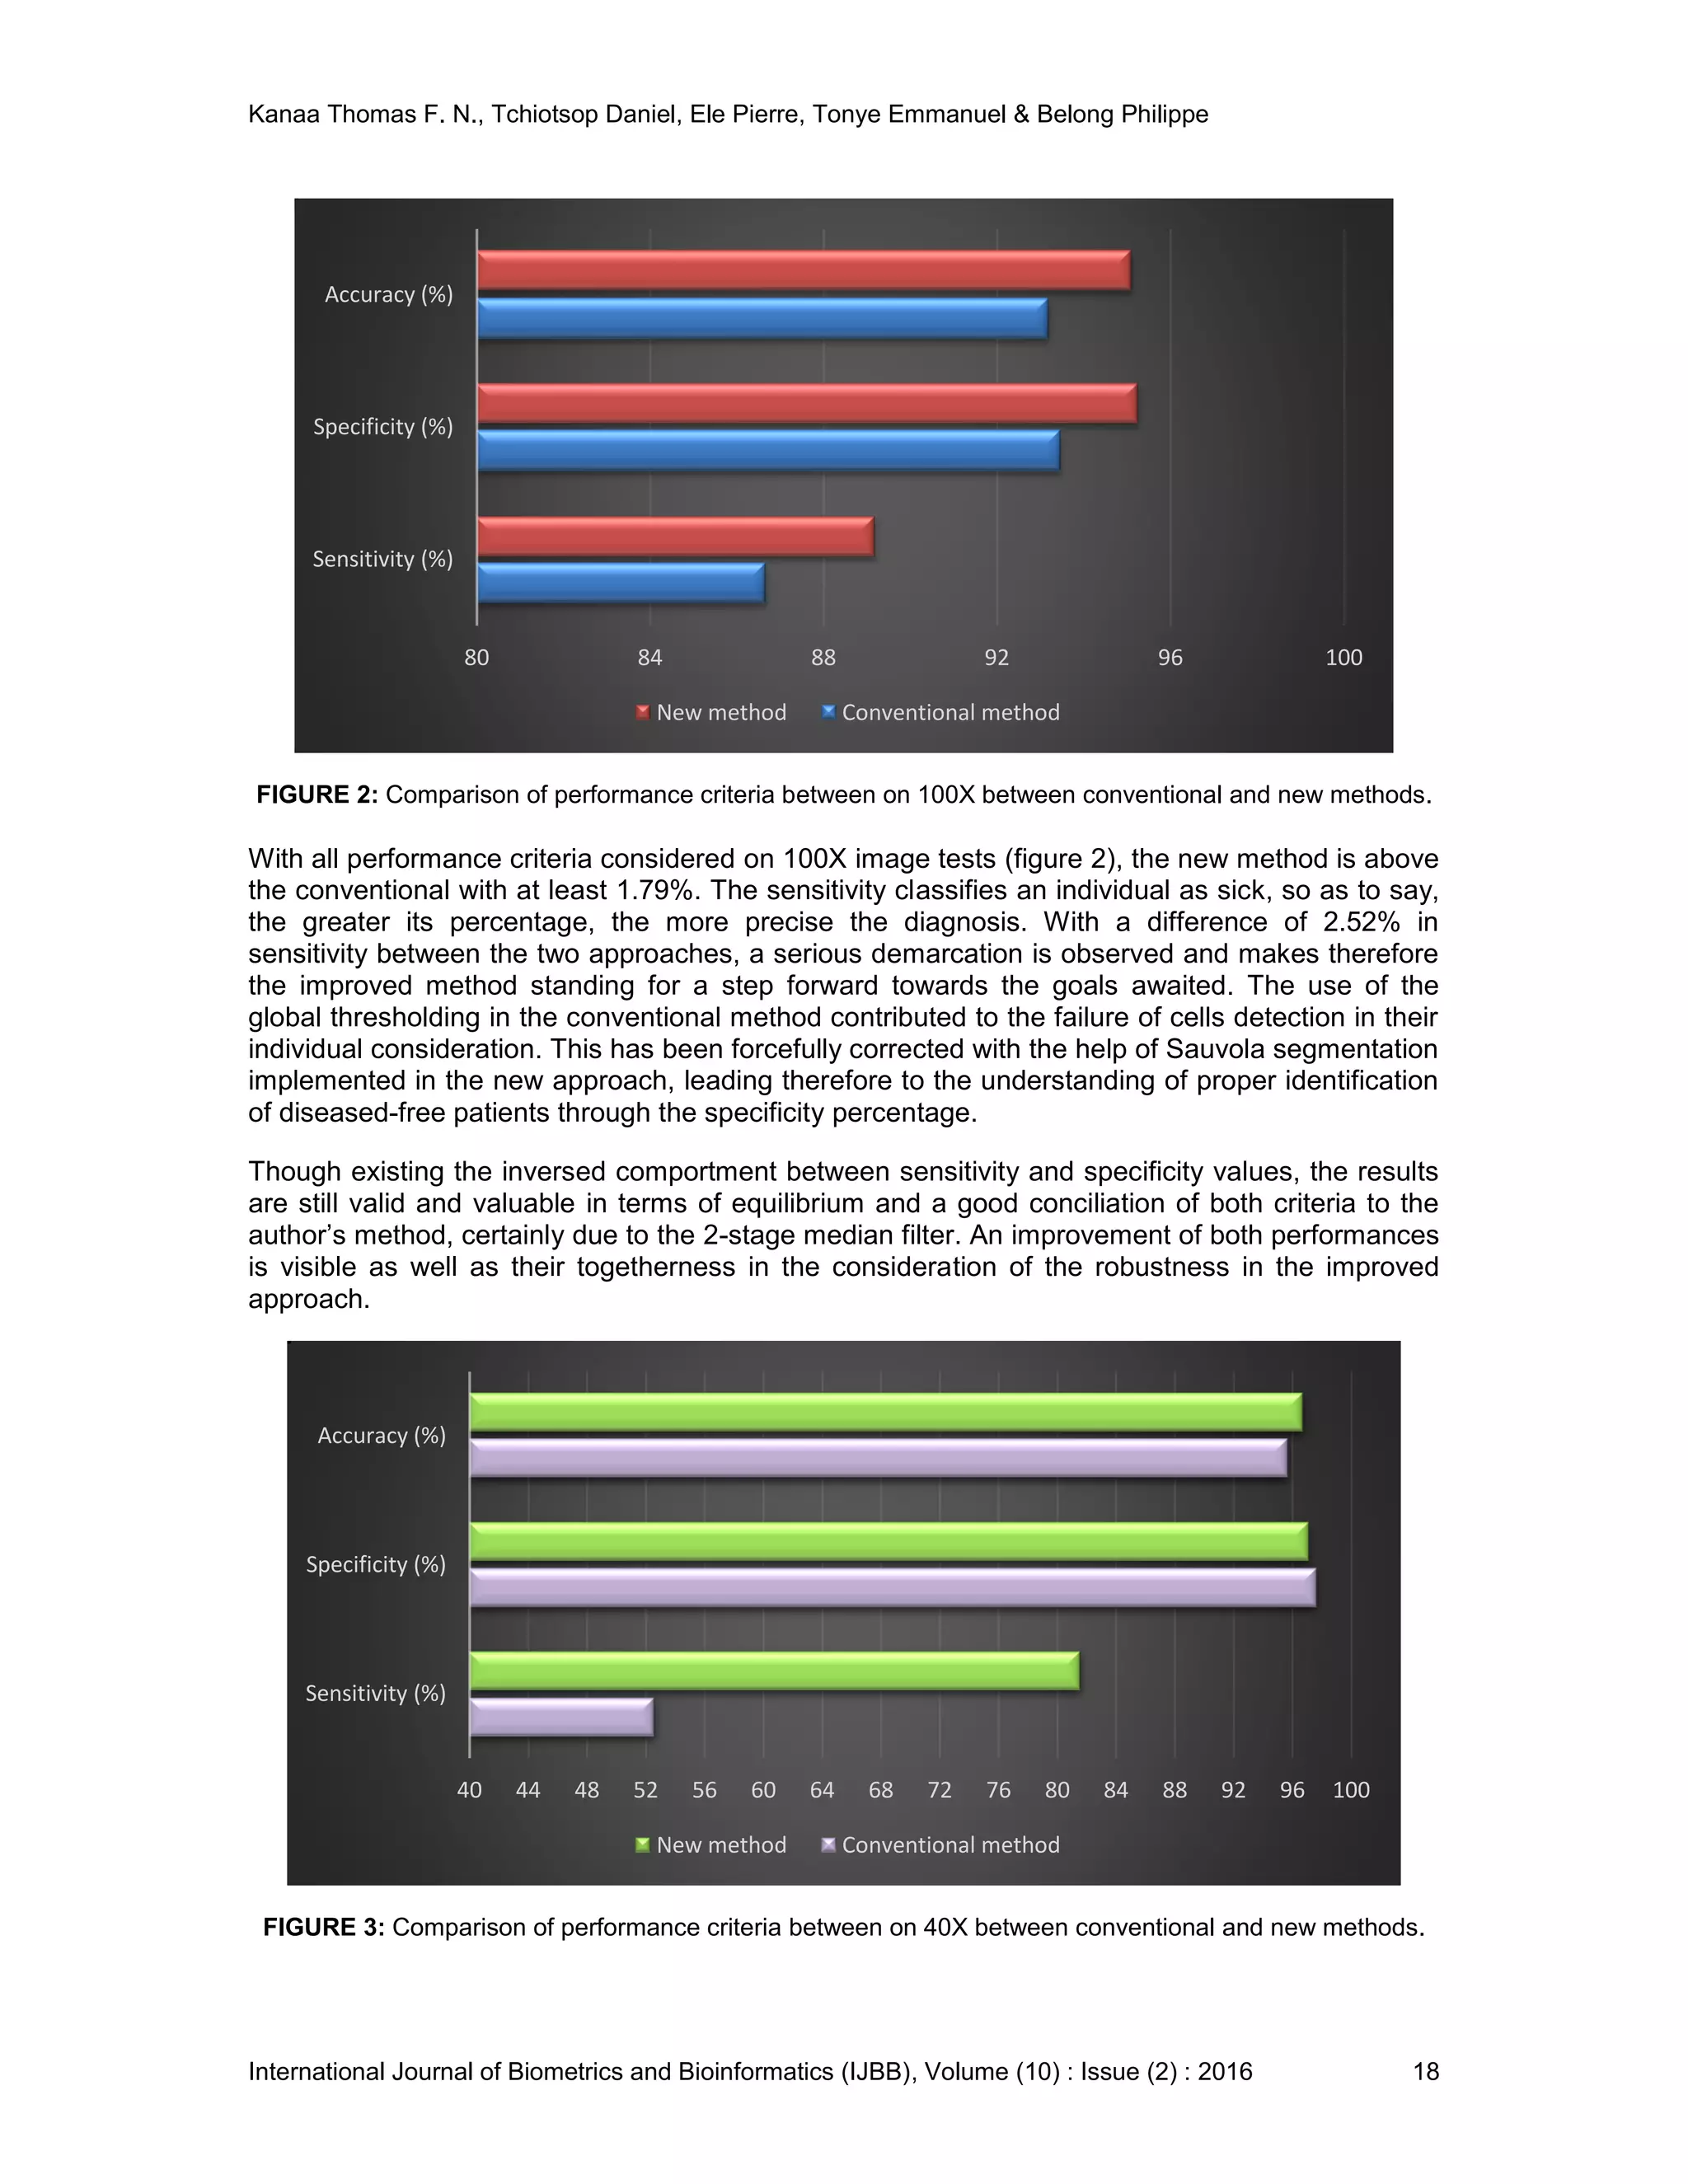
3.2 Results and Discussion
The conventional and new methods have been deployed simultaneously on the same database
for the step by step comparison. The histograms portray the improvement due to the 2-stage
median filtering. Moreover, the binary image obtained with classical approach has some cells
stuck together and many are absent because of their obliteration as a result of a poor
segmentation. The robustness of Sauvola segmentation method has led to an extraction of
numerous cells therefore allowing a richer diagnosis. After classification and counting, the
parasitemia are estimated and the results for both laboratory and automatic processes selected
randomly are presented in table 1.
FIGURE 1: Original microscopic images of blood smears, serial number 16 both 100X (a)
and 40X (b) magnifications.
(a) Image 10016
(b) Image 4016](https://image.slidesharecdn.com/ijbb-240-170401115536/75/Automated-Diagnosis-of-Malaria-in-Tropical-Areas-Using-40X-Microscopic-Images-of-Blood-Smears-5-2048.jpg)
![Kanaa Thomas F. N., Tchiotsop Daniel, Ele Pierre, Tonye Emmanuel & Belong Philippe
International Journal of Biometrics and Bioinformatics (IJBB), Volume (10) : Issue (2) : 2016 17
40X magnification
Laboratory
approach
100X magnification
Image
sample
Automatic approach Image
sample
Automatic approach
Classical New Classical New
407 2.22 1.92 1.81 1007 2.08 4
4013 8.33 3.70 1.72 10013 4.76 7.69
4016 0 0 4.87 10016 5.55 4.76
4017 2.94 4.25 2.00 10017 2.17 2.08
4022 4.08 6.94 2.94 10022 7.01 8.69
4025 2.22 9.23 3.27 10025 11.53 16.36
4029 8.33 9.61 2.85 10029 10.52 17.54
4033 4.65 10.86 2.56 10033 15 10.86
4036 16.27 4.83 3.57 10036 9.25 2.43
4042 7.69 10 8.88 10042 8.69 8.69
4046 14.28 3.22 3.44 10046 10.41 12.96
4050 7.69 11.11 2.94 10050 11.53 6.66
TABLE 1: Parasitemia (in %) estimation results of laboratory and automatic (conventional and new)
methods on both 40X and 100X magnification images.
Three major measurements expressed in terms of true positives (TP), false positives (FP), true
negative (TN) and false negatives (FN), are used to evaluate the algorithm performances of the
automatic methods for both 40X and 100X [34], especially sensitivity, specificity and accuracy
(table 2).
Magnification
range
Performance measurements
Designation Conventional method New method
100X
Sensitivity (%) 86.67 89.19
Specificity (%) 93.46 95.25
Accuracy (%) 93.19 95.10
40X
Sensitivity (%) 52.63 81.58
Specificity (%) 97.65 97.11
Accuracy (%) 95.67 96.71
TABLE 2: Performance results from the two methods according to the magnifications 100X and 40X.](https://image.slidesharecdn.com/ijbb-240-170401115536/75/Automated-Diagnosis-of-Malaria-in-Tropical-Areas-Using-40X-Microscopic-Images-of-Blood-Smears-6-2048.jpg)
![Kanaa Thomas F. N., Tchiotsop Daniel, Ele Pierre, Tonye Emmanuel & Belong Philippe
International Journal of Biometrics and Bioinformatics (IJBB), Volume (10) : Issue (2) : 2016 19
A glance at the sensitivity shows on how the ability of the 40X test (figure 3), to correctly classify
a patient as diseased, is well pronounced than the one of the conventional method. The
conventional method produces successfully, at the highest percentage, a true negative when
used in a non-infected population. With a negligible difference in specificity, our approach
continues to faithfully convince in the diagnosis exercise. And so, the detection and the estimation
of the parasitemia is well opened. Since the accuracy of the method involves at the same time the
sensitivity and the specificity, the improved system globally performs at 40X. Therefore, an acute
appreciation of the improved method allows the tests carried out on the patients to be valid and
powerfully persuasive.
FIGURE 4: Comparison of performance criteria between 100X classical and 40X new.
With poor results observed on the performance criteria of the conventional method on 40X
magnification, it appears clearly that the classical approach is not adapted for that magnification.
On the contrary, the comparison of the conventional method in 100X and the new in 40X
magnification, portrays that the performances of the improved system are challenging the
classical one, with high difference and from two criteria (accuracy and specificity) over three,
while the third (sensitivity) is maintained advanced in 100X. This is therefore opening a positive
greater inquisition in the diagnosis with 40X magnification.
We then noticed that our results with the new approach are close to that obtained with automated
detection of malarial pigment from a haematology analyser [16] and with quantitative buffy coat
[10]. Concerning automated diagnosis of malaria, beyond the effect parameters related to the
database (magnification range, size, sensor characteristics, …), the quality of the processing
mainly depends on the relevancy of its flow chart, especially the preprocessing approach, the
RBC segmentation method, the features extracted and the classification technique used. The
authors have innovated on all these steps compared to the conventional method deployed.
The relative supremacy of the new approach performed on 40X magnification compared to the
conventional applied on 100X, is an indication of its superiority on the understanding of most of
literature results from the use of 100X. The new system keeps ahead in accuracy with a
difference of 19.52% and 5.59% competed with Yunda [17] and Pramit [22] works respectively.
The first is based on morphological gradient method, Agnes and K-Median, color features and
textural, multilayer perception. Without considering the last step, the other approaches are very
conventional to challenge our preprocessing and segmentation techniques. The second deals
with Laplacian filtering on the 3 color components, global thresholding, minimal pixel intensity
distance. The classifier looks not sufficiently sturdy to produce strong results.
70 75 80 85 90 95 100
Sensitivity (%)
Specificity (%)
Accuracy (%)
New method Conventional method](https://image.slidesharecdn.com/ijbb-240-170401115536/75/Automated-Diagnosis-of-Malaria-in-Tropical-Areas-Using-40X-Microscopic-Images-of-Blood-Smears-8-2048.jpg)
![Kanaa Thomas F. N., Tchiotsop Daniel, Ele Pierre, Tonye Emmanuel & Belong Philippe
International Journal of Biometrics and Bioinformatics (IJBB), Volume (10) : Issue (2) : 2016 20
The new algorithm also improves in specificity with 8.6%, 9.11%, 3.94% and 0.11%, respectively
from Das [17], Puwar [17], Savkare [18] and Maitethia [20] techniques. The first is a compilation
of gray world assumption, geometric mean filter, marker controlled watershed algorithm, 80
textural and 16 morphological features, SVM classifier. The technique is well elaborated but the
great number of features should not always be a cause of efficiency. The second author
combines local histogram equalization, energy minimization, pixel intensity, K-mean clustering.
The third implemented the image smoothening and edge sharpening with the median and
Laplacian filters, global Otsu thresholding, geometrical and color and statistical features, support
vector machine for cell classification. The fourth algorithm combines means and median filtering,
Otsu and Zack thresholding, texture and color features, Artificial Neural Network. The global
thresholding has proved its limits on sensitive object detection. The authors think the choice of
the two-stage adaptive median filter and the Sauvola thresholding have been appropriate for the
closeness of the red blood cell segmentation. The use of the form factor as the unique feature for
cell classification to achieve the process has also been very persuasive. It has reinforced the
class of workmanship deployed in [33].
On 100X magnification range, the author’s method generated a sensitivity almost equal to the
content based image algorithms [21]. And so, whiles the preprocessing and segmentation steps
are common, a final classification based on an interesting two-stage binary tree-classifier is used
to fight the results back. The narrow variation of this sensitivity is increased with the Bayes
Decision theory to build a two stage erythrocyte classifier based for measurement of malaria [23].
Fortunately, the sensitivity of 40X images is very promising according to that of 100X images for
the conventional method and that of the mean value calculated from Razzak’s works [17].
Specificity and accuracy outclass several results produced by the previous methods both on 40X
and 100X magnification ranges [18,22]. Our execution time for 40X images is 48 seconds while
that of 100X images is 344, meaning a reduction ratio of 86%. We finally gained more time and
money with 40X magnification than with 100X since microscopes attributed to the first are
cheaper than those to the second.
4. CONCLUSION
We have completed a conventional approach and proposed a new one for improvement for
comparison on the common ground and optical bases. The works revealed that automation of
malaria diagnosis is essential and possible by using a 40X microscope. The process becomes
then cheap compared to the usual 100X microscope acquisition system in most medical centers.
We have provided a reliable and efficient algorithm compared with some other previous works
found in the same issues by image processing. The proposed algorithm performance is obviously
improved in figures and in execution time. Our results are opening a thinking on a
reconsideration about the coupling of accuracy of a method and cheapness of its implementation.
This is therefore highlighting the possibility in automation of malaria diagnosis for low-income
countries in most tropical and sub-tropical countries in Africa and America.
5. REFERENCES
[1] Arash Mehrjou, Tooraj Abbasian, Maziar Izadi. ‘‘Automatic malaria diagnosis system.’’
Robotics and Mechatronics (ICRoM), First RSI/ISM International Conference. Tehran,
Iran, 2013.
[2] Elizabeth A. Ashley, Khin Maung Lwin, Rose McGready, Win Htay Simon, Lucy Phaiphun,
Stephane Proux, Nantawan Wangsean, Walter Taylor, Kasia Stepniewska, Wimon
Nawamaneerat, Kyaw Lay Thwai, Marion Barends, Wattana Leowattana, Piero Olliaro,
Pratap Singhasivanon, Nicholas J. White and Francois Nosten. ‘‘An open label randomized
comparison of mefloquine– artesunate as separate tablets vs. a new co-formulated
combination for the treatment of uncomplicated multidrug-resistant falciparum malaria in
Thailand.’’ Tropical Medicine and International Health – vol. 11 no 11, pp 1653 –1666, 2006.
[3] Stephen Y. Gbedema, Marcel T. Bayor, Kofi Annan, Colin W. Wright. ‘‘Clerodane diterpenes
from Polyalthia longifolia (Sonn) Thw. var. pendula: Potential antimalarial agents for drug](https://image.slidesharecdn.com/ijbb-240-170401115536/75/Automated-Diagnosis-of-Malaria-in-Tropical-Areas-Using-40X-Microscopic-Images-of-Blood-Smears-9-2048.jpg)
![Kanaa Thomas F. N., Tchiotsop Daniel, Ele Pierre, Tonye Emmanuel & Belong Philippe
International Journal of Biometrics and Bioinformatics (IJBB), Volume (10) : Issue (2) : 2016 21
resistant Plasmodium falciparum infection.’’ Journal of Ethnopharmacology 169, 176 – 182,
2015.
[4] Snow R.W. and Gilles H. M. ‘‘The epidemiology of malaria - Essential malariology. 4th
edition. London, New York, 2002.
[5] Saad H. Abdalla and Geoffrey Pasvol. ‘‘Malaria: A Hematological Perspective.’’ Tropical
Medecine Science and Practice, Vol.4. Ed. Imperial College Faculty of Medicine, 2004,16
pgs.
[6] D. C. Warhurst, J. E. Williams. ‘‘Laboratory diagnosis of malaria.’’ Journal of Clinical
Pathology (J Clin Pathol) Vol.49, pp 533-538, 1996.
[7] Janet Cox-Singh, Timothy M. E. Davis, Kim-Sung Lee, Sunita S. G. Shamsul, Asmad
Matusop, Shanmuga Ratnam, Hasan A. Rahman, David J. Conway, and Balbir Singh.
‘‘Plasmodium knowlesi malaria in humans is widely distributed and potentially life
threatening. Clinical Infectious Diseases.’’ Vol. 46 (2), pp165–171, 2008.
[8] World Health Organization. World Malaria Report. WHO Global Malaria Programme. World
Health Organization, Geneva, Meeting of 11 - 13 Sept. 2013.
[9] Christophe Antonio-Nkondjio, Jean Atangana, Cyrille Ndo, Parfait Awono-Ambene, Etienne
Fondjo, Didier Fontenille, Frederic Simard. ‘‘Malaria transmission and rice cultivation in
Lagdo, northern Cameroon.’’ Transactions of the Royal Society of Tropical Medecine and
Hygiene 102, 352 – 359, 2008.
[10] Chotivanich K., Silamut K. and Day, N. P. J. ‘‘Laboratory diagnosis of malaria infection- A
short review of methods.’’ New Zealand Journal of Medical Laboratory Science, vol. 61, pp.
4-7, 2007.
[11] M.T. Makler, R.C Piper, W.K Milhous. ‘‘Lactate Dehydrogenase and the Diagnosis of
Malaria.’’ Elsevier Journal, Parasitology International, Vol. 14, Issue 9: pp 376–377, 1998.
[12] G.O. Adeoye, I.C. Nga. ‘‘Comparison of Quantitative Buffy Coat technique (QBC) with
Giemsa-stained thick film (GTF) for diagnosis of malaria.’’ Elsevier Journal, Parasitology
International, Vol. 56, Issue 4: pp 308–312, 2007.
[13] Clendennen, T.E., Long, G.W. and Baird, K. J. ‘‘QBC and Giemsa stained thick blood films:
diagnostic performance of laboratory technologists.’’ Trans. R. Soc. Trop. Med. Hyg., vol.
89, issue 2: pp 183–184, 1995.
[14] Anthony Moody. ‘‘Rapid Diagnostic Tests for Malaria Parasites.’’ Clinical Microbiology
Review. Vol. 15 no.1: pp 66-78, 2002.
[15] Hanscheid T., Melo-Cristino J. and Pinto, B. G. ‘‘Automated detection of malaria pigment in
white blood cells for the diagnosis of malaria in Portugal.’’ American Journal of Tropical
Medicine and Hygiene, vol. 64: issue 5, pp. 290-292, 2001.
[16] C. Fourcade, M. J. C. Casbas, H. Belaouni, J. J. D. Gonzalez, P. J. J. Garcia, M. A. E.
Pepio. ‘‘Automated detection of malaria by means of the haematology analyser
Coulter® GEN.STM.’’ International Journal of Laboratory Hematology, Clinical & Laboratory
Haematology, Vol. 26: Issue 6, pp 367–372, 2004.
[17] M. I. Razzak. ‘‘Automatic Detection and Classification of Malarial Parasite.’’ International
Journal of Biometrics and Bioinformatics (IJBB), Vol.9: Issue 1, pp 1-12, 2015.](https://image.slidesharecdn.com/ijbb-240-170401115536/75/Automated-Diagnosis-of-Malaria-in-Tropical-Areas-Using-40X-Microscopic-Images-of-Blood-Smears-10-2048.jpg)
![Kanaa Thomas F. N., Tchiotsop Daniel, Ele Pierre, Tonye Emmanuel & Belong Philippe
International Journal of Biometrics and Bioinformatics (IJBB), Volume (10) : Issue (2) : 2016 22
[18] S. S. Savkare, S. P. Narote. ‘‘Automatic Detection of Malaria Parasites for Estimating
Parasitemia.’’ International Journal of Computer Science and Security (IJCSS), Vol.5: pp
310-315, 2011.
[19] Pranati Rakshi and Kriti Bhowmik. ‘‘Detection of presence of Parasites in Human RBC In
Case of Diagnosing Malaria Using Image Processing.’’ Proceedings of the 2013 IEEE
Second International Conference on Image Information Processing (ICIIP-2013), 2013.
[20] Daniel Maitethia. ‘‘A rapid malaria diagnostic method based on automatic detection and
classification of plasmodium parasites in stained thin blood smear images “, M.Sc. Thesis,
the University of Nairobi, Kenya, 2014.
[21] Mohammad Imroze Khan, Bhibhudendra Acharya, Bikesh Kumar Singh, Jigyasa Soni.
‘‘Content Based Image Retrieval Approaches for Detection of Malarial Parasite in Blood
Images.’’ International Journal of Biometrics and Bioinformatics (IJBB), Vol. 5: Issue 2: pp
97-110, 2011.
[22] Pramit Ghosh, Debotosh Bhattacharjee, Mita Nasipuri, Dipak Kumar Basu. ‘‘Medical Aid for
Automatic Detection of Malaria.’’ Communications in Computer and Information Science
(CCIS), Vol. 245, pp 170-178, 2002.
[23] Dian Anggraini, Anto Satriyo Nugroho, Christian Pratama, Ismail Ekoprayitno Rozi, Vitria
Pragesjvara, Made Gunawan. ‘‘Automated Status Identification of Microscopic Images
Obtained from Malaria Thin Blood Smears using Bayes Decision: A study case in
Plasmodium Falciparum.’’ Proceedings of International Conference on Advanced Computer
Science & Information Systems, Bandung, Indonesia, 2011.
[24] Pooja R. Patil, G. S. Sable, Gauri Anandgaonnkar. ‘‘Counting of WBCs and RBCs from
blood images using gray thresholding.’’ International Journal of Research in Engineering and
Technology (IJRET), Vol. 3, Issue 4: pp 391-395, 2014.
[25] Pawan Agrawal, Pradipti Verma. ‘‘Automated Detection and Counting of Red Blood Cell
using image processing techniques.’’ International Journal of Scientific Research and
Management (IJSRM) Vol. 3 Issue 4: pp 2692-2695, 2015.
[26] World Health Organization. Bench Aids for the diagnosis of Malaria infections. WHO Global
Malaria Programme, Geneva, Switzerland, 24 pgs, 2000.
[27] Mamta Juneja and Rajni Mohana. ‘‘An Improved Adaptive Median Filtering Method for
Impulse Noise Detection.’’ International Journal of Recent Trends in Engineering. Vol.1(1):
pp 274-278, 2009.
[28] Thomas F. N. Kanaa, E. Tonye, G. Mercier, V. Onana. ‘‘Détection des nappes
d’hydrocarbures dans les images RSO par morphologie mathématique.’’ Teledetection,
vol.3, pp 215-229, 2004.
[29] Rafael C. Gonzalez, Richard E. Woods and Steven L. Eddins (2009). Digital Image
Processing Using MATLAB, 2nd Edition. Gatesmark Publishing LLC.
[30] O. Imocha Singh, Tejmani Sinam, O. James and T. Romen Singh. ‘‘Local Contrast and
Mean based Thresholding Technique in Image Binarization.’’ International Journal of
Computer Applications (0975 – 8887) Vol.51, No.6, 2012.
[31] Faisal Shafait, Daniel Keysers and Thomas M. Breuel. ‘‘Efficient Implementation of Local
Adaptive Thresholding Techniques Using Integral Images.’’ Conference Proceedings SPIE,
Vol. 6815, 681510, 2008.](https://image.slidesharecdn.com/ijbb-240-170401115536/75/Automated-Diagnosis-of-Malaria-in-Tropical-Areas-Using-40X-Microscopic-Images-of-Blood-Smears-11-2048.jpg)
![Kanaa Thomas F. N., Tchiotsop Daniel, Ele Pierre, Tonye Emmanuel & Belong Philippe
International Journal of Biometrics and Bioinformatics (IJBB), Volume (10) : Issue (2) : 2016 23
[32] Abdelrahman A. & Abdallah A. ‘‘Signature verification system based on support vector
machine classifier.’’ the international arab conference on information technology (acit’2013),
2013.
[33] R. Renuka Devi, V. Rajagopal, M. Senthil Kumar and G. Magesh. ‘‘Computerized Shape
Analysis Of Erythrocytes And Their Formed Aggregates In Patients Infected With P. Vivax
Malaria.’’ Advanced Computing: An International Journal (ACIJ), Vol.2, No.2, pp71-77, 2011.
[34] Milan Sonka, J. Michael Fitzpatrick. ‘‘Handbook of Medical Imaging - Medical Image
Processing and Analysis.’’ Volume 2. Bellingham, Washington: SPIE Press, USA, 2009.](https://image.slidesharecdn.com/ijbb-240-170401115536/75/Automated-Diagnosis-of-Malaria-in-Tropical-Areas-Using-40X-Microscopic-Images-of-Blood-Smears-12-2048.jpg)


![Report[1]](https://cdn.slidesharecdn.com/ss_thumbnails/a0025143-a91c-4ca3-a68a-349c5c7a3a31-150209111721-conversion-gate02-thumbnail.jpg?width=640&height=640&fit=bounds)