SlideShare a Scribd company logo
1 of 7
Download to read offline
Panda Express
     1455 McCarthy Blvd.
      Milpitas, CA 95035
      Tel: 408.955.9900
      Fax: 408.383.9887


Corporate Lease Terms 
    Original ten (10) year primary lease until Oct 2015
    NNN (Triple Net Lease)
    10% rent increase every 5 years
    Three (3)-5 year options

                      : ±2,406 SQ.FT.                             : $1,438,788

              : 6.60% (until Oct 18,2010); 7.25% (starting Oct 19, 2010)

                  :   $94,792    Year 1-5 (Oct 2005-Oct 2010)
                      $104,300   Year 6-10 (Oct 2010-Oct 2015)
               $114,671.76 Years 11-15            $126,196.56 Years 16-20
               $ 138,873.84 Years 21-25

            JOHN LUK                                 JOYCE SUN
            408.955.9900                             510.552.7711
                      DRE#00877964                      DRE#01365523
Panda Express

   One of the largest fast casual restaurant chain serving Americanized Chinese cuisine, Panda
     Express operates mainly in casinos, shopping malls, supermarkets, airports,train stations, strip
     plazas, theme parks, stadiums, college campuses and The Pentagon. In 2004, the company
     began opening stand-alone restaurants with drive-through windows. Panda Express has 1264
     restaurants covering 38 states and Puerto Rico, as well as 2 locations in Japan. Panda Express
     is headquartered in Rosemead, California.

   The company is currently in expansion. Same store sales have increased every year since
     1996 with annual sales in 2008 in excess of $1 billion. Panda Express added 161 new loca-
     tions in 2008 throughout the United States and will oper-
     ate well over 1,200 restaurants in 2009.

DEMOGRAPHICS

                      1 Mile          3 Mile        5 Mile
     Population
                      13,667         161,244        301,731

     AVG HH
                     $101,283        $89,078        $89,090
      Income
      Daytime
     Population       21,735         130,721        255,752


           JOHN LUK                                           JOYCE SUN
           408.955.9900                                       510.552.7711
The space is part of a 133,886 SQ.FT.
Target project, which opened in Oct of
2002. Convenient access from Highway
880.
REAL ESTATE DEVELOPERS
MapInfo Corporation®
   Updated Summary Report (%)
      Prepared by: AnySite


   Whipple Rd & Industrial Pkwy Sw Hayward, CA 94544
   4/26/2007                                                                           Coordinates Longitude:    -122.065030
                                                                                                     Latitude:   37.607220
                                                                            1 MILE                3 MILE               5 MILE
                                                                             RING                  RING                 RING
                                                                          3.14 SQ/MI            28.27 SQ/MI          78.53 SQ/MI


   POPULATION
    1990 Total Population                                                            9,480           130,632               246,235
    2000 Total Population                                                           12,879           156,835               294,267
    2006 Total Population                                                           13,667           161,244               301,731
    2011 Total Population                                                           14,099           165,295               309,206
   % Population Change 1990-2000                                                   35.85%            20.06%                19.51%
   % Population Change 2000-2006                                                    6.12%             2.81%                 2.54%
   % Population Change 2006-2011                                                    3.16%             2.51%                 2.48%

   HOUSEHOLDS
    1990 Total Households                                                            2,942             40,905               82,239
    2001 Total Households                                                            3,633             45,594               91,480
    2006 Total Households                                                            4,050             49,319               98,908
    2011 Total Households                                                            4,117             50,155              100,705
   % Households Change 1990-2000                                                   23.49%             11.46%               11.24%
   % Households Change 2000-2006                                                   11.48%              8.17%                8.12%
   % Households Change 2006-2011                                                    1.65%              1.70%                1.82%

   2006 RACE
   White Population                                                                  4,252            54,794               121,392
   Black Population                                                                  1,030            11,744                23,374
   American Indian/Alaska Native                                                        65             1,068                 2,067
   Asian/Hawaiian/Pacific Islander                                                   6,212            58,306                91,778
   Other Race Population                                                             2,107            35,332                63,121
   Hispanic Population                                                               2,840            48,622                89,409
   Non-Hispanic Population                                                          10,827           112,622               212,322

   2006 INCOME
   Per Capita Income                                                               $30,014           $27,246               $29,204
   Median Household Income                                                         $86,312           $73,858               $72,622
   Average Household Income                                                       $101,283           $89,078               $89,090

   2006 Average Household Size                                                          3.3                3.3                  3.0
   2006 Total Owner Occupied Housing Units                                           3,393             34,283               63,540
   2006 Total Renter Occupied Housing Units                                            660             15,038               35,352

   2006 Total Establishments                                                         1,146             6,003                13,500
   2006 Total Daytime Work Population                                               12,869            47,433               105,789
   2006 Total Daytime Population                                                    21,735           130,721               255,752


Data Source: MapInfo Corporation
© 2006 MapInfo Corporation, Troy, New York. All rights reserved. 1-800-489-8829                                            Page 1
MapInfo Corporation®
   Updated Summary Report (%)
      Prepared by: AnySite


   Whipple Rd & Industrial Pkwy Sw Hayward, CA 94544
   4/26/2007                                                                           Coordinates Longitude:      -122.065030
                                                                                                     Latitude:     37.607220
                                                                            1 MILE                3 MILE                 5 MILE
                                                                             RING                  RING                   RING
                                                                          3.14 SQ/MI            28.27 SQ/MI            78.53 SQ/MI


   2006 EDUCATIONAL ATTAINMENT
   Total Educational Attainment Age 25+                                              8,794           100,986                 191,038
   Less Than 9th Grade                                                                 732            10,552                  17,355
   High School No Diploma                                                              835            10,551                  18,985
   High School Graduate (Incl Equivalency)                                           1,920            23,873                  44,451
   Some College No Degree                                                            1,875            20,773                  39,901
   Associate Degree                                                                    861             8,161                  15,233
   Bachelor's Degree                                                                 1,943            19,402                  38,061
   Graduate or Prof School Degree                                                      626             7,674                  17,052

   % Total Educational Attainment Age 25+                                          64.34%             62.63%                 63.31%
   % Less Than 9th Grade                                                            8.33%             10.45%                  9.08%
   % No High School Diploma                                                         9.50%             10.45%                  9.94%
   % High School Graduate (Incl Equivalency)                                       21.84%             23.64%                 23.27%
   % Some College                                                                  21.33%             20.57%                 20.89%
   % Associate Degree                                                               9.79%              8.08%                  7.97%
   % Bachelor's Degree                                                             22.10%             19.21%                 19.92%
   % Graduate or Prof School Degree                                                 7.12%              7.60%                  8.93%

   2006 Median Age Total Population                                                    36                     33                     33
   2006 Median Age Female Pop                                                          37                     35                     34
   2006 Median Age Male Pop                                                            35                     32                     32

   2006 MARITAL STATUS
   % Never Married                                                                 28.64%             29.03%                 29.22%
   % Currently Married                                                             58.02%             58.55%                 57.66%
   % Divorced                                                                       7.81%              7.36%                  8.29%
   % Widowed                                                                        5.55%              5.07%                  4.83%
   % Separated                                                                      1.20%              1.79%                  1.88%

   2006 Median Home Value                                                         $397,970          $344,856               $353,575


Data Source: MapInfo Corporation
© 2006 MapInfo Corporation, Troy, New York. All rights reserved. 1-800-489-8829                                              Page 2

More Related Content

What's hot

Home sales increased last year january 2012
Home sales increased last year january 2012Home sales increased last year january 2012
Home sales increased last year january 2012Matt Collinge
 
Australian Residential Property Presentation14 04 2009
Australian Residential Property Presentation14 04 2009Australian Residential Property Presentation14 04 2009
Australian Residential Property Presentation14 04 2009Ivan Kaye
 
Hindalco Industries Limited, Renukoot
Hindalco Industries Limited, RenukootHindalco Industries Limited, Renukoot
Hindalco Industries Limited, RenukootIndia Water Portal
 
Wellington Business Keynote - Paul Callaghan
Wellington Business Keynote - Paul CallaghanWellington Business Keynote - Paul Callaghan
Wellington Business Keynote - Paul CallaghanVincent Kwon
 
Energy Efficiency Policy Trends, Pinch-Points, and Prospects: Toto, I’ve a Fe...
Energy Efficiency Policy Trends, Pinch-Points, and Prospects: Toto, I’ve a Fe...Energy Efficiency Policy Trends, Pinch-Points, and Prospects: Toto, I’ve a Fe...
Energy Efficiency Policy Trends, Pinch-Points, and Prospects: Toto, I’ve a Fe...Alliance To Save Energy
 
Bc Homes Sales Edge Lower in July 2011
Bc Homes Sales Edge Lower in July 2011Bc Homes Sales Edge Lower in July 2011
Bc Homes Sales Edge Lower in July 2011Matt Collinge
 
Google student survey p4
Google student survey p4Google student survey p4
Google student survey p4liana1995
 
How NYC Fared After 9 11
How NYC Fared After 9 11How NYC Fared After 9 11
How NYC Fared After 9 11ruthtrojan
 
Health care spending slides mili - schoenman
Health care spending slides   mili - schoenmanHealth care spending slides   mili - schoenman
Health care spending slides mili - schoenmannihcm
 
Middlesex Water Company Shareholder Presentation
Middlesex Water Company Shareholder PresentationMiddlesex Water Company Shareholder Presentation
Middlesex Water Company Shareholder PresentationCompany Spotlight
 
From Recession to Recovery to... What?
From Recession to Recovery to... What?From Recession to Recovery to... What?
From Recession to Recovery to... What?Brent Reid
 
2012 02 Vreb Statistics Statistical Digest (2)
2012 02 Vreb Statistics  Statistical Digest (2)2012 02 Vreb Statistics  Statistical Digest (2)
2012 02 Vreb Statistics Statistical Digest (2)Tara Lynn
 
Mili slides schoenman
Mili slides schoenmanMili slides schoenman
Mili slides schoenmannihcm
 
walt disney Quarter 2006 4th
walt disney  Quarter 2006 4thwalt disney  Quarter 2006 4th
walt disney Quarter 2006 4thfinance7
 
MyTownCryer Mid Year 2010 Analysis
MyTownCryer Mid Year 2010 AnalysisMyTownCryer Mid Year 2010 Analysis
MyTownCryer Mid Year 2010 AnalysisTom Cryer
 
Tourism Marketing Levy - Case for the Whitsundays
Tourism Marketing Levy - Case for the WhitsundaysTourism Marketing Levy - Case for the Whitsundays
Tourism Marketing Levy - Case for the WhitsundaysMidwood Australia
 
2011 Real Estate Outlook
2011 Real Estate Outlook2011 Real Estate Outlook
2011 Real Estate Outlookglogan56
 
Tighter regulations trim sales BCREA 2012 09
Tighter regulations trim sales BCREA 2012 09Tighter regulations trim sales BCREA 2012 09
Tighter regulations trim sales BCREA 2012 09Matt Collinge
 

What's hot (20)

Home sales increased last year january 2012
Home sales increased last year january 2012Home sales increased last year january 2012
Home sales increased last year january 2012
 
Australian Residential Property Presentation14 04 2009
Australian Residential Property Presentation14 04 2009Australian Residential Property Presentation14 04 2009
Australian Residential Property Presentation14 04 2009
 
Hindalco Industries Limited, Renukoot
Hindalco Industries Limited, RenukootHindalco Industries Limited, Renukoot
Hindalco Industries Limited, Renukoot
 
Wellington Business Keynote - Paul Callaghan
Wellington Business Keynote - Paul CallaghanWellington Business Keynote - Paul Callaghan
Wellington Business Keynote - Paul Callaghan
 
Energy Efficiency Policy Trends, Pinch-Points, and Prospects: Toto, I’ve a Fe...
Energy Efficiency Policy Trends, Pinch-Points, and Prospects: Toto, I’ve a Fe...Energy Efficiency Policy Trends, Pinch-Points, and Prospects: Toto, I’ve a Fe...
Energy Efficiency Policy Trends, Pinch-Points, and Prospects: Toto, I’ve a Fe...
 
Bc Homes Sales Edge Lower in July 2011
Bc Homes Sales Edge Lower in July 2011Bc Homes Sales Edge Lower in July 2011
Bc Homes Sales Edge Lower in July 2011
 
Google student survey p4
Google student survey p4Google student survey p4
Google student survey p4
 
How NYC Fared After 9 11
How NYC Fared After 9 11How NYC Fared After 9 11
How NYC Fared After 9 11
 
Dalkeith
DalkeithDalkeith
Dalkeith
 
Health care spending slides mili - schoenman
Health care spending slides   mili - schoenmanHealth care spending slides   mili - schoenman
Health care spending slides mili - schoenman
 
Middlesex Water Company Shareholder Presentation
Middlesex Water Company Shareholder PresentationMiddlesex Water Company Shareholder Presentation
Middlesex Water Company Shareholder Presentation
 
From Recession to Recovery to... What?
From Recession to Recovery to... What?From Recession to Recovery to... What?
From Recession to Recovery to... What?
 
2012 02 Vreb Statistics Statistical Digest (2)
2012 02 Vreb Statistics  Statistical Digest (2)2012 02 Vreb Statistics  Statistical Digest (2)
2012 02 Vreb Statistics Statistical Digest (2)
 
US Health System
US Health SystemUS Health System
US Health System
 
Mili slides schoenman
Mili slides schoenmanMili slides schoenman
Mili slides schoenman
 
walt disney Quarter 2006 4th
walt disney  Quarter 2006 4thwalt disney  Quarter 2006 4th
walt disney Quarter 2006 4th
 
MyTownCryer Mid Year 2010 Analysis
MyTownCryer Mid Year 2010 AnalysisMyTownCryer Mid Year 2010 Analysis
MyTownCryer Mid Year 2010 Analysis
 
Tourism Marketing Levy - Case for the Whitsundays
Tourism Marketing Levy - Case for the WhitsundaysTourism Marketing Levy - Case for the Whitsundays
Tourism Marketing Levy - Case for the Whitsundays
 
2011 Real Estate Outlook
2011 Real Estate Outlook2011 Real Estate Outlook
2011 Real Estate Outlook
 
Tighter regulations trim sales BCREA 2012 09
Tighter regulations trim sales BCREA 2012 09Tighter regulations trim sales BCREA 2012 09
Tighter regulations trim sales BCREA 2012 09
 

Similar to Panda Express

Quito Village, Saratoga Flyer
Quito Village, Saratoga FlyerQuito Village, Saratoga Flyer
Quito Village, Saratoga FlyerJohnluk
 
Virginia Economic Census Facts
Virginia Economic Census FactsVirginia Economic Census Facts
Virginia Economic Census FactsChuck Thompson
 
Census 2010 :: Presentation 09/12/11
Census 2010 :: Presentation 09/12/11Census 2010 :: Presentation 09/12/11
Census 2010 :: Presentation 09/12/11uipublicaffairs
 
Market research for Central
Market research for CentralMarket research for Central
Market research for Centralandy biggin
 
ICSC Technology Presentation
ICSC Technology PresentationICSC Technology Presentation
ICSC Technology Presentationsouthpace
 
Mackay Regional Profile
Mackay Regional ProfileMackay Regional Profile
Mackay Regional Profilechrislaval
 
Targeting tanzania 13_march
Targeting tanzania 13_marchTargeting tanzania 13_march
Targeting tanzania 13_marchAmos Omore
 
What is your most favorite sport
What is your most favorite sportWhat is your most favorite sport
What is your most favorite sportGONZALEZ_47
 
AD spending and new media Internet and Web measurement
AD spending and new mediaInternet and Web measurementAD spending and new mediaInternet and Web measurement
AD spending and new media Internet and Web measurementsergejsantos
 
Opportunities & Challenges for Minorities and Immigrants in the United States...
Opportunities & Challenges for Minorities and Immigrants in the United States...Opportunities & Challenges for Minorities and Immigrants in the United States...
Opportunities & Challenges for Minorities and Immigrants in the United States...Instituto Diáspora Brasil (IDB)
 
Austin Market Update January 2008
Austin Market Update January 2008Austin Market Update January 2008
Austin Market Update January 2008Dee Patience
 

Similar to Panda Express (20)

Quito Village, Saratoga Flyer
Quito Village, Saratoga FlyerQuito Village, Saratoga Flyer
Quito Village, Saratoga Flyer
 
Econ
EconEcon
Econ
 
Philippine poverty situationer 2010
Philippine poverty situationer 2010Philippine poverty situationer 2010
Philippine poverty situationer 2010
 
Charlotte's stats
Charlotte's statsCharlotte's stats
Charlotte's stats
 
Austin information
Austin informationAustin information
Austin information
 
Canada tax sumury 2012
Canada tax sumury 2012Canada tax sumury 2012
Canada tax sumury 2012
 
Virginia Economic Census Facts
Virginia Economic Census FactsVirginia Economic Census Facts
Virginia Economic Census Facts
 
Census 2010 :: Presentation 09/12/11
Census 2010 :: Presentation 09/12/11Census 2010 :: Presentation 09/12/11
Census 2010 :: Presentation 09/12/11
 
Market research for Central
Market research for CentralMarket research for Central
Market research for Central
 
Final macro eco
Final macro ecoFinal macro eco
Final macro eco
 
ICSC Technology Presentation
ICSC Technology PresentationICSC Technology Presentation
ICSC Technology Presentation
 
Mackay Regional Profile
Mackay Regional ProfileMackay Regional Profile
Mackay Regional Profile
 
2010 State of the Community
2010 State of the Community2010 State of the Community
2010 State of the Community
 
Canada taxation 2012
Canada taxation 2012Canada taxation 2012
Canada taxation 2012
 
Targeting tanzania 13_march
Targeting tanzania 13_marchTargeting tanzania 13_march
Targeting tanzania 13_march
 
What is your most favorite sport
What is your most favorite sportWhat is your most favorite sport
What is your most favorite sport
 
2011 Benchmark Study
2011 Benchmark Study2011 Benchmark Study
2011 Benchmark Study
 
AD spending and new media Internet and Web measurement
AD spending and new mediaInternet and Web measurementAD spending and new mediaInternet and Web measurement
AD spending and new media Internet and Web measurement
 
Opportunities & Challenges for Minorities and Immigrants in the United States...
Opportunities & Challenges for Minorities and Immigrants in the United States...Opportunities & Challenges for Minorities and Immigrants in the United States...
Opportunities & Challenges for Minorities and Immigrants in the United States...
 
Austin Market Update January 2008
Austin Market Update January 2008Austin Market Update January 2008
Austin Market Update January 2008
 

Panda Express

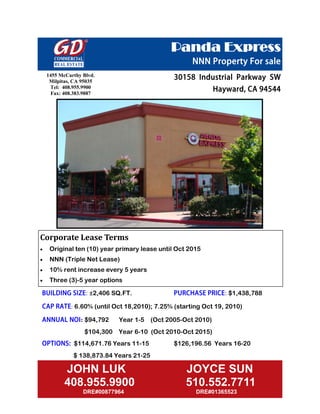
  • 1. Panda Express 1455 McCarthy Blvd. Milpitas, CA 95035 Tel: 408.955.9900 Fax: 408.383.9887 Corporate Lease Terms   Original ten (10) year primary lease until Oct 2015  NNN (Triple Net Lease)  10% rent increase every 5 years  Three (3)-5 year options : ±2,406 SQ.FT. : $1,438,788 : 6.60% (until Oct 18,2010); 7.25% (starting Oct 19, 2010) : $94,792 Year 1-5 (Oct 2005-Oct 2010) $104,300 Year 6-10 (Oct 2010-Oct 2015) $114,671.76 Years 11-15 $126,196.56 Years 16-20 $ 138,873.84 Years 21-25 JOHN LUK JOYCE SUN 408.955.9900 510.552.7711 DRE#00877964 DRE#01365523
  • 2. Panda Express  One of the largest fast casual restaurant chain serving Americanized Chinese cuisine, Panda Express operates mainly in casinos, shopping malls, supermarkets, airports,train stations, strip plazas, theme parks, stadiums, college campuses and The Pentagon. In 2004, the company began opening stand-alone restaurants with drive-through windows. Panda Express has 1264 restaurants covering 38 states and Puerto Rico, as well as 2 locations in Japan. Panda Express is headquartered in Rosemead, California.  The company is currently in expansion. Same store sales have increased every year since 1996 with annual sales in 2008 in excess of $1 billion. Panda Express added 161 new loca- tions in 2008 throughout the United States and will oper- ate well over 1,200 restaurants in 2009. DEMOGRAPHICS 1 Mile 3 Mile 5 Mile Population 13,667 161,244 301,731 AVG HH $101,283 $89,078 $89,090 Income Daytime Population 21,735 130,721 255,752 JOHN LUK JOYCE SUN 408.955.9900 510.552.7711
  • 3. The space is part of a 133,886 SQ.FT. Target project, which opened in Oct of 2002. Convenient access from Highway 880.
  • 6. MapInfo Corporation® Updated Summary Report (%) Prepared by: AnySite Whipple Rd & Industrial Pkwy Sw Hayward, CA 94544 4/26/2007 Coordinates Longitude: -122.065030 Latitude: 37.607220 1 MILE 3 MILE 5 MILE RING RING RING 3.14 SQ/MI 28.27 SQ/MI 78.53 SQ/MI POPULATION 1990 Total Population 9,480 130,632 246,235 2000 Total Population 12,879 156,835 294,267 2006 Total Population 13,667 161,244 301,731 2011 Total Population 14,099 165,295 309,206 % Population Change 1990-2000 35.85% 20.06% 19.51% % Population Change 2000-2006 6.12% 2.81% 2.54% % Population Change 2006-2011 3.16% 2.51% 2.48% HOUSEHOLDS 1990 Total Households 2,942 40,905 82,239 2001 Total Households 3,633 45,594 91,480 2006 Total Households 4,050 49,319 98,908 2011 Total Households 4,117 50,155 100,705 % Households Change 1990-2000 23.49% 11.46% 11.24% % Households Change 2000-2006 11.48% 8.17% 8.12% % Households Change 2006-2011 1.65% 1.70% 1.82% 2006 RACE White Population 4,252 54,794 121,392 Black Population 1,030 11,744 23,374 American Indian/Alaska Native 65 1,068 2,067 Asian/Hawaiian/Pacific Islander 6,212 58,306 91,778 Other Race Population 2,107 35,332 63,121 Hispanic Population 2,840 48,622 89,409 Non-Hispanic Population 10,827 112,622 212,322 2006 INCOME Per Capita Income $30,014 $27,246 $29,204 Median Household Income $86,312 $73,858 $72,622 Average Household Income $101,283 $89,078 $89,090 2006 Average Household Size 3.3 3.3 3.0 2006 Total Owner Occupied Housing Units 3,393 34,283 63,540 2006 Total Renter Occupied Housing Units 660 15,038 35,352 2006 Total Establishments 1,146 6,003 13,500 2006 Total Daytime Work Population 12,869 47,433 105,789 2006 Total Daytime Population 21,735 130,721 255,752 Data Source: MapInfo Corporation © 2006 MapInfo Corporation, Troy, New York. All rights reserved. 1-800-489-8829 Page 1
  • 7. MapInfo Corporation® Updated Summary Report (%) Prepared by: AnySite Whipple Rd & Industrial Pkwy Sw Hayward, CA 94544 4/26/2007 Coordinates Longitude: -122.065030 Latitude: 37.607220 1 MILE 3 MILE 5 MILE RING RING RING 3.14 SQ/MI 28.27 SQ/MI 78.53 SQ/MI 2006 EDUCATIONAL ATTAINMENT Total Educational Attainment Age 25+ 8,794 100,986 191,038 Less Than 9th Grade 732 10,552 17,355 High School No Diploma 835 10,551 18,985 High School Graduate (Incl Equivalency) 1,920 23,873 44,451 Some College No Degree 1,875 20,773 39,901 Associate Degree 861 8,161 15,233 Bachelor's Degree 1,943 19,402 38,061 Graduate or Prof School Degree 626 7,674 17,052 % Total Educational Attainment Age 25+ 64.34% 62.63% 63.31% % Less Than 9th Grade 8.33% 10.45% 9.08% % No High School Diploma 9.50% 10.45% 9.94% % High School Graduate (Incl Equivalency) 21.84% 23.64% 23.27% % Some College 21.33% 20.57% 20.89% % Associate Degree 9.79% 8.08% 7.97% % Bachelor's Degree 22.10% 19.21% 19.92% % Graduate or Prof School Degree 7.12% 7.60% 8.93% 2006 Median Age Total Population 36 33 33 2006 Median Age Female Pop 37 35 34 2006 Median Age Male Pop 35 32 32 2006 MARITAL STATUS % Never Married 28.64% 29.03% 29.22% % Currently Married 58.02% 58.55% 57.66% % Divorced 7.81% 7.36% 8.29% % Widowed 5.55% 5.07% 4.83% % Separated 1.20% 1.79% 1.88% 2006 Median Home Value $397,970 $344,856 $353,575 Data Source: MapInfo Corporation © 2006 MapInfo Corporation, Troy, New York. All rights reserved. 1-800-489-8829 Page 2