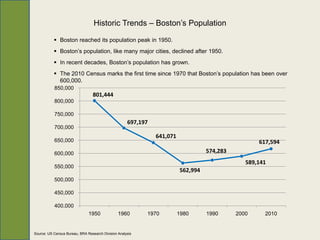
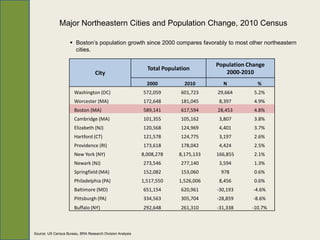
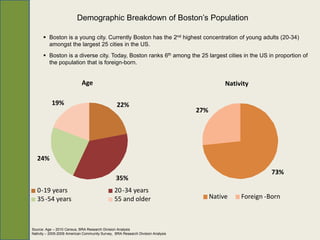
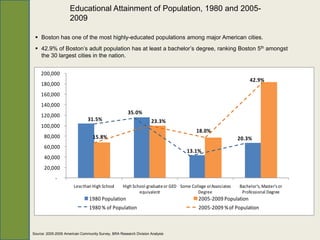
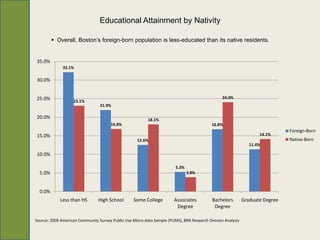
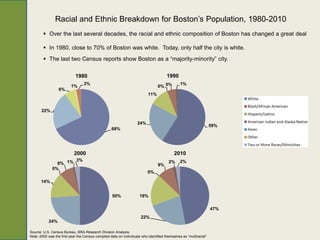
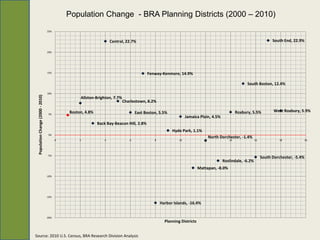
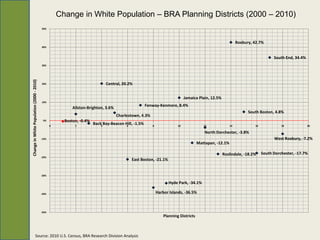
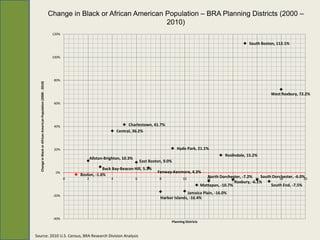
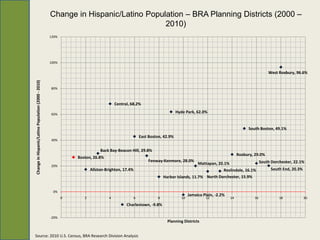
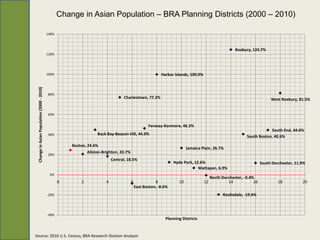
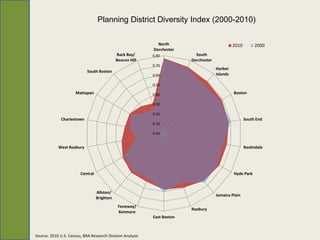
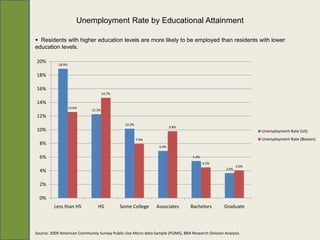
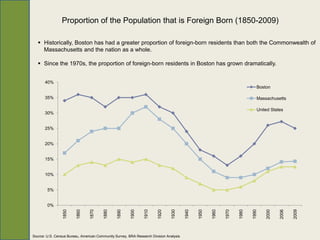
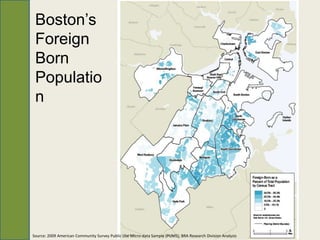
Overview of Boston’s
    Population

    Boston Redevelopment Authority – Research Division
                     Alvaro Lima, Director of Research
                                           June - 2012
Historic Trends – Boston’s Population

            Boston reached its population peak in 1950.
            Boston’s population, like many major cities, declined after 1950.
            In recent decades, Boston’s population has grown.
            The 2010 Census marks the first time since 1970 that Boston’s population has been over
             600,000.
           850,000
                                 801,444
           800,000

           750,000
                                                     697,197
           700,000
                                                               641,071
           650,000                                                                                  617,594
           600,000                                                                 574,283
                                                                                                589,141
           550,000
                                                                         562,994
           500,000

           450,000

           400,000
                               1950             1960       1970          1980      1990      2000     2010


Source: US Census Bureau, BRA Research Division Analysis
Major Northeastern Cities and Population Change, 2010 Census

                     Boston’s population growth since 2000 compares favorably to most other northeastern
                      cities.

                                                                                    Population Change
                                                             Total Population
                                   City                                                2000-2010
                                                             2000          2010       N           %
                       Washington (DC)                     572,059       601,723    29,664       5.2%
                       Worcester (MA)                      172,648       181,045     8,397       4.9%
                       Boston (MA)                         589,141       617,594    28,453       4.8%
                       Cambridge (MA)                      101,355       105,162     3,807       3.8%
                       Elizabeth (NJ)                      120,568       124,969     4,401       3.7%
                       Hartford (CT)                       121,578       124,775     3,197       2.6%
                       Providence (RI)                     173,618       178,042     4,424       2.5%
                       New York (NY)                       8,008,278    8,175,133   166,855      2.1%
                       Newark (NJ)                         273,546       277,140     3,594       1.3%
                       Springfield (MA)                    152,082       153,060     978         0.6%
                       Philadelphia (PA)                   1,517,550    1,526,006    8,456       0.6%
                       Baltimore (MD)                      651,154       620,961    -30,193      -4.6%
                       Pittsburgh (PA)                     334,563       305,704    -28,859      -8.6%
                       Buffalo (NY)                        292,648       261,310    -31,338     -10.7%


Source: US Census Bureau, BRA Research Division Analysis
25 Largest US Cities and Population Change, 2010 Census

                 Boston’s population growth rate since 2000 was higher than the rates for New York and San
                  Francisco.

                 Four of the 25 largest cities experienced population declines between 2000 and 2010.

                                                               Total Population         Population Change 2000-2010
                                      City
                                                             2000               2010          N              %

                          Fort Worth (TX)                   534,694          741,206      206,512           38.6%
                          Charlotte (NC)                    540,828          731,424      190,596           35.2%
                          Austin (TX)                       656,562          790,390      133,828           20.4%
                          San Antonio (TX)                 1,144,646        1,327,407     182,761           16.0%
                          El Paso (TX)                      563,662          649,121       85,459           15.2%
                          Jacksonville (FL)                 735,617          821,784       86,167           11.7%
                          Columbus (OH)                     711,470          787,033       75,563           10.6%
                          Nashville (TN)                    545,524          601,222       55,698           10.2%
                          Phoenix (AZ)                     1,321,045        1,445,632     124,587            9.4%
                          Seattle (WA)                      563,374          608,660       45,286            8.0%
                          Houston (TX)                     1,953,631        2,099,451     145,820            7.5%
                          San Diego (CA)                   1,223,400        1,307,402      84,002            6.9%
                          San Jose (CA)                     894,943          945,942       50,999            5.7%
                          Washington (DC)                   572,059          601,723       29,664            5.2%
                          Indianapolis (IN)                 781,870          820,445       38,575            4.9%
                          Boston (MA)                       589,141          617,594       28,453            4.8%
                          San Francisco (CA)                776,733          805,235       28,502            3.7%
                          Los Angeles (CA)                 3,694,820        3,792,621      97,801            2.6%
                          New York City (NY)               8,008,278        8,175,133     166,855            2.1%
                          Dallas (TX)                      1,188,580        1,197,816       9,236            0.8%
                          Philadelphia (PA)                1,517,550        1,526,006       8,456            0.6%
                          Memphis (TN)                      650,100          646,889        -3,211          -0.5%
                          Baltimore (MD)                    651,154          620,961       -30,193          -4.6%
                          Chicago (IL)                     2,896,016        2,695,598     -200,418          -6.9%
                          Detroit (MI)                      951,270          713,777      -237,493         -25.0%

Source: US Census Bureau, BRA Research Division Analysis
Demographic Breakdown of Boston’s Population

       Boston is a young city. Currently Boston has the 2nd highest concentration of young adults (20-34)
        amongst the largest 25 cities in the US.
       Boston is a diverse city. Today, Boston ranks 6th among the 25 largest cities in the US in proportion of
        the population that is foreign-born.


                             Age                                                            Nativity

           19%                                   22%
                                                                                 27%


   24%
                                                                                                           73%
                                                35%
   0-19 years                                  20 -34 years
   35 -54 years                                55 and older                            Native    Foreign -Born


Source: Age – 2010 Census, BRA Research Division Analysis
Nativity – 2005-2009 American Community Survey, BRA Research Division Analysis
Educational Attainment of Population, 1980 and 2005-
                     2009

  Boston has one of the most highly-educated populations among major American cities.
  42.9% of Boston’s adult population has at least a bachelor’s degree, ranking Boston 5th amongst
   the 30 largest cities in the nation.


    200,000                                                                                                                           50.0%
                                                                                                                 42.9%
    180,000                                                                                                                           45.0%
    160,000                                                                                                                           40.0%
    140,000                                                                                                                           35.0%
                                                      35.0%
    120,000                                                                                                                           30.0%
                               31.5%                                23.3%
    100,000                                                                                                                           25.0%
                                                                                       18.0%
      80,000                      15.8%                                                                     20.3%                     20.0%
      60,000                                                                                                                          15.0%
                                                                                   13.1%
      40,000                                                                                                                          10.0%
      20,000                                                                                                                          5.0%
             -                                                                                                                        0.0%
                       Less than High School       High School graduate or GED Some College or Associates   Bachelor's, Master's or
                                                           equivalent                  Degree                Professional Degree
                                1980 Population                                         2005-2009 Population
                                1980 % of Population                                    2005-2009 % of Population


Source: 2005-2009 American Community Survey, BRA Research Division Analysis
Educational Attainment by Nativity

          Overall, Boston’s foreign-born population is less-educated than its native residents.


35.0%
              32.1%

30.0%


25.0%                                                                                            24.0%
                   23.1%
                                 21.9%

20.0%                                                     18.1%
                                       16.8%                                               16.8%
                                                                                                                               Foreign-Born
15.0%                                                                                                               14.1%
                                                     12.6%                                                                     Native-Born
                                                                                                                11.4%

10.0%

                                                                        5.3%
  5.0%                                                                         3.8%


  0.0%
            Less than HS        High School        Some College         Associates         Bachelors         Graduate Degree
                                                                         Degree             Degree

Source: 2009 American Community Survey Public Use Micro-data Sample (PUMS), BRA Research Division Analysis
Racial and Ethnic Breakdown for Boston’s Population, 1980-2010
         Over the last several decades, the racial and ethnic composition of Boston has changed a great deal

         In 1980, close to 70% of Boston was white. Today, only half the city is white.
         The last two Census reports show Boston as a “majority-minority” city.

                            1980                                                      1990
                                  3%                                                           1%
                          1%                                                     0% 5%
                  6%
                                                                          11%


       22%

                                                                    24%
                                                                                                                   59%
                                                   68%


                            2000                                                           2010
                      3%                                                                       2%
                8% 1%                                                            9%
                                                                                        2%
              0%
                                                                          0%

       14%


                                                    50%              18%

                                                                                                                   47%
                                                                      22%
           24%

Source: U.S. Census Bureau, BRA Research Division Analysis.
Note: 2000 was the first year the Census compiled data on individuals who identified themselves as “multiracial”
Population Change - BRA Planning Districts (2000 – 2010)
                                   25%


                                                                    Central, 22.7%                                                                                    South End, 22.9%

                                   20%


                                   15%                                                    Fenway-Kenmore, 14.9%

                                                                                                                                                      South Boston, 12.4%

                                   10%
 Population Change (2000 - 2010)


                                                   Allston-Brighton, 7.7%
                                                                            Charlestown, 8.2%

                                              Boston, 4.8%                         East Boston, 5.5%                                            Roxbury, 5.5%          West Roxbury, 5.9%
                                    5%
                                                                                                                Jamaica Plain, 4.5%
                                                             Back Bay-Beacon Hill, 2.8%
                                                                                                       Hyde Park, 1.1%
                                    0%
                                                                                                                                North Dorchester, -1.4%
                                          0        2            4              6             8             10              12              14              16             18              20


                                    -5%
                                                                                                                                                                South Dorchester, -5.4%
                                                                                                                                       Roslindale, -6.2%
                                                                                                                        Mattapan, -8.0%
                                   -10%


                                   -15%

                                                                                                 Harbor Islands, -16.4%


                                   -20%
                                                                                                   Planning Districts


Source: 2010 U.S. Census, BRA Research Division Analysis
Change in White Population – BRA Planning Districts (2000 – 2010)
                                           50%


                                                                                                                                                               Roxbury, 42.7%
                                           40%


                                                                                                                                                                                   South End, 34.4%
                                           30%
Change in White Population (2000 - 2010)


                                           20%                                 Central, 20.2%


                                                                                                                               Jamaica Plain, 12.5%
                                           10%
                                                                                                       Fenway-Kenmore, 8.4%
                                                            Allston-Brighton, 3.6%
                                                                                                                                                                     South Boston, 4.8%
                                                                                     Charlestown, 4.3%
                                            0%          Boston, -0.4%
                                                  0          2
                                                                        Back4 Bay-Beacon Hill, -1.5%
                                                                                          6               8               10              12              14            16             18             20

                                                                                                                                          North Dorchester, -3.8%
                                           -10%                                                                                                                                    West Roxbury, -7.2%
                                                                                                                                       Mattapan, -12.1%

                                                                                                                                                      Roslindale, -18.2%     South Dorchester, -17.7%
                                           -20%
                                                                                             East Boston, -21.1%


                                           -30%

                                                                                                                    Hyde Park, -34.1%

                                           -40%                                                               Harbor Islands, -36.5%


                                           -50%
                                                                                                                  Planning Districts


                     Source: 2010 U.S. Census, BRA Research Division Analysis
Change in Black or African American Population – BRA Planning Districts (2000 –
                                                                                                      2010)
                                                                   120%

                                                                                                                                                                                  South Boston, 112.1%


                                                                   100%


                                                                   80%
   Change in Black or African American Population (2000 - 2010)


                                                                                                                                                                                             West Roxbury, 72.2%

                                                                   60%


                                                                   40%                                    Charlestown, 41.7%
                                                                                                    Central, 36.2%


                                                                   20%                                                                 Hyde Park, 21.1%
                                                                                                                                                                     Roslindale, 15.2%
                                                                                     Allston-Brighton, 10.3%
                                                                                                                   East Boston, 9.0%
                                                                                          Back Bay-Beacon Hill, 5.1%
                                                                    0%                                                      Fenway-Kenmore, 4.3%
                                                                              Boston, -1.6%                                                                 North Dorchester, -7.2% 16 South Dorchester, -6.0%
                                                                          0      2              4              6             8             10               12          14                      18            20
                                                                                                                                                                          Roxbury, -6.1%
                                                                                                                                                         Mattapan, -10.7%                   South End, -7.5%
                                                                                                                                            Jamaica Plain, -16.0%
                                                                   -20%
                                                                                                                              Harbor Islands, -16.4%


                                                                   -40%
                                                                                                                                    Planning Districts


Source: 2010 U.S. Census, BRA Research Division Analysis
Change in Hispanic/Latino Population – BRA Planning Districts (2000 –
                                                                                    2010)
                                                     120%


                                                     100%

                                                                                                                                                                               West Roxbury, 96.6%
Change in Hispanic/Latino Population (2000 - 2010)


                                                     80%


                                                                                     Central, 68.2%

                                                     60%
                                                                                                                          Hyde Park, 62.0%


                                                                                                                                                                   South Boston, 49.1%
                                                                                                     East Boston, 42.9%
                                                     40%

                                                                            Back Bay-Beacon Hill, 29.8%
                                                                                                                                                              Roxbury, 29.0%
                                                                Boston, 26.8%
                                                                                                         Fenway-Kenmore, 28.0%                                             South Dorchester, 22.1%
                                                                                                                                       Mattapan, 20.1%
                                                     20%
                                                                       Allston-Brighton, 17.4%                                                  Roslindale, 16.1%               South End, 20.3%
                                                                                                                  Harbor Islands, 11.7% North Dorchester, 15.9%


                                                      0%
                                                                                                                                  Jamaica Plain, -2.2%
                                                            0      2             4               6            8              10            12            14           16             18            20
                                                                                           Charlestown, -9.8%

                                                     -20%
                                                                                                                    Planning Districts


Source: 2010 U.S. Census, BRA Research Division Analysis
Change in Asian Population – BRA Planning Districts (2000 – 2010)

                                            140%


                                                                                                                                                      Roxbury, 124.7%
                                            120%


                                            100%                                                           Harbor Islands, 100.0%
 Change in Asian Population (2000 - 2010)


                                            80%
                                                                                   Charlestown, 77.2%                                                                     West Roxbury, 81.5%


                                            60%


                                                                                                    Fenway-Kenmore, 46.3%
                                                                                                                                                                        South End, 44.6%
                                            40%                     Back Bay-Beacon Hill, 44.9%
                                                                                                                                                            South Boston, 40.6%

                                                       Boston, 24.6%
                                                                                                                         Jamaica Plain, 26.7%
                                                               Allston-Brighton, 20.7%
                                            20%
                                                                             Central, 18.5%
                                                                                                                  Hyde Park, 12.6%                                   South Dorchester, 11.9%
                                                                                                                               Mattapan, 6.9%
                                             0%
                                                                                                                                         North Dorchester, -0.4%
                                                   0        2            4               6              8           10              12            14            16            18          20
                                                                                             East Boston, -8.6%
                                            -20%                                                                                               Roslindale, -19.6%


                                            -40%
                                                                                                             Planning Districts


Source: 2010 U.S. Census, BRA Research Division Analysis
Planning District Diversity Index (2000-2010)

                                                             North                              2010        2000
                                                           Dorchester
                                             Back Bay/     0.80            South
                                             Beacon Hill                 Dorchester
                                                           0.70
                                                                                      Harbor
                            South Boston
                                                           0.60                       Islands

                                                           0.50

                     Mattapan                              0.40                                 Boston

                                                           0.30

                                                           0.20
              Charlestown                                                                              South End
                                                           0.10

                                                           0.00


            West Roxbury                                                                               Roslindale


                        Central                                                                 Hyde Park


                                  Allston/
                                                                                      Jamaica Plain
                                  Brighton
                                              Feneway/
                                                                         Roxbury
                                              Kenmore
                                                           East Boston


Source: 2010 U.S. Census, BRA Research Division Analysis
Employment and
Unemployment in
Boston
Unemployed With Less Than High School Education by Industry
     The unemployment rate for workers with less than high school education is 12.6%.
     Unemployed workers with less than high school education worked mainly in the
      manufacturing, administrative support, and food services industries.


                                                Less than High School (n = 7,622)
                                            Not Specified                                                                                        15.9%

                                            Government                        2.5%

                                           Other Services            0.9%

                     Accommodation and Food Services                                                                               13.2%

                    Arts, Entertainment, and Recreation                         3.0%

                        Healthcare and Social Assistance                                    4.5%

                                    Educational Services               1.5%

Administrative Support and Waste Management Services                                                                                   14.1%

           Professional, Scientific and Technical Services    0.0%

                        Real Estate and Rental & Leasing                                  4.3%

                                  Finance and Insurance       0.0%

                                             Information      0.0%

                       Transportation and Warehousing                                  4.0%

                                             Retail Trade                                                                  12.2%

                                        Wholesale Trade                              3.6%

                                          Manufacturing                                                                                    15.0%

                                            Construction                                           5.5%


                                                             0%        2%            4%            6%     8%   10%   12%           14%         16%       18%


Source: 2009 American Community Survey Public Use Micro-data Sample (PUMS), BRA Research Division Analysis
Unemployed With High School Education by Industry
 The unemployment rate for workers a high school education is 14.7%.
 Unemployed workers with a high school education worked mainly in the construction, administrative
  support, and food services industries.


                                                        High School (n = 12,760)
                                            Not Specified                                                     7.2%

                                            Government                                                 6.4%

                                           Other Services                                                              9.1%

                     Accommodation and Food Services                                                                          10.1%

                    Arts, Entertainment, and Recreation              1.3%

                        Healthcare and Social Assistance                                                        7.6%

                                    Educational Services                  2.0%

Administrative Support and Waste Management Services                                                                                         13.7%

           Professional, Scientific and Technical Services                                 4.6%

                        Real Estate and Rental & Leasing             1.4%

                                  Finance and Insurance       0.0%

                                             Information               1.8%

                       Transportation and Warehousing                                    4.2%

                                             Retail Trade                               3.9%

                                        Wholesale Trade                                                  6.9%

                                          Manufacturing                          2.9%

                                            Construction                                                                                                   16.8%


                                                             0%      2%            4%             6%           8%      10%            12%   14%      16%     18%


Source: 2009 American Community Survey Public Use Micro-data Sample (PUMS), BRA Research Division Analysis
Unemployed With Some College Education by Industry
 The unemployment rate for workers with some college education is 7.9%.
 Unemployed workers with some college education worked mainly in the healthcare, food services, and retail
  industries.


                                                   Some College (n = 11,699)
                                            Not Specified                                                                           13.3%

                                            Government                                      4.4%

                                           Other Services                                          5.6%

                     Accommodation and Food Services                                                                                        15.4%

                    Arts, Entertainment, and Recreation                1.7%

                        Healthcare and Social Assistance                                                                                             17.7%

                                    Educational Services                                         5.1%

Administrative Support and Waste Management Services                                                           9.1%

           Professional, Scientific and Technical Services           1.1%

                        Real Estate and Rental & Leasing                      2.6%

                                  Finance and Insurance                            3.0%

                                             Information      0.0%

                       Transportation and Warehousing                                     3.9%

                                             Retail Trade                                                             10.0%

                                        Wholesale Trade                     2.1%

                                          Manufacturing                      2.4%

                                            Construction                      2.6%


                                                             0%       2%            4%             6%     8%   10%            12%   14%     16%     18%      20%


Source: 2009 American Community Survey Public Use Micro-data Sample (PUMS), BRA Research Division Analysis
Unemployed With Associate’s Degree by Industry
 The unemployment rate for workers with an associate’s degree is 9.8%.
 Unemployed workers with an associate’s degree worked mainly in the retail, food services, and
  government industries.


                                                  Associate's Degree (n = 2,188)
                                            Not Specified                                                9.3%

                                            Government                                                                          12.2%

                                           Other Services     0.0%

                     Accommodation and Food Services                                                                                              14.8%

                    Arts, Entertainment, and Recreation                            4.9%

                        Healthcare and Social Assistance                                                                11.3%

                                    Educational Services      0.0%

Administrative Support and Waste Management Services          0.0%

           Professional, Scientific and Technical Services                 3.4%

                        Real Estate and Rental & Leasing      0.0%

                                  Finance and Insurance       0.0%

                                             Information      0.0%

                       Transportation and Warehousing                                                              10.7%

                                             Retail Trade                                                                                 13.9%

                                        Wholesale Trade                                                         10.1%

                                          Manufacturing                                   5.7%

                                            Construction                    3.6%


                                                             0%      2%     4%        6%            8%   10%            12%             14%          16%


Source: 2009 American Community Survey Public Use Micro-data Sample (PUMS), BRA Research Analysis
Unemployed With Bachelor’s Degree by Industry
 The unemployment rate for workers with a bachelor’s degree is 4.5%.
 Unemployed workers with a bachelor’s degree worked mainly in the education, healthcare, and finance
industries.


                                                   Bachelor's Degree (n = 6,881)
                                            Not Specified                                                                   8.2%

                                            Government                      2.3%

                                           Other Services     0.0%

                     Accommodation and Food Services                 1.3%

                    Arts, Entertainment, and Recreation                                                 5.7%

                        Healthcare and Social Assistance                                                                                             12.6%

                                    Educational Services                                                                                               12.9%

Administrative Support and Waste Management Services                                             5.1%

           Professional, Scientific and Technical Services                                                                          9.6%

                        Real Estate and Rental & Leasing                           3.1%

                                  Finance and Insurance                                                                                    10.7%

                                             Information             1.4%

                       Transportation and Warehousing         0.0%

                                             Retail Trade                                                                          9.4%

                                        Wholesale Trade                                   4.5%

                                          Manufacturing                                                        6.5%

                                            Construction                                                        6.8%


                                                             0%       2%             4%             6%                 8%          10%         12%           14%


Source: 2009 American Community Survey Public Use Micro-data Sample (PUMS), BRA Research Division Analysis
Unemployed With Graduate Degree by Industry
 The unemployment rate for workers with a graduate degree is 4.0%.
 Unemployed workers with a graduate degree worked mainly in the professional services, information, and
  healthcare industries.


                                                    Graduate Degree (n = 3,045)
                                            Not Specified               3.3%

                                            Government                  3.1%

                                           Other Services        0.0%

                     Accommodation and Food Services             0.0%

                    Arts, Entertainment, and Recreation          0.0%

                        Healthcare and Social Assistance                                              18.0%

                                    Educational Services                               10.9%

Administrative Support and Waste Management Services                    3.2%

           Professional, Scientific and Technical Services                                                                         31.7%

                        Real Estate and Rental & Leasing         0.0%

                                  Finance and Insurance                         8.2%

                                             Information                                                      21.5%

                       Transportation and Warehousing            0.0%

                                             Retail Trade        0.0%

                                        Wholesale Trade          0.0%

                                          Manufacturing          0.0%

                                            Construction         0.0%


                                                             0           0.05    0.1           0.15     0.2           0.25   0.3           0.35


Source: 2009 American Community Survey Public Use Micro-data Sample (PUMS), BRA Research Division Analysis
Boston vs. U.S. on
Unemployment Rate
Unemployment Rate by Race

   Compared to the U.S., Boston’s unemployment rate is lower for people of all races except
  Asian.

18%

                                  16%
16%                                     15%


14%
                                                                                                13%
                                                       12%
12%
                                                             10%
10%                                                                               9%
              9%                                                                                             Unemployment Rate (US)
                                                                            8%
  8%                                                                                                         Unemployment Rate (Boston)

                                                                                                       6%
  6%
                    5%

  4%

  2%

  0%
               White                Black              Hispanic              Asian                Other


Source: 2009 American Community Survey Public Use Micro-data Sample (PUMS), BRA Research Division Analysis
Unemployment Rate by Income

     Boston’s unemployment rate is highest for people in the lowest income brackets.


40%

35%      34%


30%

25%          23%

20%
                                                                                                             Unemployment Rate (US)

                         14%                                                                                 Unemployment Rate (Boston)
15%
                     11%

10%
                                  6%
                                       5%
 5%                                            3% 4%                          3%                      3%
                                                            3% 2%        2%          1%          1%
                                                                                          1%
 0%
        Less than   $10,000 to   $20,000 to   $35,000 to   $50,000 to   $75,000 to $100,000 to $150,000 or
         $10,000     $19,999      $34,999      $49,999      $74,999      $99,999    $149,999      more


Source: 2009 American Community Survey Public Use Micro-data Sample (PUMS), BRA Research Division Analysis
Unemployment Rate by Educational Attainment

 Residents with higher education levels are more likely to be employed than residents with lower
education levels.

20%
            18.9%


18%

16%
                                     14.7%

14%
                    12.6%
                             12.3%
12%
                                               10.2%
                                                                       9.8%
10%                                                                                                              Unemployment Rate (US)
                                                       7.9%                                                      Unemployment Rate (Boston)
  8%
                                                                6.9%

  6%                                                                             5.4%
                                                                                        4.5%
                                                                                                          4.0%
                                                                                                   3.6%
  4%

  2%

  0%
         Less than HS           HS           Some College      Associates       Bachelors         Graduate


Source: 2009 American Community Survey Public Use Micro-data Sample (PUMS), BRA Research Division Analysis
Boston’s Foreign
Born Population
Proportion of the Population that is Foreign Born (1850-2009)

    Historically, Boston has had a greater proportion of foreign-born residents than both the Commonwealth of
     Massachusetts and the nation as a whole.

    Since the 1970s, the proportion of foreign-born residents in Boston has grown dramatically.


       40%
                                                                                                                              Boston

       35%                                                                                                                    Massachusetts

                                                                                                                              United States
       30%


       25%


       20%


       15%


       10%


        5%


        0%
                 1850


                         1860


                                 1870


                                         1880


                                                1890


                                                        1900


                                                                1910


                                                                        1920


                                                                                1930


                                                                                        1940


                                                                                               1950


                                                                                                      1960


                                                                                                             1970


                                                                                                                    1980


                                                                                                                           1990


                                                                                                                                  2000


                                                                                                                                         2006


                                                                                                                                                2009
Source: U.S. Census Bureau, American Community Survey, BRA Research Division Analysis
Boston’s
 Foreign
 Born
 Populatio
 n


Source: 2009 American Community Survey Public Use Micro-data Sample (PUMS), BRA Research Division Analysis
Countries of Origin for Boston’s Foreign-Born
                                 Population, 2009
    Today most of Boston’s immigrants come from the Caribbean, Latin America, and Asia


                  Share of the Foreign-Born Population in Boston
     Dominican Republic                                                                        9.4%

                        China                                                                 9.0%

                          Haiti                                                        7.9%

                     Vietnam                                                    4.6%

                 El Salvador                                                    4.5%

                         Brazil                                                 4.4%

                Cape Verde                                                     4.2%

                   Colombia                                                4.0%

                     Jamaica                                             3.7%

                       Ireland                            2.2%

                                0.0% 1.0% 2.0% 3.0% 4.0% 5.0% 6.0% 7.0% 8.0% 9.0% 10.0%


Source: 2005-2009 American Community Survey, BRA Research Division Analysis.
Age by Nativity
Older residents make up a far greater share of foreign-born residents than
native residents.
45.0%
                                              40.6%
40.0%

35.0%                                 34.0%


30.0%
                                                             26.1%
25.0%
                       21.0%                                                        20.7%                                   Foreign-Born
20.0%                                                                                                                       Native-Born
                                                                     17.1%

15.0%                                                                                                        13.6%
                                                                                            12.3%

10.0%                                                                                                                9.0%

                5.7%
  5.0%

  0.0%
              0 to 17 years         18 to 34 years         35 to 49 years         50 to 64 years             65+ years

Source: 2009 American Community Survey Public Use Micro-data Sample (PUMS), BRA Research Division Analysis
Nativity of Parent(s)
Although foreign-born children (0 to 17 years) make up a small share of all
children in Boston, more than 40% of all children in Boston have at least one
parent that is foreign born.


                                           40.3%
           Native-Born
           Foreign-Born
                                                                                                 59.7%


Source: 2009 American Community Survey Public Use Micro-data Sample (PUMS), BRA Research Division Analysis
Income by Nativity
A smaller portion of foreign-born residents have high-paying jobs than
native residents.
35%       33%

                30%
30%


25%


20%                                    19%
                         18%
                                                                          16%
                                             14%                                                                       Foreign-Born
15%                                                   14%
                               12%                          12%                                                        Native-Born

10%                                                                  9%
                                                                                         7%
                                                                                                        5%        4%
 5%                                                                                 3%             3%
                                                                                                             1%
 0%
         Less than     $10,000 to $20,000 to $35,000 to $50,000 to $75,000 to $100,000 to $150,000 or
          $10,000       $19,999    $34,999    $49,999    $74,999    $99,999    $149,999      more


Source: 2009 American Community Survey Public Use Micro-data Sample (PUMS), BRA Research Division Analysis
Wage Differential By Educational Attainment
As educational attainment improves, native-born residents continue to earn
higher wages than foreign-born residents.
 $100,000.00                                                                                                     $94,550.30

  $90,000.00

  $80,000.00

  $70,000.00                                                                                   $66,866.76
                                                                                                             $62,678.98
  $60,000.00

  $50,000.00
                                                                             $42,252.64                                       Foreign-Born
                                                                                          $40,284.47
  $40,000.00                                                             $36,249.95                                           Native-Born
                                                            $32,240.60
                                                       $30,144.64
                                          $28,148.54
  $30,000.00
                                     $22,197.56
                   $17,401.58
  $20,000.00            $16,317.97

  $10,000.00

           $-
                   Less than High     High School      Some College       Associate's       Bachelor's         Graduate
                       School                                              Degree            Degree             Degree

Source: 2009 American Community Survey Public Use Micro-data Sample (PUMS), BRA Research Division Analysis
Top 5 Countries of Origin for Foreign-Born Population
                             by Planning District


                Allston-Brighton 0.1
                            0                    0.2                                 Back Bay-Beacon Hill 0.1 0.15 0.2
                                                                                                   0 0.05

                       China                    15.3%                                            China                  15.3%
                       Brazil                 11.7%                                            Canada            7.3%
                      Russia           6.9%                                            United Kingdom           6.2%
                 El Salvador        3.7%                                                       France           6.2%
                    Ukraine         3.6%                                                     Colombia         3.7%

                  Central 0             0.1       0.2       0.3      0.4      0.5   Charlestown           0     0.1     0.2       0.3      0.4

                       China                                               43.0%                 China                                  31.5%
                    Vietnam            6.4%                                         Dominican Republic                          23.3%
                        Italy          6.2%                                                     Russia         4.6%
                       India        3.5%                                                       Canada         3.1%
                       Japan        3.2%                                                    Philippines       2.5%


Source: 2005-2009 American Community Survey, BRA Research Division
Top 5 Countries of Origin for Foreign-Born Population
                          by Planning District (cont.)


               Jamaica Plain           0   0.05 0.1 0.15                     Mattapan                0   0.05 0.1 0.15 0.2 0.25 0.3 0.35

                 Dominican Republic                       14.0%                              Haiti                                  28.8%
                               China                      13.8%                           Jamaica                     12.5%
                               India            6.3%                                 Cape Verde                     10.6%
                             Ireland        3.3%                              Dominican Republic              7.7%
                    United Kingdom         2.8%                              Trinidad and Tobago           5.3%


              North Dorchester 0 0.05 0.1 0.15 0.2 0.25                      Roslindale              0   0.05 0.1 0.15 0.2

                         Cape Verde                                  23.3%    Dominican Republic                            17.8%
                            Vietnam                        13.2%                             Haiti                  10.3%
                             Albania               7.8%                                   Albania            6.4%
                Dominican Republic                 7.8%                               Guatemala              6.3%
                               Haiti          4.9%                                         Ireland         4.0%


Source: 2005-2009 American Community Survey, BRA Research Division
Top 5 Countries of Origin for Foreign-Born Population
                          by Planning District (cont.)


   Roxbury                     0   0.05 0.1 0.15 0.2 0.25 0.3South Boston                           0   0.05 0.1 0.15 0.2 0.25 0.3 0.35

     Dominican Republic                                              23.9%    Dominican Republic                                   32.9%
                       Haiti                        13.9%                                  China                       15.8%
                   Jamaica                 8.0%                                      Cape Verde             6.9%
               Cape Verde                6.3%                                         Philippines        4.0%
     Trinidad and Tobago               4.9%                                              Vietnam         3.9%

   South Dorchester 0 0.05 0.1 0.15 0.2 0.25                                 South End              0   0.05 0.1 0.15 0.2 0.25 0.3 0.35


                  Vietnam                                                                  China                                 29.2%
                                                          19.2%
                   Jamaica                                                    Dominican Republic                   11.3%
                                                10.9%
                       Haiti                                                             Ethiopia          5.0%
                                              10.7%
               Cape Verde                                                              Colombia           4.0%
                                              10.3%
     Dominican Republic                                                                   Canada         3.9%
                                          7.6%


Source: 2005-2009 American Community Survey, BRA Research Division
Top 5 Countries of Origin for Foreign-Born Population
                          by Planning District (cont.)


        West Roxbury                          0         0.05         0.1     0.15

                                    Haiti                                    12.4%
                                  China                                    10.1%
           Dominican Republic                                         8.7%
                                Ireland                              7.6%
                                Greece                          6.0%


Source: 2005-2009 American Community Survey, BRA Research Division

Overview of Boston's Population

  • 1.
    Overview of Boston’s Population Boston Redevelopment Authority – Research Division Alvaro Lima, Director of Research June - 2012
  • 2.
    Historic Trends –Boston’s Population  Boston reached its population peak in 1950.  Boston’s population, like many major cities, declined after 1950.  In recent decades, Boston’s population has grown.  The 2010 Census marks the first time since 1970 that Boston’s population has been over 600,000. 850,000 801,444 800,000 750,000 697,197 700,000 641,071 650,000 617,594 600,000 574,283 589,141 550,000 562,994 500,000 450,000 400,000 1950 1960 1970 1980 1990 2000 2010 Source: US Census Bureau, BRA Research Division Analysis
  • 3.
    Major Northeastern Citiesand Population Change, 2010 Census  Boston’s population growth since 2000 compares favorably to most other northeastern cities. Population Change Total Population City 2000-2010 2000 2010 N % Washington (DC) 572,059 601,723 29,664 5.2% Worcester (MA) 172,648 181,045 8,397 4.9% Boston (MA) 589,141 617,594 28,453 4.8% Cambridge (MA) 101,355 105,162 3,807 3.8% Elizabeth (NJ) 120,568 124,969 4,401 3.7% Hartford (CT) 121,578 124,775 3,197 2.6% Providence (RI) 173,618 178,042 4,424 2.5% New York (NY) 8,008,278 8,175,133 166,855 2.1% Newark (NJ) 273,546 277,140 3,594 1.3% Springfield (MA) 152,082 153,060 978 0.6% Philadelphia (PA) 1,517,550 1,526,006 8,456 0.6% Baltimore (MD) 651,154 620,961 -30,193 -4.6% Pittsburgh (PA) 334,563 305,704 -28,859 -8.6% Buffalo (NY) 292,648 261,310 -31,338 -10.7% Source: US Census Bureau, BRA Research Division Analysis
  • 4.
    25 Largest USCities and Population Change, 2010 Census  Boston’s population growth rate since 2000 was higher than the rates for New York and San Francisco.  Four of the 25 largest cities experienced population declines between 2000 and 2010. Total Population Population Change 2000-2010 City 2000 2010 N % Fort Worth (TX) 534,694 741,206 206,512 38.6% Charlotte (NC) 540,828 731,424 190,596 35.2% Austin (TX) 656,562 790,390 133,828 20.4% San Antonio (TX) 1,144,646 1,327,407 182,761 16.0% El Paso (TX) 563,662 649,121 85,459 15.2% Jacksonville (FL) 735,617 821,784 86,167 11.7% Columbus (OH) 711,470 787,033 75,563 10.6% Nashville (TN) 545,524 601,222 55,698 10.2% Phoenix (AZ) 1,321,045 1,445,632 124,587 9.4% Seattle (WA) 563,374 608,660 45,286 8.0% Houston (TX) 1,953,631 2,099,451 145,820 7.5% San Diego (CA) 1,223,400 1,307,402 84,002 6.9% San Jose (CA) 894,943 945,942 50,999 5.7% Washington (DC) 572,059 601,723 29,664 5.2% Indianapolis (IN) 781,870 820,445 38,575 4.9% Boston (MA) 589,141 617,594 28,453 4.8% San Francisco (CA) 776,733 805,235 28,502 3.7% Los Angeles (CA) 3,694,820 3,792,621 97,801 2.6% New York City (NY) 8,008,278 8,175,133 166,855 2.1% Dallas (TX) 1,188,580 1,197,816 9,236 0.8% Philadelphia (PA) 1,517,550 1,526,006 8,456 0.6% Memphis (TN) 650,100 646,889 -3,211 -0.5% Baltimore (MD) 651,154 620,961 -30,193 -4.6% Chicago (IL) 2,896,016 2,695,598 -200,418 -6.9% Detroit (MI) 951,270 713,777 -237,493 -25.0% Source: US Census Bureau, BRA Research Division Analysis
  • 5.
    Demographic Breakdown ofBoston’s Population  Boston is a young city. Currently Boston has the 2nd highest concentration of young adults (20-34) amongst the largest 25 cities in the US.  Boston is a diverse city. Today, Boston ranks 6th among the 25 largest cities in the US in proportion of the population that is foreign-born. Age Nativity 19% 22% 27% 24% 73% 35% 0-19 years 20 -34 years 35 -54 years 55 and older Native Foreign -Born Source: Age – 2010 Census, BRA Research Division Analysis Nativity – 2005-2009 American Community Survey, BRA Research Division Analysis
  • 6.
    Educational Attainment ofPopulation, 1980 and 2005- 2009  Boston has one of the most highly-educated populations among major American cities.  42.9% of Boston’s adult population has at least a bachelor’s degree, ranking Boston 5th amongst the 30 largest cities in the nation. 200,000 50.0% 42.9% 180,000 45.0% 160,000 40.0% 140,000 35.0% 35.0% 120,000 30.0% 31.5% 23.3% 100,000 25.0% 18.0% 80,000 15.8% 20.3% 20.0% 60,000 15.0% 13.1% 40,000 10.0% 20,000 5.0% - 0.0% Less than High School High School graduate or GED Some College or Associates Bachelor's, Master's or equivalent Degree Professional Degree 1980 Population 2005-2009 Population 1980 % of Population 2005-2009 % of Population Source: 2005-2009 American Community Survey, BRA Research Division Analysis
  • 7.
    Educational Attainment byNativity  Overall, Boston’s foreign-born population is less-educated than its native residents. 35.0% 32.1% 30.0% 25.0% 24.0% 23.1% 21.9% 20.0% 18.1% 16.8% 16.8% Foreign-Born 15.0% 14.1% 12.6% Native-Born 11.4% 10.0% 5.3% 5.0% 3.8% 0.0% Less than HS High School Some College Associates Bachelors Graduate Degree Degree Degree Source: 2009 American Community Survey Public Use Micro-data Sample (PUMS), BRA Research Division Analysis
  • 8.
    Racial and EthnicBreakdown for Boston’s Population, 1980-2010  Over the last several decades, the racial and ethnic composition of Boston has changed a great deal  In 1980, close to 70% of Boston was white. Today, only half the city is white.  The last two Census reports show Boston as a “majority-minority” city. 1980 1990 3% 1% 1% 0% 5% 6% 11% 22% 24% 59% 68% 2000 2010 3% 2% 8% 1% 9% 2% 0% 0% 14% 50% 18% 47% 22% 24% Source: U.S. Census Bureau, BRA Research Division Analysis. Note: 2000 was the first year the Census compiled data on individuals who identified themselves as “multiracial”
  • 9.
    Population Change -BRA Planning Districts (2000 – 2010) 25% Central, 22.7% South End, 22.9% 20% 15% Fenway-Kenmore, 14.9% South Boston, 12.4% 10% Population Change (2000 - 2010) Allston-Brighton, 7.7% Charlestown, 8.2% Boston, 4.8% East Boston, 5.5% Roxbury, 5.5% West Roxbury, 5.9% 5% Jamaica Plain, 4.5% Back Bay-Beacon Hill, 2.8% Hyde Park, 1.1% 0% North Dorchester, -1.4% 0 2 4 6 8 10 12 14 16 18 20 -5% South Dorchester, -5.4% Roslindale, -6.2% Mattapan, -8.0% -10% -15% Harbor Islands, -16.4% -20% Planning Districts Source: 2010 U.S. Census, BRA Research Division Analysis
  • 10.
    Change in WhitePopulation – BRA Planning Districts (2000 – 2010) 50% Roxbury, 42.7% 40% South End, 34.4% 30% Change in White Population (2000 - 2010) 20% Central, 20.2% Jamaica Plain, 12.5% 10% Fenway-Kenmore, 8.4% Allston-Brighton, 3.6% South Boston, 4.8% Charlestown, 4.3% 0% Boston, -0.4% 0 2 Back4 Bay-Beacon Hill, -1.5% 6 8 10 12 14 16 18 20 North Dorchester, -3.8% -10% West Roxbury, -7.2% Mattapan, -12.1% Roslindale, -18.2% South Dorchester, -17.7% -20% East Boston, -21.1% -30% Hyde Park, -34.1% -40% Harbor Islands, -36.5% -50% Planning Districts Source: 2010 U.S. Census, BRA Research Division Analysis
  • 11.
    Change in Blackor African American Population – BRA Planning Districts (2000 – 2010) 120% South Boston, 112.1% 100% 80% Change in Black or African American Population (2000 - 2010) West Roxbury, 72.2% 60% 40% Charlestown, 41.7% Central, 36.2% 20% Hyde Park, 21.1% Roslindale, 15.2% Allston-Brighton, 10.3% East Boston, 9.0% Back Bay-Beacon Hill, 5.1% 0% Fenway-Kenmore, 4.3% Boston, -1.6% North Dorchester, -7.2% 16 South Dorchester, -6.0% 0 2 4 6 8 10 12 14 18 20 Roxbury, -6.1% Mattapan, -10.7% South End, -7.5% Jamaica Plain, -16.0% -20% Harbor Islands, -16.4% -40% Planning Districts Source: 2010 U.S. Census, BRA Research Division Analysis
  • 12.
    Change in Hispanic/LatinoPopulation – BRA Planning Districts (2000 – 2010) 120% 100% West Roxbury, 96.6% Change in Hispanic/Latino Population (2000 - 2010) 80% Central, 68.2% 60% Hyde Park, 62.0% South Boston, 49.1% East Boston, 42.9% 40% Back Bay-Beacon Hill, 29.8% Roxbury, 29.0% Boston, 26.8% Fenway-Kenmore, 28.0% South Dorchester, 22.1% Mattapan, 20.1% 20% Allston-Brighton, 17.4% Roslindale, 16.1% South End, 20.3% Harbor Islands, 11.7% North Dorchester, 15.9% 0% Jamaica Plain, -2.2% 0 2 4 6 8 10 12 14 16 18 20 Charlestown, -9.8% -20% Planning Districts Source: 2010 U.S. Census, BRA Research Division Analysis
  • 13.
    Change in AsianPopulation – BRA Planning Districts (2000 – 2010) 140% Roxbury, 124.7% 120% 100% Harbor Islands, 100.0% Change in Asian Population (2000 - 2010) 80% Charlestown, 77.2% West Roxbury, 81.5% 60% Fenway-Kenmore, 46.3% South End, 44.6% 40% Back Bay-Beacon Hill, 44.9% South Boston, 40.6% Boston, 24.6% Jamaica Plain, 26.7% Allston-Brighton, 20.7% 20% Central, 18.5% Hyde Park, 12.6% South Dorchester, 11.9% Mattapan, 6.9% 0% North Dorchester, -0.4% 0 2 4 6 8 10 12 14 16 18 20 East Boston, -8.6% -20% Roslindale, -19.6% -40% Planning Districts Source: 2010 U.S. Census, BRA Research Division Analysis
  • 14.
    Planning District DiversityIndex (2000-2010) North 2010 2000 Dorchester Back Bay/ 0.80 South Beacon Hill Dorchester 0.70 Harbor South Boston 0.60 Islands 0.50 Mattapan 0.40 Boston 0.30 0.20 Charlestown South End 0.10 0.00 West Roxbury Roslindale Central Hyde Park Allston/ Jamaica Plain Brighton Feneway/ Roxbury Kenmore East Boston Source: 2010 U.S. Census, BRA Research Division Analysis
  • 15.
  • 16.
    Unemployed With LessThan High School Education by Industry  The unemployment rate for workers with less than high school education is 12.6%.  Unemployed workers with less than high school education worked mainly in the manufacturing, administrative support, and food services industries. Less than High School (n = 7,622) Not Specified 15.9% Government 2.5% Other Services 0.9% Accommodation and Food Services 13.2% Arts, Entertainment, and Recreation 3.0% Healthcare and Social Assistance 4.5% Educational Services 1.5% Administrative Support and Waste Management Services 14.1% Professional, Scientific and Technical Services 0.0% Real Estate and Rental & Leasing 4.3% Finance and Insurance 0.0% Information 0.0% Transportation and Warehousing 4.0% Retail Trade 12.2% Wholesale Trade 3.6% Manufacturing 15.0% Construction 5.5% 0% 2% 4% 6% 8% 10% 12% 14% 16% 18% Source: 2009 American Community Survey Public Use Micro-data Sample (PUMS), BRA Research Division Analysis
  • 17.
    Unemployed With HighSchool Education by Industry  The unemployment rate for workers a high school education is 14.7%.  Unemployed workers with a high school education worked mainly in the construction, administrative support, and food services industries. High School (n = 12,760) Not Specified 7.2% Government 6.4% Other Services 9.1% Accommodation and Food Services 10.1% Arts, Entertainment, and Recreation 1.3% Healthcare and Social Assistance 7.6% Educational Services 2.0% Administrative Support and Waste Management Services 13.7% Professional, Scientific and Technical Services 4.6% Real Estate and Rental & Leasing 1.4% Finance and Insurance 0.0% Information 1.8% Transportation and Warehousing 4.2% Retail Trade 3.9% Wholesale Trade 6.9% Manufacturing 2.9% Construction 16.8% 0% 2% 4% 6% 8% 10% 12% 14% 16% 18% Source: 2009 American Community Survey Public Use Micro-data Sample (PUMS), BRA Research Division Analysis
  • 18.
    Unemployed With SomeCollege Education by Industry  The unemployment rate for workers with some college education is 7.9%.  Unemployed workers with some college education worked mainly in the healthcare, food services, and retail industries. Some College (n = 11,699) Not Specified 13.3% Government 4.4% Other Services 5.6% Accommodation and Food Services 15.4% Arts, Entertainment, and Recreation 1.7% Healthcare and Social Assistance 17.7% Educational Services 5.1% Administrative Support and Waste Management Services 9.1% Professional, Scientific and Technical Services 1.1% Real Estate and Rental & Leasing 2.6% Finance and Insurance 3.0% Information 0.0% Transportation and Warehousing 3.9% Retail Trade 10.0% Wholesale Trade 2.1% Manufacturing 2.4% Construction 2.6% 0% 2% 4% 6% 8% 10% 12% 14% 16% 18% 20% Source: 2009 American Community Survey Public Use Micro-data Sample (PUMS), BRA Research Division Analysis
  • 19.
    Unemployed With Associate’sDegree by Industry  The unemployment rate for workers with an associate’s degree is 9.8%.  Unemployed workers with an associate’s degree worked mainly in the retail, food services, and government industries. Associate's Degree (n = 2,188) Not Specified 9.3% Government 12.2% Other Services 0.0% Accommodation and Food Services 14.8% Arts, Entertainment, and Recreation 4.9% Healthcare and Social Assistance 11.3% Educational Services 0.0% Administrative Support and Waste Management Services 0.0% Professional, Scientific and Technical Services 3.4% Real Estate and Rental & Leasing 0.0% Finance and Insurance 0.0% Information 0.0% Transportation and Warehousing 10.7% Retail Trade 13.9% Wholesale Trade 10.1% Manufacturing 5.7% Construction 3.6% 0% 2% 4% 6% 8% 10% 12% 14% 16% Source: 2009 American Community Survey Public Use Micro-data Sample (PUMS), BRA Research Analysis
  • 20.
    Unemployed With Bachelor’sDegree by Industry  The unemployment rate for workers with a bachelor’s degree is 4.5%.  Unemployed workers with a bachelor’s degree worked mainly in the education, healthcare, and finance industries. Bachelor's Degree (n = 6,881) Not Specified 8.2% Government 2.3% Other Services 0.0% Accommodation and Food Services 1.3% Arts, Entertainment, and Recreation 5.7% Healthcare and Social Assistance 12.6% Educational Services 12.9% Administrative Support and Waste Management Services 5.1% Professional, Scientific and Technical Services 9.6% Real Estate and Rental & Leasing 3.1% Finance and Insurance 10.7% Information 1.4% Transportation and Warehousing 0.0% Retail Trade 9.4% Wholesale Trade 4.5% Manufacturing 6.5% Construction 6.8% 0% 2% 4% 6% 8% 10% 12% 14% Source: 2009 American Community Survey Public Use Micro-data Sample (PUMS), BRA Research Division Analysis
  • 21.
    Unemployed With GraduateDegree by Industry  The unemployment rate for workers with a graduate degree is 4.0%.  Unemployed workers with a graduate degree worked mainly in the professional services, information, and healthcare industries. Graduate Degree (n = 3,045) Not Specified 3.3% Government 3.1% Other Services 0.0% Accommodation and Food Services 0.0% Arts, Entertainment, and Recreation 0.0% Healthcare and Social Assistance 18.0% Educational Services 10.9% Administrative Support and Waste Management Services 3.2% Professional, Scientific and Technical Services 31.7% Real Estate and Rental & Leasing 0.0% Finance and Insurance 8.2% Information 21.5% Transportation and Warehousing 0.0% Retail Trade 0.0% Wholesale Trade 0.0% Manufacturing 0.0% Construction 0.0% 0 0.05 0.1 0.15 0.2 0.25 0.3 0.35 Source: 2009 American Community Survey Public Use Micro-data Sample (PUMS), BRA Research Division Analysis
  • 22.
    Boston vs. U.S.on Unemployment Rate
  • 23.
    Unemployment Rate byRace  Compared to the U.S., Boston’s unemployment rate is lower for people of all races except Asian. 18% 16% 16% 15% 14% 13% 12% 12% 10% 10% 9% 9% Unemployment Rate (US) 8% 8% Unemployment Rate (Boston) 6% 6% 5% 4% 2% 0% White Black Hispanic Asian Other Source: 2009 American Community Survey Public Use Micro-data Sample (PUMS), BRA Research Division Analysis
  • 24.
    Unemployment Rate byIncome  Boston’s unemployment rate is highest for people in the lowest income brackets. 40% 35% 34% 30% 25% 23% 20% Unemployment Rate (US) 14% Unemployment Rate (Boston) 15% 11% 10% 6% 5% 5% 3% 4% 3% 3% 3% 2% 2% 1% 1% 1% 0% Less than $10,000 to $20,000 to $35,000 to $50,000 to $75,000 to $100,000 to $150,000 or $10,000 $19,999 $34,999 $49,999 $74,999 $99,999 $149,999 more Source: 2009 American Community Survey Public Use Micro-data Sample (PUMS), BRA Research Division Analysis
  • 25.
    Unemployment Rate byEducational Attainment  Residents with higher education levels are more likely to be employed than residents with lower education levels. 20% 18.9% 18% 16% 14.7% 14% 12.6% 12.3% 12% 10.2% 9.8% 10% Unemployment Rate (US) 7.9% Unemployment Rate (Boston) 8% 6.9% 6% 5.4% 4.5% 4.0% 3.6% 4% 2% 0% Less than HS HS Some College Associates Bachelors Graduate Source: 2009 American Community Survey Public Use Micro-data Sample (PUMS), BRA Research Division Analysis
  • 26.
  • 27.
    Proportion of thePopulation that is Foreign Born (1850-2009)  Historically, Boston has had a greater proportion of foreign-born residents than both the Commonwealth of Massachusetts and the nation as a whole.  Since the 1970s, the proportion of foreign-born residents in Boston has grown dramatically. 40% Boston 35% Massachusetts United States 30% 25% 20% 15% 10% 5% 0% 1850 1860 1870 1880 1890 1900 1910 1920 1930 1940 1950 1960 1970 1980 1990 2000 2006 2009 Source: U.S. Census Bureau, American Community Survey, BRA Research Division Analysis
  • 28.
    Boston’s Foreign Born Populatio n Source: 2009 American Community Survey Public Use Micro-data Sample (PUMS), BRA Research Division Analysis
  • 29.
    Countries of Originfor Boston’s Foreign-Born Population, 2009  Today most of Boston’s immigrants come from the Caribbean, Latin America, and Asia Share of the Foreign-Born Population in Boston Dominican Republic 9.4% China 9.0% Haiti 7.9% Vietnam 4.6% El Salvador 4.5% Brazil 4.4% Cape Verde 4.2% Colombia 4.0% Jamaica 3.7% Ireland 2.2% 0.0% 1.0% 2.0% 3.0% 4.0% 5.0% 6.0% 7.0% 8.0% 9.0% 10.0% Source: 2005-2009 American Community Survey, BRA Research Division Analysis.
  • 30.
    Age by Nativity Olderresidents make up a far greater share of foreign-born residents than native residents. 45.0% 40.6% 40.0% 35.0% 34.0% 30.0% 26.1% 25.0% 21.0% 20.7% Foreign-Born 20.0% Native-Born 17.1% 15.0% 13.6% 12.3% 10.0% 9.0% 5.7% 5.0% 0.0% 0 to 17 years 18 to 34 years 35 to 49 years 50 to 64 years 65+ years Source: 2009 American Community Survey Public Use Micro-data Sample (PUMS), BRA Research Division Analysis
  • 31.
    Nativity of Parent(s) Althoughforeign-born children (0 to 17 years) make up a small share of all children in Boston, more than 40% of all children in Boston have at least one parent that is foreign born. 40.3% Native-Born Foreign-Born 59.7% Source: 2009 American Community Survey Public Use Micro-data Sample (PUMS), BRA Research Division Analysis
  • 32.
    Income by Nativity Asmaller portion of foreign-born residents have high-paying jobs than native residents. 35% 33% 30% 30% 25% 20% 19% 18% 16% 14% Foreign-Born 15% 14% 12% 12% Native-Born 10% 9% 7% 5% 4% 5% 3% 3% 1% 0% Less than $10,000 to $20,000 to $35,000 to $50,000 to $75,000 to $100,000 to $150,000 or $10,000 $19,999 $34,999 $49,999 $74,999 $99,999 $149,999 more Source: 2009 American Community Survey Public Use Micro-data Sample (PUMS), BRA Research Division Analysis
  • 33.
    Wage Differential ByEducational Attainment As educational attainment improves, native-born residents continue to earn higher wages than foreign-born residents. $100,000.00 $94,550.30 $90,000.00 $80,000.00 $70,000.00 $66,866.76 $62,678.98 $60,000.00 $50,000.00 $42,252.64 Foreign-Born $40,284.47 $40,000.00 $36,249.95 Native-Born $32,240.60 $30,144.64 $28,148.54 $30,000.00 $22,197.56 $17,401.58 $20,000.00 $16,317.97 $10,000.00 $- Less than High High School Some College Associate's Bachelor's Graduate School Degree Degree Degree Source: 2009 American Community Survey Public Use Micro-data Sample (PUMS), BRA Research Division Analysis
  • 34.
    Top 5 Countriesof Origin for Foreign-Born Population by Planning District Allston-Brighton 0.1 0 0.2 Back Bay-Beacon Hill 0.1 0.15 0.2 0 0.05 China 15.3% China 15.3% Brazil 11.7% Canada 7.3% Russia 6.9% United Kingdom 6.2% El Salvador 3.7% France 6.2% Ukraine 3.6% Colombia 3.7% Central 0 0.1 0.2 0.3 0.4 0.5 Charlestown 0 0.1 0.2 0.3 0.4 China 43.0% China 31.5% Vietnam 6.4% Dominican Republic 23.3% Italy 6.2% Russia 4.6% India 3.5% Canada 3.1% Japan 3.2% Philippines 2.5% Source: 2005-2009 American Community Survey, BRA Research Division
  • 35.
    Top 5 Countriesof Origin for Foreign-Born Population by Planning District (cont.) Jamaica Plain 0 0.05 0.1 0.15 Mattapan 0 0.05 0.1 0.15 0.2 0.25 0.3 0.35 Dominican Republic 14.0% Haiti 28.8% China 13.8% Jamaica 12.5% India 6.3% Cape Verde 10.6% Ireland 3.3% Dominican Republic 7.7% United Kingdom 2.8% Trinidad and Tobago 5.3% North Dorchester 0 0.05 0.1 0.15 0.2 0.25 Roslindale 0 0.05 0.1 0.15 0.2 Cape Verde 23.3% Dominican Republic 17.8% Vietnam 13.2% Haiti 10.3% Albania 7.8% Albania 6.4% Dominican Republic 7.8% Guatemala 6.3% Haiti 4.9% Ireland 4.0% Source: 2005-2009 American Community Survey, BRA Research Division
  • 36.
    Top 5 Countriesof Origin for Foreign-Born Population by Planning District (cont.) Roxbury 0 0.05 0.1 0.15 0.2 0.25 0.3South Boston 0 0.05 0.1 0.15 0.2 0.25 0.3 0.35 Dominican Republic 23.9% Dominican Republic 32.9% Haiti 13.9% China 15.8% Jamaica 8.0% Cape Verde 6.9% Cape Verde 6.3% Philippines 4.0% Trinidad and Tobago 4.9% Vietnam 3.9% South Dorchester 0 0.05 0.1 0.15 0.2 0.25 South End 0 0.05 0.1 0.15 0.2 0.25 0.3 0.35 Vietnam China 29.2% 19.2% Jamaica Dominican Republic 11.3% 10.9% Haiti Ethiopia 5.0% 10.7% Cape Verde Colombia 4.0% 10.3% Dominican Republic Canada 3.9% 7.6% Source: 2005-2009 American Community Survey, BRA Research Division
  • 37.
    Top 5 Countriesof Origin for Foreign-Born Population by Planning District (cont.) West Roxbury 0 0.05 0.1 0.15 Haiti 12.4% China 10.1% Dominican Republic 8.7% Ireland 7.6% Greece 6.0% Source: 2005-2009 American Community Survey, BRA Research Division