St. Lucia - Trade Profile [UWI's Shridath Ramphal Centre]
•
0 likes•203 views


Recommended
Recommended
More Related Content
What's hot
What's hot (16)
Viewers also liked
Viewers also liked (16)
Similar to St. Lucia - Trade Profile [UWI's Shridath Ramphal Centre]
Similar to St. Lucia - Trade Profile [UWI's Shridath Ramphal Centre] (20)
More from Office of Trade Negotiations (OTN), CARICOM Secretariat
More from Office of Trade Negotiations (OTN), CARICOM Secretariat (20)
St. Lucia - Trade Profile [UWI's Shridath Ramphal Centre]
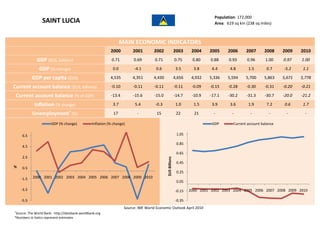
- 1. Population: 172,000 SAINT LUCIA Area: 619 sq km (238 sq miles) MAIN ECONOMIC INDICATORS 2000 2001 2002 2003 2004 2005 2006 2007 2008 2009 2010 GDP ($US, billions) 0.71 0.69 0.71 0.75 0.80 0.88 0.93 0.96 1.00 0.97 1.00 GDP (% change) 0.0 -4.1 0.6 3.5 3.8 4.4 4.8 1.5 0.7 -5.2 1.1 GDP per capita ($US) 4,535 4,351 4,430 4,656 4,932 5,336 5,594 5,700 5,863 5,671 5,778 Current account balance ($US, billions) -0.10 -0.11 -0.11 -0.11 -0.09 -0.15 -0.28 -0.30 -0.31 -0.20 -0.21 Current account balance (% of GDP) -13.4 -15.6 -15.0 -14.7 -10.9 -17.1 -30.2 -31.3 -30.7 -20.0 -21.2 Inflation (% change) 3.7 5.4 -0.3 1.0 1.5 3.9 3.6 1.9 7.2 0.6 1.7 Unemployment+ (%) 17 - 15 22 21 - - - - - - GDP (% change) Inflation (% change) GDP Current account balance 6.5 1.05 0.85 4.5 0.65 2.5 $US Billions 0.45 % 0.5 0.25 -1.5 2000 2001 2002 2003 2004 2005 2006 2007 2008 2009 2010 0.05 -3.5 -0.15 2000 2001 2002 2003 2004 2005 2006 2007 2008 2009 2010 -5.5 -0.35 Source: IMF World Economic Outlook April 2010 + Source: The World Bank - http://databank.worldbank.org *Numbers in italics represent estimates
- 2. Population: 172,000 SAINT LUCIA Area: 619 sq km (238 sq miles) MAIN TRADE INDICATORS – GOODS 2004 2005 2006 2007 2008 Trade Balance ($US thousands) -341,800 -421,555 -498,622 -561,453 -4,075,530 Total Exported Value ($US thousands) 79,782 64,220 93,746 52,455 117,063 Total Imported Value ($US thousands) 421,582 485,775 592,368 613,908 4,192,593 Top 10 Markets by % of Total Exported Value (2007) Top 10 Markets by % of Total Imported Value (2007) United Kingdom 26% United States of America 42% Trinidad and Tobago 24% Trinidad and Tobago 20% United States of America 14% Japan 6% Barbados 12% United Kingdom 5% Dominica 5% Barbados 4% St Vincent & the Grenadines 5% Thailand 2% Antigua and Barbuda 4% Canada 2% Grenada 4% Finland 1% St Kitts and Nevis 1% France 1% France 1% Panama 1% Electrical, Top 5 Exports by % of Total Exported Value (2008) Commodities electronic Top 5 Imports by % of Total Exported Value (2008) not elsewhere Nuclear reactors, equipment, Vehicles other than boilers, machinery, specified, 10% 0.7% Commodities not railway, tramway, 0.7% elsewhere 0.8% Edible fruit, Beverages, specified, 0.6% nuts, peel of spirits and citrus fruit, vinegar, 10% melons, 28% Electrical, electronic Mineral fuels, equipment, 11% Mineral fuels, oils, oils, distillation distillation products, 20% products, 91% Source: International Trade Centre – www.trademap.org
- 3. Population: 172,000 SAINT LUCIA Area: 619 sq km (238 sq miles) MAIN TRADE INDICATORS – SERVICES 2004 2005 2006 2007 2008 Trade Balance ($US thousands) 219,410 251,720 174,680 168,360 180,600 Total Exported Value ($US thousands) 367,150 423,430 343,560 356,110 361,910 Total Imported Value ($US thousands) 147,740 171,710 168,880 187,750 181,310 Top Exports by % of Total Exported Value (2007) Top Imports by % of Total Imported Value (2007) Travel 83% Transportation 43% Travel 22% Other business services 8% Other business services 21% Transportation 5% Insurance services 8% Communications services 2% Government services 3% Insurance services 2% Communications services 2% Government services 0.5% Royalties and license fees 1% Source: International Trade Centre – www.trademap.org