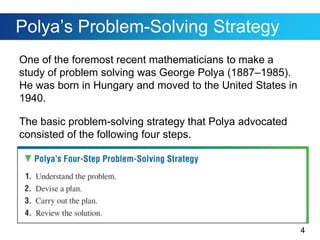
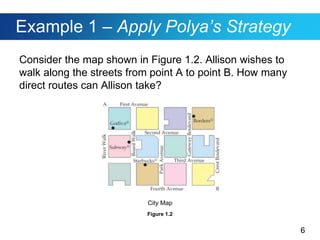
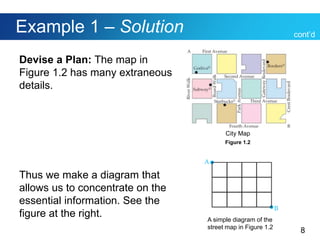
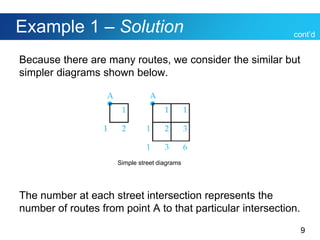
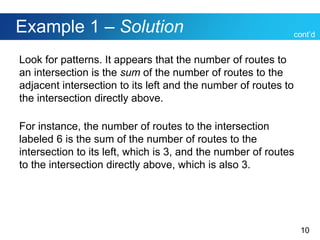
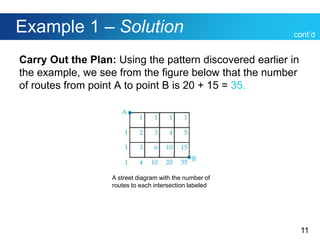
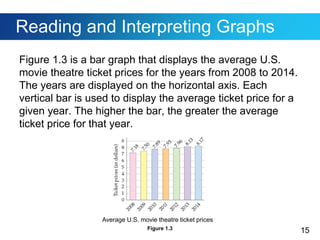
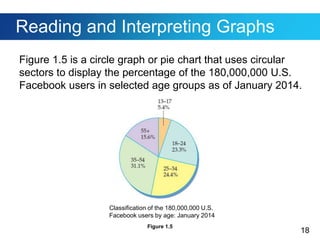
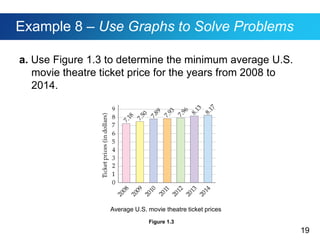
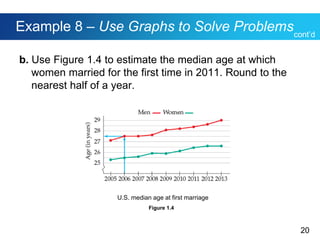
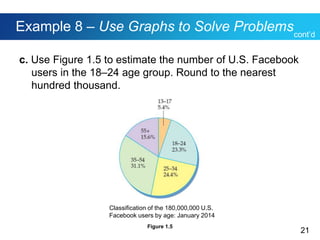
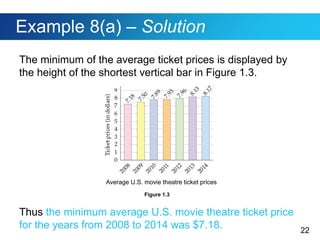
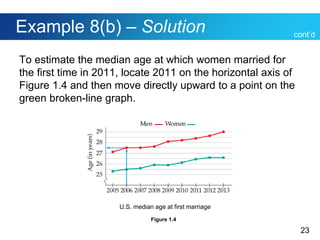
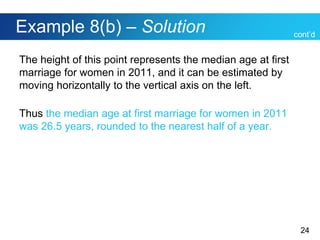
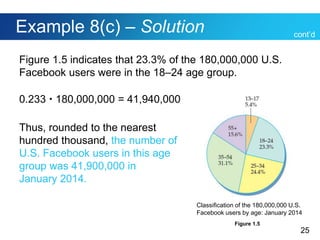
Copyright © Cengage Learning. All rights reserved.
CHAPTER
Problem Solving
1
Copyright © Cengage Learning. All rights reserved.
Problem-Solving Strategies
Section1.3
3
Polya’s Problem-Solving Strategy
4
Polya’s Problem-Solving Strategy
One of the foremost recent mathematicians to make a
study of problem solving was George Polya (1887–1985).
He was born in Hungary and moved to the United States in
1940.
The basic problem-solving strategy that Polya advocated
consisted of the following four steps.
5
Polya’s Problem-Solving Strategy
In Example 1 we apply Polya’s four-step problem-solving
strategy to solve a problem involving the number of routes
between two points.
6
Example 1 – Apply Polya’s Strategy
Consider the map shown in Figure 1.2. Allison wishes to
walk along the streets from point A to point B. How many
direct routes can Allison take?
Figure 1.2
City Map
7
Example 1 – Solution
Understand the Problem: We would not be able to
answer the question if Allison retraced her path or traveled
away from point B.
Thus we assume that on a direct route, she always travels
along a street in a direction that gets her closer to point B.
8
Example 1 – Solution
Devise a Plan: The map in
Figure 1.2 has many extraneous
details.
Thus we make a diagram that
allows us to concentrate on the
essential information. See the
figure at the right. A simple diagram of the
street map in Figure 1.2
cont’d
Figure 1.2
City Map
9
Example 1 – Solution
Because there are many routes, we consider the similar but
simpler diagrams shown below.
The number at each street intersection represents the
number of routes from point A to that particular intersection.
cont’d
Simple street diagrams
10
Example 1 – Solution
Look for patterns. It appears that the number of routes to
an intersection is the sum of the number of routes to the
adjacent intersection to its left and the number of routes to
the intersection directly above.
For instance, the number of routes to the intersection
labeled 6 is the sum of the number of routes to the
intersection to its left, which is 3, and the number of routes
to the intersection directly above, which is also 3.
cont’d
11
Example 1 – Solution
Carry Out the Plan: Using the pattern discovered earlier in
the example, we see from the figure below that the number
of routes from point A to point B is 20 + 15 = 35.
cont’d
A street diagram with the number of
routes to each intersection labeled
12
Example 1 – Solution
Review the Solution: Ask yourself whether a result of 35
seems reasonable.
If you were required to draw each route, could you devise a
scheme that would enable you to draw each route without
missing a route or duplicating a route?
cont’d
13
Reading and Interpreting Graphs
14
Reading and Interpreting Graphs
Graphs are often used to display numerical information in a
visual format that allows the reader to see pertinent
relationships and trends quickly.
Three of the most common types of graphs are the bar
graph, the broken-line graph, and the circle graph.
15
Reading and Interpreting Graphs
Figure 1.3 is a bar graph that displays the average U.S.
movie theatre ticket prices for the years from 2008 to 2014.
The years are displayed on the horizontal axis. Each
vertical bar is used to display the average ticket price for a
given year. The higher the bar, the greater the average
ticket price for that year.
Average U.S. movie theatre ticket prices
Figure 1.3
16
Reading and Interpreting Graphs
Figure 1.4 shows two broken-line graphs. The red
broken-line graph displays the median age at first marriage
for men for the years from 2005 to 2013.
The green broken-line graph displays the median age at
first marriage for women during the same time period. The
symbol on the vertical axis indicates that the ages between
0 and 25 are not displayed.
U.S. median age at first marriage
Figure 1.4
17
Reading and Interpreting Graphs
This break in the vertical axis allows the graph to be
displayed in a compact form.
The segments that connect points on the graph indicate
trends. Increasing trends are indicated by segments that
rise as they move to the right, and decreasing trends are
indicated by segments that fall as they move to the right.
The blue arrows in Figure 1.4 show that the median age at
which men married for the first time in 2006 was 27.5 years,
rounded to the nearest half of a year.
18
Reading and Interpreting Graphs
Figure 1.5 is a circle graph or pie chart that uses circular
sectors to display the percentage of the 180,000,000 U.S.
Facebook users in selected age groups as of January 2014.
Classification of the 180,000,000 U.S.
Facebook users by age: January 2014
Figure 1.5
19
Example 8 – Use Graphs to Solve Problems
a. Use Figure 1.3 to determine the minimum average U.S.
movie theatre ticket price for the years from 2008 to
2014.
Average U.S. movie theatre ticket prices
Figure 1.3
20
Example 8 – Use Graphs to Solve Problems
b. Use Figure 1.4 to estimate the median age at which
women married for the first time in 2011. Round to the
nearest half of a year.
U.S. median age at first marriage
Figure 1.4
cont’d
21
Example 8 – Use Graphs to Solve Problems
c. Use Figure 1.5 to estimate the number of U.S. Facebook
users in the 18–24 age group. Round to the nearest
hundred thousand.
Classification of the 180,000,000 U.S.
Facebook users by age: January 2014
Figure 1.5
cont’d
22
Example 8(a) – Solution
The minimum of the average ticket prices is displayed by
the height of the shortest vertical bar in Figure 1.3.
Thus the minimum average U.S. movie theatre ticket price
for the years from 2008 to 2014 was $7.18.
Average U.S. movie theatre ticket prices
Figure 1.3
23
Example 8(b) – Solution
To estimate the median age at which women married for
the first time in 2011, locate 2011 on the horizontal axis of
Figure 1.4 and then move directly upward to a point on the
green broken-line graph.
cont’d
U.S. median age at first marriage
Figure 1.4
24
Example 8(b) – Solution
The height of this point represents the median age at first
marriage for women in 2011, and it can be estimated by
moving horizontally to the vertical axis on the left.
Thus the median age at first marriage for women in 2011
was 26.5 years, rounded to the nearest half of a year.
cont’d
25
Example 8(c) – Solution
Figure 1.5 indicates that 23.3% of the 180,000,000 U.S.
Facebook users were in the 18–24 age group.
0.233  180,000,000 = 41,940,000
Thus, rounded to the nearest
hundred thousand, the number of
U.S. Facebook users in this age
group was 41,900,000 in
January 2014.
cont’d
Classification of the 180,000,000 U.S.
Facebook users by age: January 2014
Figure 1.5

AufEx4_01_03.ppt

  • 1.
    Copyright © CengageLearning. All rights reserved. CHAPTER Problem Solving 1
  • 2.
    Copyright © CengageLearning. All rights reserved. Problem-Solving Strategies Section1.3
  • 3.
  • 4.
    4 Polya’s Problem-Solving Strategy Oneof the foremost recent mathematicians to make a study of problem solving was George Polya (1887–1985). He was born in Hungary and moved to the United States in 1940. The basic problem-solving strategy that Polya advocated consisted of the following four steps.
  • 5.
    5 Polya’s Problem-Solving Strategy InExample 1 we apply Polya’s four-step problem-solving strategy to solve a problem involving the number of routes between two points.
  • 6.
    6 Example 1 –Apply Polya’s Strategy Consider the map shown in Figure 1.2. Allison wishes to walk along the streets from point A to point B. How many direct routes can Allison take? Figure 1.2 City Map
  • 7.
    7 Example 1 –Solution Understand the Problem: We would not be able to answer the question if Allison retraced her path or traveled away from point B. Thus we assume that on a direct route, she always travels along a street in a direction that gets her closer to point B.
  • 8.
    8 Example 1 –Solution Devise a Plan: The map in Figure 1.2 has many extraneous details. Thus we make a diagram that allows us to concentrate on the essential information. See the figure at the right. A simple diagram of the street map in Figure 1.2 cont’d Figure 1.2 City Map
  • 9.
    9 Example 1 –Solution Because there are many routes, we consider the similar but simpler diagrams shown below. The number at each street intersection represents the number of routes from point A to that particular intersection. cont’d Simple street diagrams
  • 10.
    10 Example 1 –Solution Look for patterns. It appears that the number of routes to an intersection is the sum of the number of routes to the adjacent intersection to its left and the number of routes to the intersection directly above. For instance, the number of routes to the intersection labeled 6 is the sum of the number of routes to the intersection to its left, which is 3, and the number of routes to the intersection directly above, which is also 3. cont’d
  • 11.
    11 Example 1 –Solution Carry Out the Plan: Using the pattern discovered earlier in the example, we see from the figure below that the number of routes from point A to point B is 20 + 15 = 35. cont’d A street diagram with the number of routes to each intersection labeled
  • 12.
    12 Example 1 –Solution Review the Solution: Ask yourself whether a result of 35 seems reasonable. If you were required to draw each route, could you devise a scheme that would enable you to draw each route without missing a route or duplicating a route? cont’d
  • 13.
  • 14.
    14 Reading and InterpretingGraphs Graphs are often used to display numerical information in a visual format that allows the reader to see pertinent relationships and trends quickly. Three of the most common types of graphs are the bar graph, the broken-line graph, and the circle graph.
  • 15.
    15 Reading and InterpretingGraphs Figure 1.3 is a bar graph that displays the average U.S. movie theatre ticket prices for the years from 2008 to 2014. The years are displayed on the horizontal axis. Each vertical bar is used to display the average ticket price for a given year. The higher the bar, the greater the average ticket price for that year. Average U.S. movie theatre ticket prices Figure 1.3
  • 16.
    16 Reading and InterpretingGraphs Figure 1.4 shows two broken-line graphs. The red broken-line graph displays the median age at first marriage for men for the years from 2005 to 2013. The green broken-line graph displays the median age at first marriage for women during the same time period. The symbol on the vertical axis indicates that the ages between 0 and 25 are not displayed. U.S. median age at first marriage Figure 1.4
  • 17.
    17 Reading and InterpretingGraphs This break in the vertical axis allows the graph to be displayed in a compact form. The segments that connect points on the graph indicate trends. Increasing trends are indicated by segments that rise as they move to the right, and decreasing trends are indicated by segments that fall as they move to the right. The blue arrows in Figure 1.4 show that the median age at which men married for the first time in 2006 was 27.5 years, rounded to the nearest half of a year.
  • 18.
    18 Reading and InterpretingGraphs Figure 1.5 is a circle graph or pie chart that uses circular sectors to display the percentage of the 180,000,000 U.S. Facebook users in selected age groups as of January 2014. Classification of the 180,000,000 U.S. Facebook users by age: January 2014 Figure 1.5
  • 19.
    19 Example 8 –Use Graphs to Solve Problems a. Use Figure 1.3 to determine the minimum average U.S. movie theatre ticket price for the years from 2008 to 2014. Average U.S. movie theatre ticket prices Figure 1.3
  • 20.
    20 Example 8 –Use Graphs to Solve Problems b. Use Figure 1.4 to estimate the median age at which women married for the first time in 2011. Round to the nearest half of a year. U.S. median age at first marriage Figure 1.4 cont’d
  • 21.
    21 Example 8 –Use Graphs to Solve Problems c. Use Figure 1.5 to estimate the number of U.S. Facebook users in the 18–24 age group. Round to the nearest hundred thousand. Classification of the 180,000,000 U.S. Facebook users by age: January 2014 Figure 1.5 cont’d
  • 22.
    22 Example 8(a) –Solution The minimum of the average ticket prices is displayed by the height of the shortest vertical bar in Figure 1.3. Thus the minimum average U.S. movie theatre ticket price for the years from 2008 to 2014 was $7.18. Average U.S. movie theatre ticket prices Figure 1.3
  • 23.
    23 Example 8(b) –Solution To estimate the median age at which women married for the first time in 2011, locate 2011 on the horizontal axis of Figure 1.4 and then move directly upward to a point on the green broken-line graph. cont’d U.S. median age at first marriage Figure 1.4
  • 24.
    24 Example 8(b) –Solution The height of this point represents the median age at first marriage for women in 2011, and it can be estimated by moving horizontally to the vertical axis on the left. Thus the median age at first marriage for women in 2011 was 26.5 years, rounded to the nearest half of a year. cont’d
  • 25.
    25 Example 8(c) –Solution Figure 1.5 indicates that 23.3% of the 180,000,000 U.S. Facebook users were in the 18–24 age group. 0.233  180,000,000 = 41,940,000 Thus, rounded to the nearest hundred thousand, the number of U.S. Facebook users in this age group was 41,900,000 in January 2014. cont’d Classification of the 180,000,000 U.S. Facebook users by age: January 2014 Figure 1.5