This document contains the results of a survey about movie watching preferences. It includes the following key results:
- 58.06% of respondents were men and 41.93% were women.
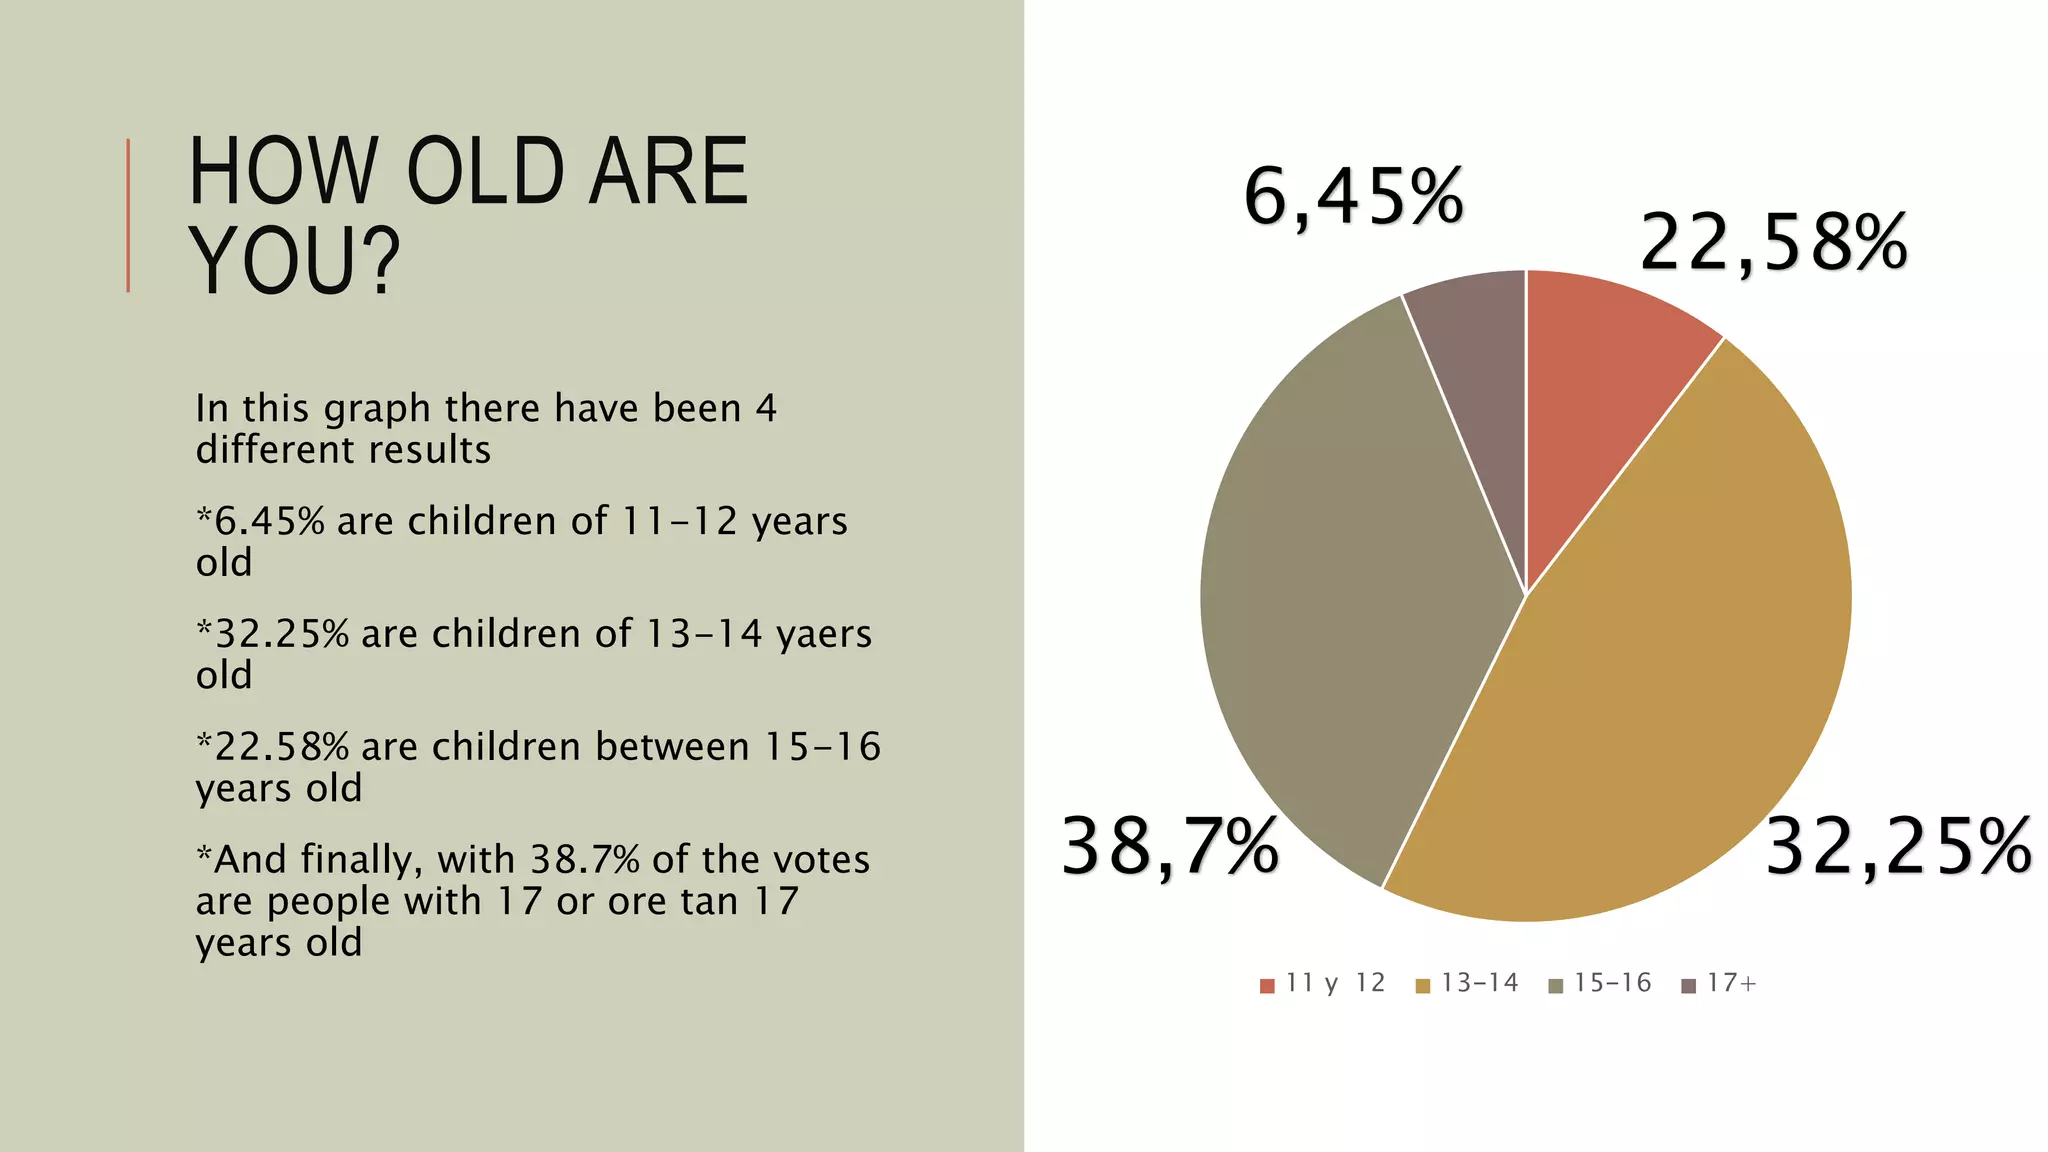
- The largest age groups were 13-14 years old (32.25%) and 17+ years old (38.7%).
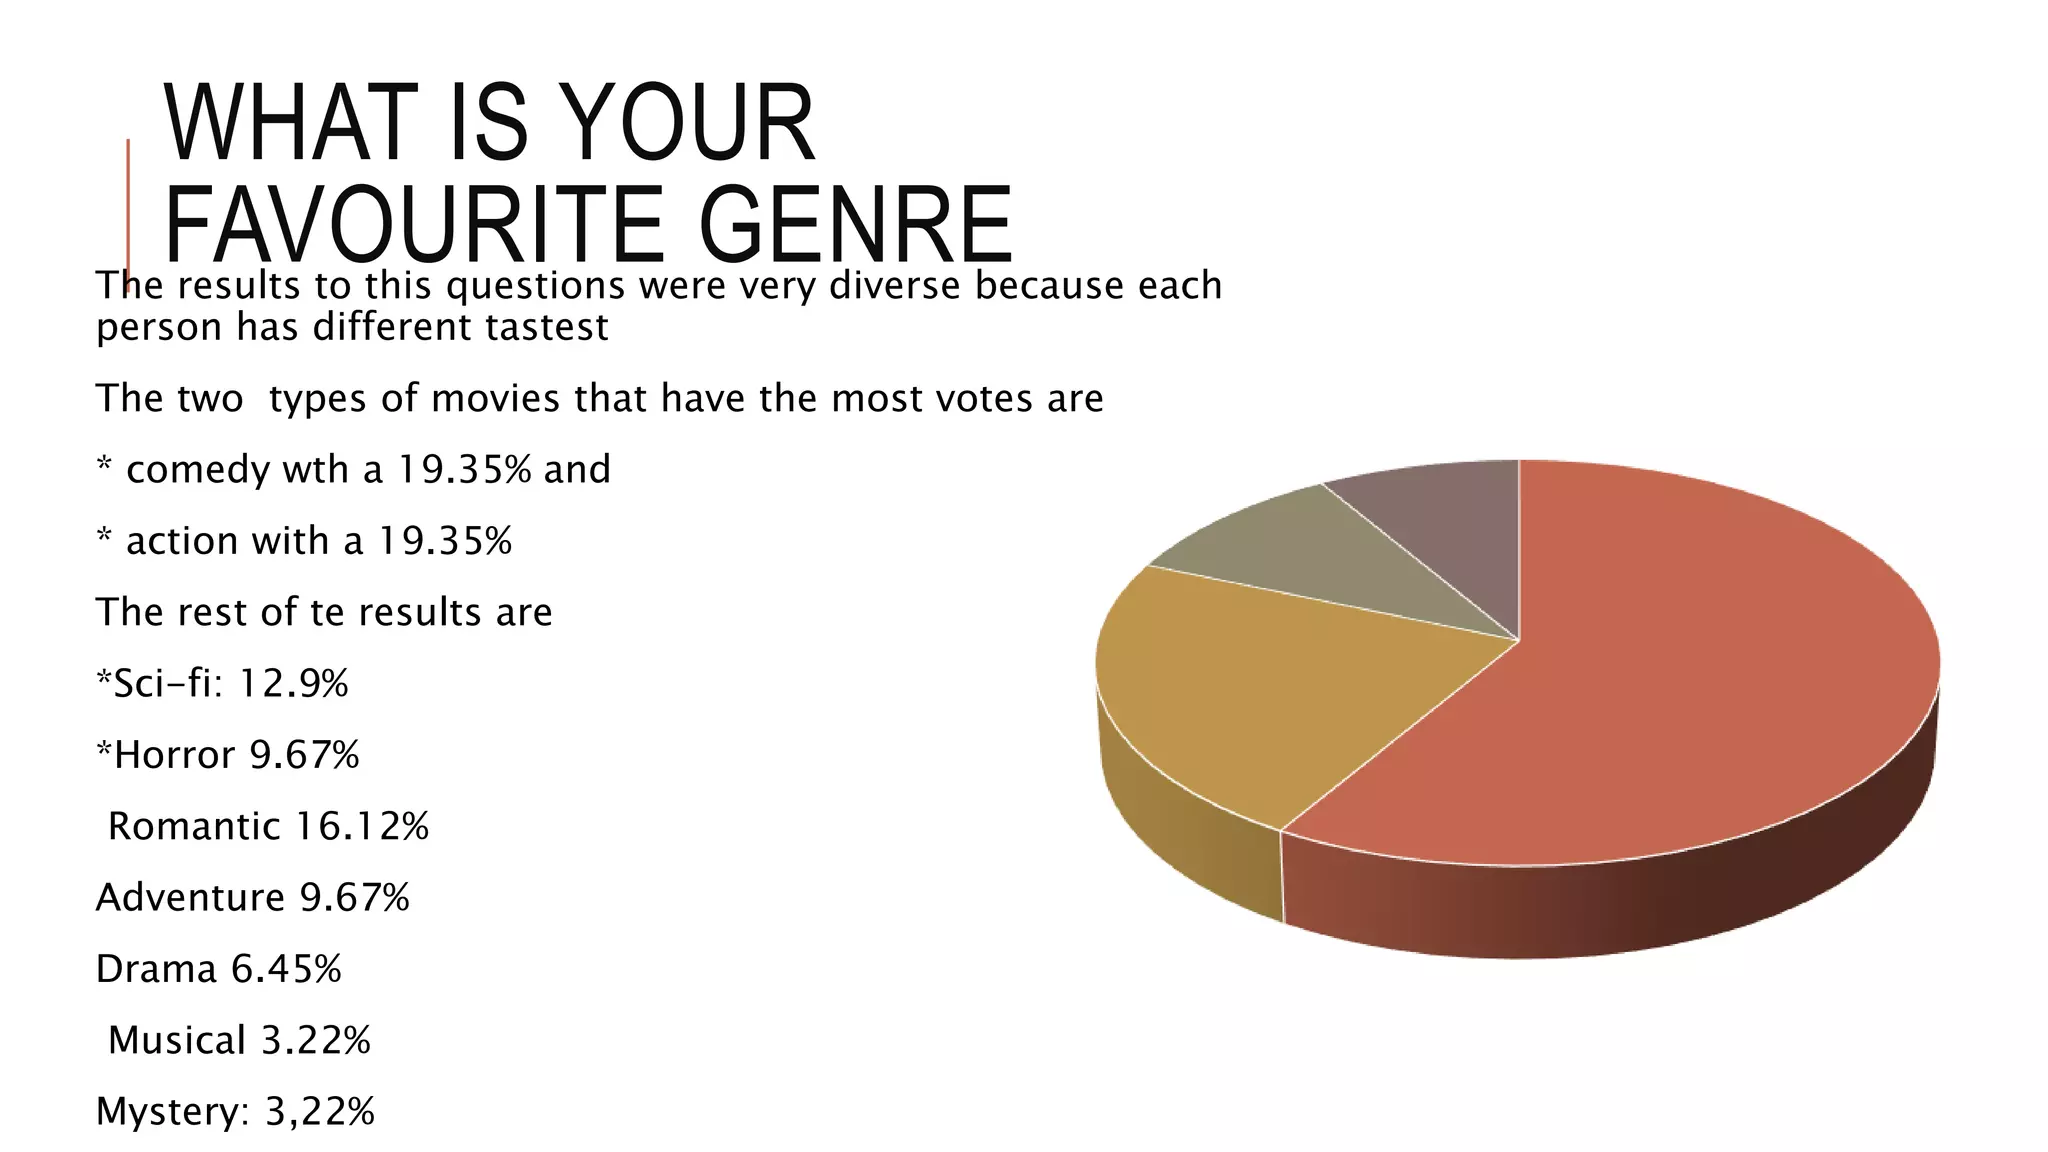
- The most popular movie genres were comedy (19.35%) and action (19.35%).
- The majority of respondents (45.16%) watch movies at least once a week.
- People most often watch movies with friends (41.93%) or family members (38.7%).
- The most popular ways of watching movies were on TV at home (41.93


![Convention1 [autoguardado]](https://cdn.slidesharecdn.com/ss_thumbnails/convention1autoguardado-200513142545-thumbnail.jpg?width=640&height=640&fit=bounds)


