Download to read offline

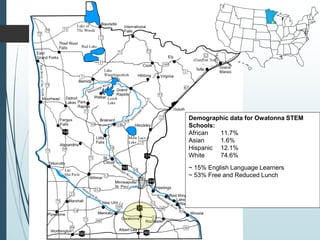
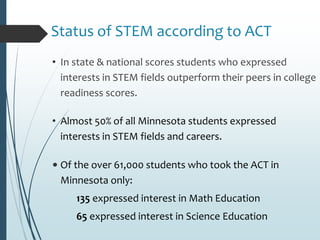
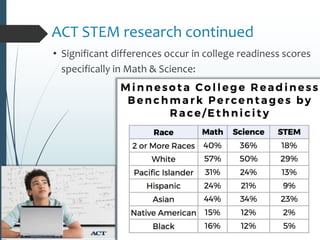
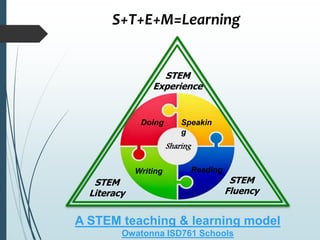
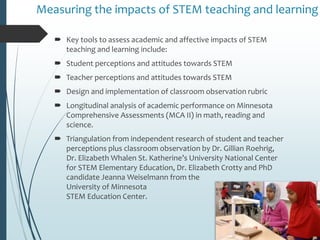
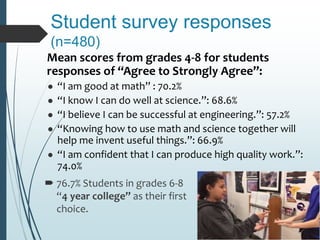
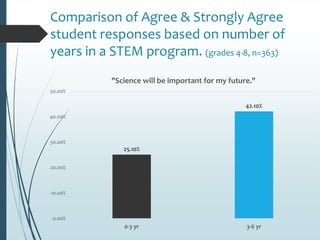
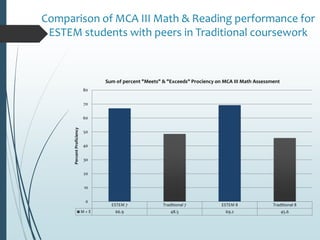
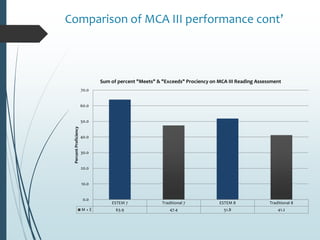
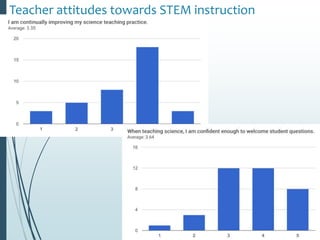
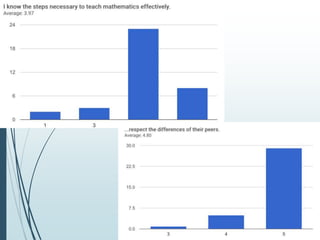

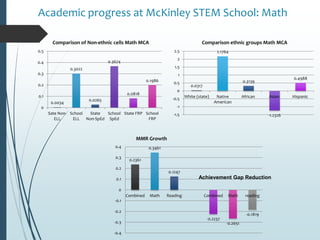

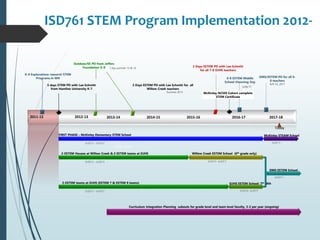
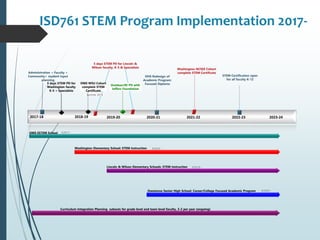

This document provides an overview of STEM education initiatives in the Owatonna Public Schools district. It details the district's implementation of STEM programs from 2011-2017, including professional development for teachers and the expansion of STEM schools at various grade levels. Data is presented on student attitudes, demographics, and academic performance that shows mostly positive outcomes from the STEM programs. The district's goals are to continue developing STEM-focused elementary schools and career-focused programs at the high school level to further improve student outcomes in STEM subjects.


