The document summarizes the results of implementing a STEM initiative in the Owatonna Public Schools in Minnesota. It finds that integrating STEM subjects and applying STEM approaches across the curriculum is improving student outcomes, especially for minority and low-income students. Surveys show growing student interest and efficacy in STEM fields. Test score data indicates higher proficiency rates and accelerated growth among STEM school students compared to peers, with the largest gains for African American, Hispanic, and low-SES students. The initiative is also positively impacting teacher practices and attitudes toward STEM education.


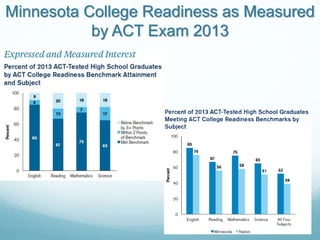
![MN ACT Data by ethnicity & gender
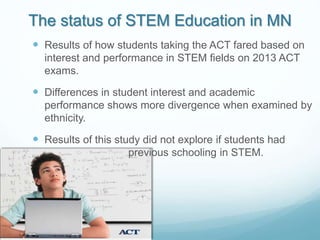
“Essentially, stronger and earlier support structures and interventions
related to career and educational planning and academic preparedness
are needed to see real differences in these still troubling numbers.”
[College Board]](https://image.slidesharecdn.com/msta2015-150601005942-lva1-app6892/85/Msta-2015-4-320.jpg)