Download as PDF, PPTX

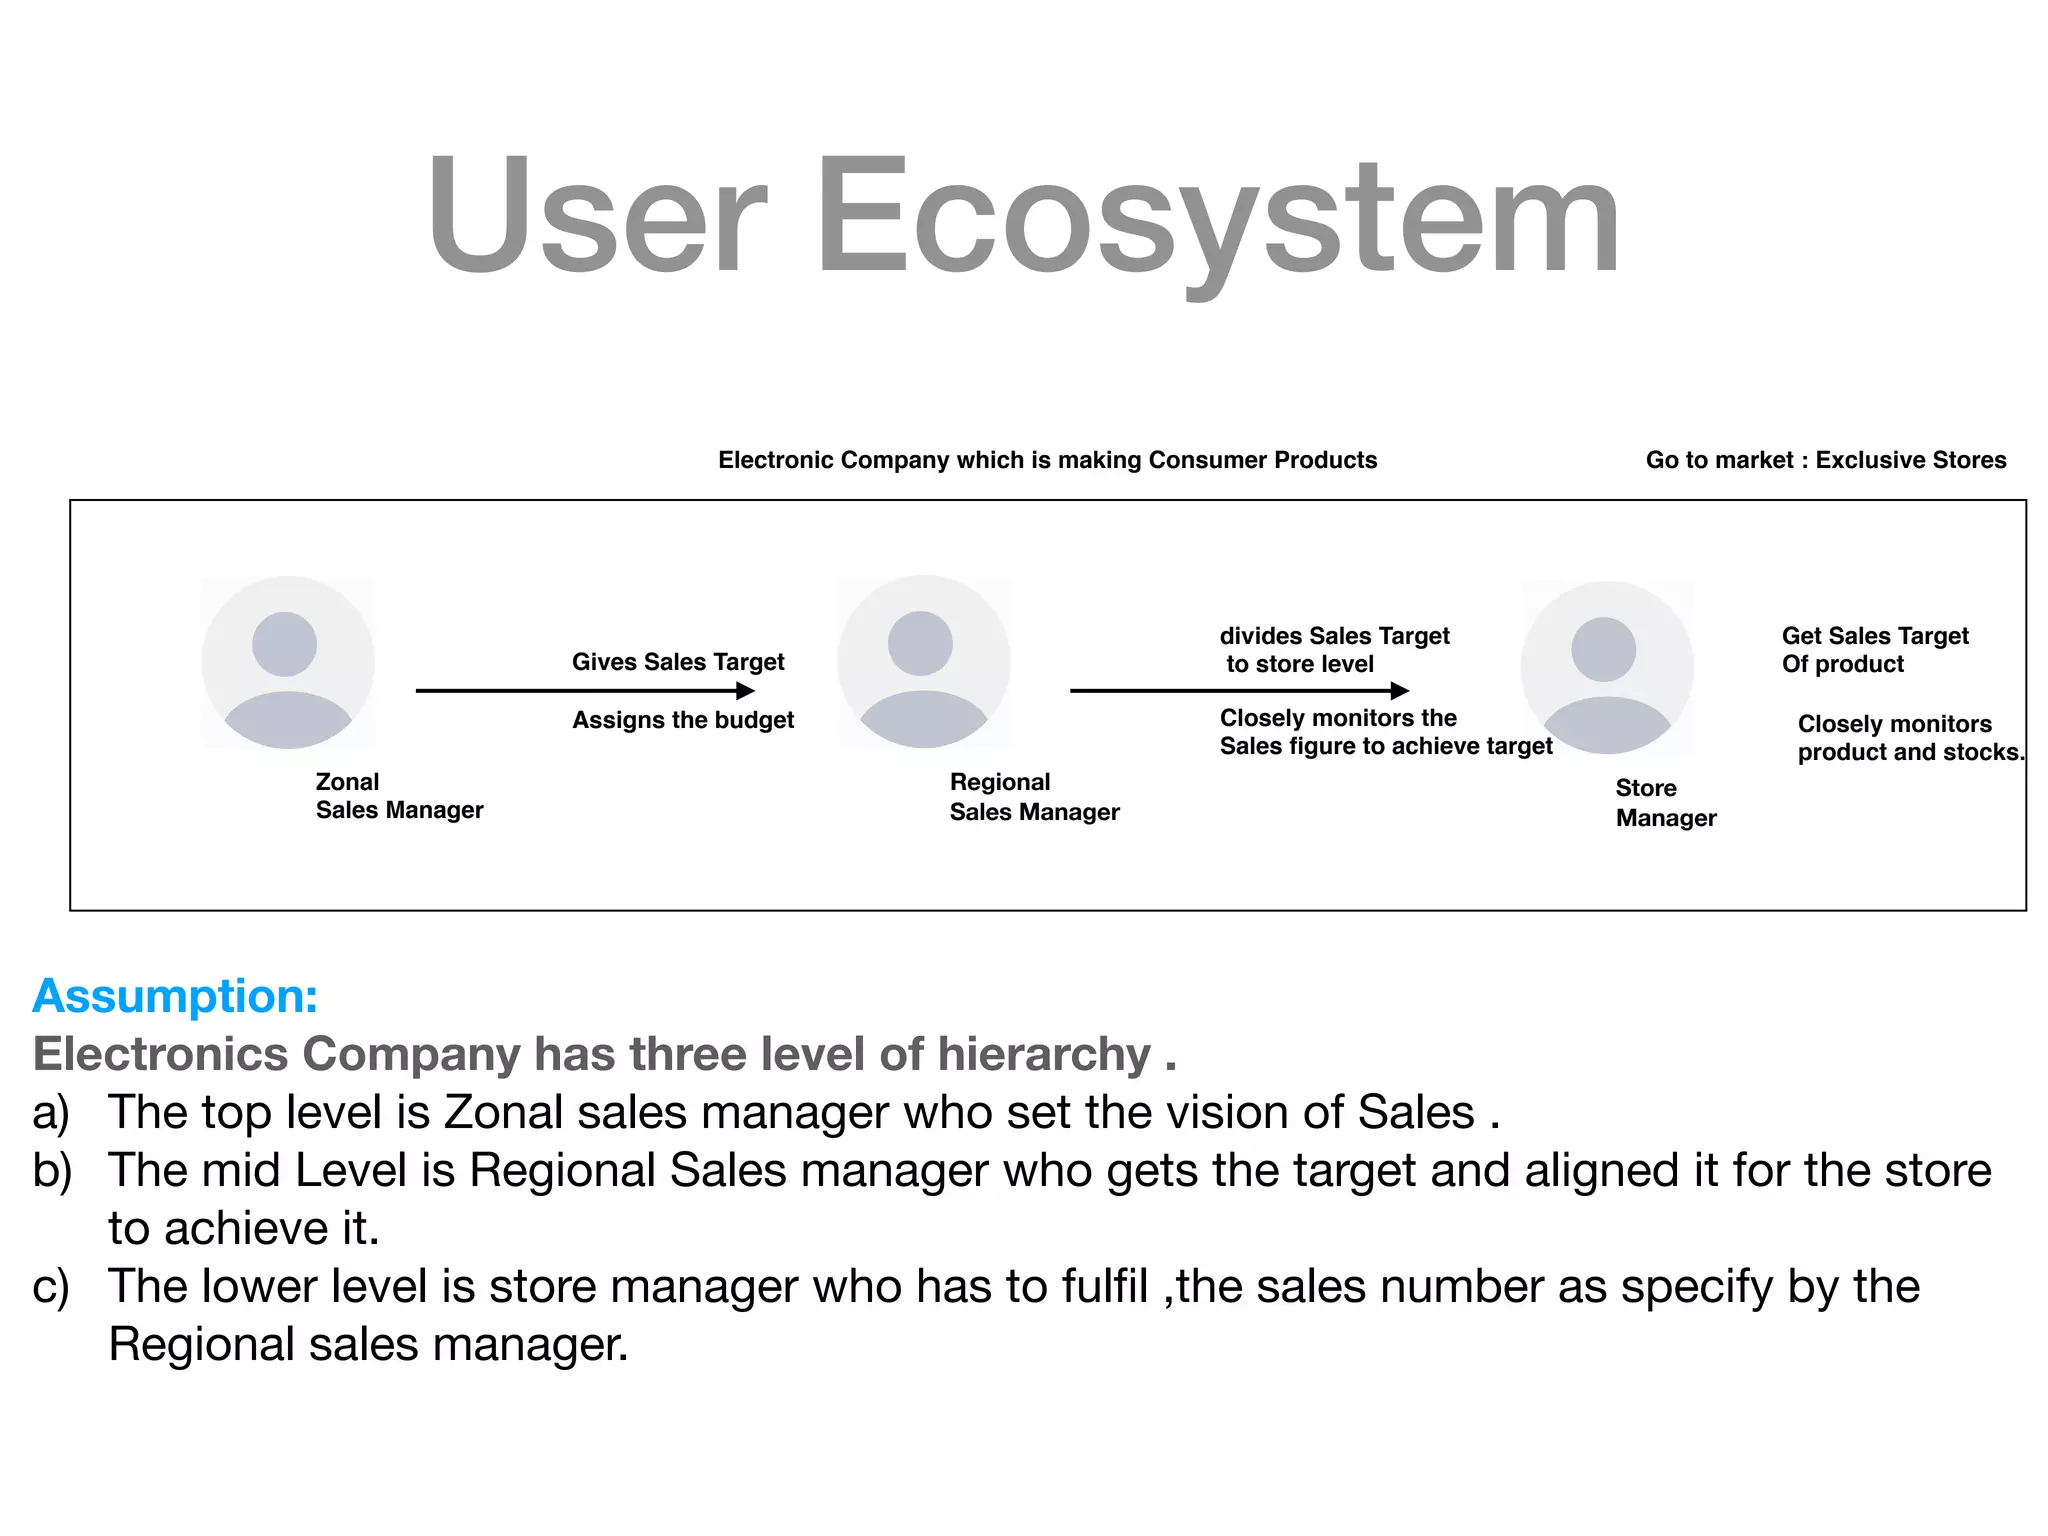
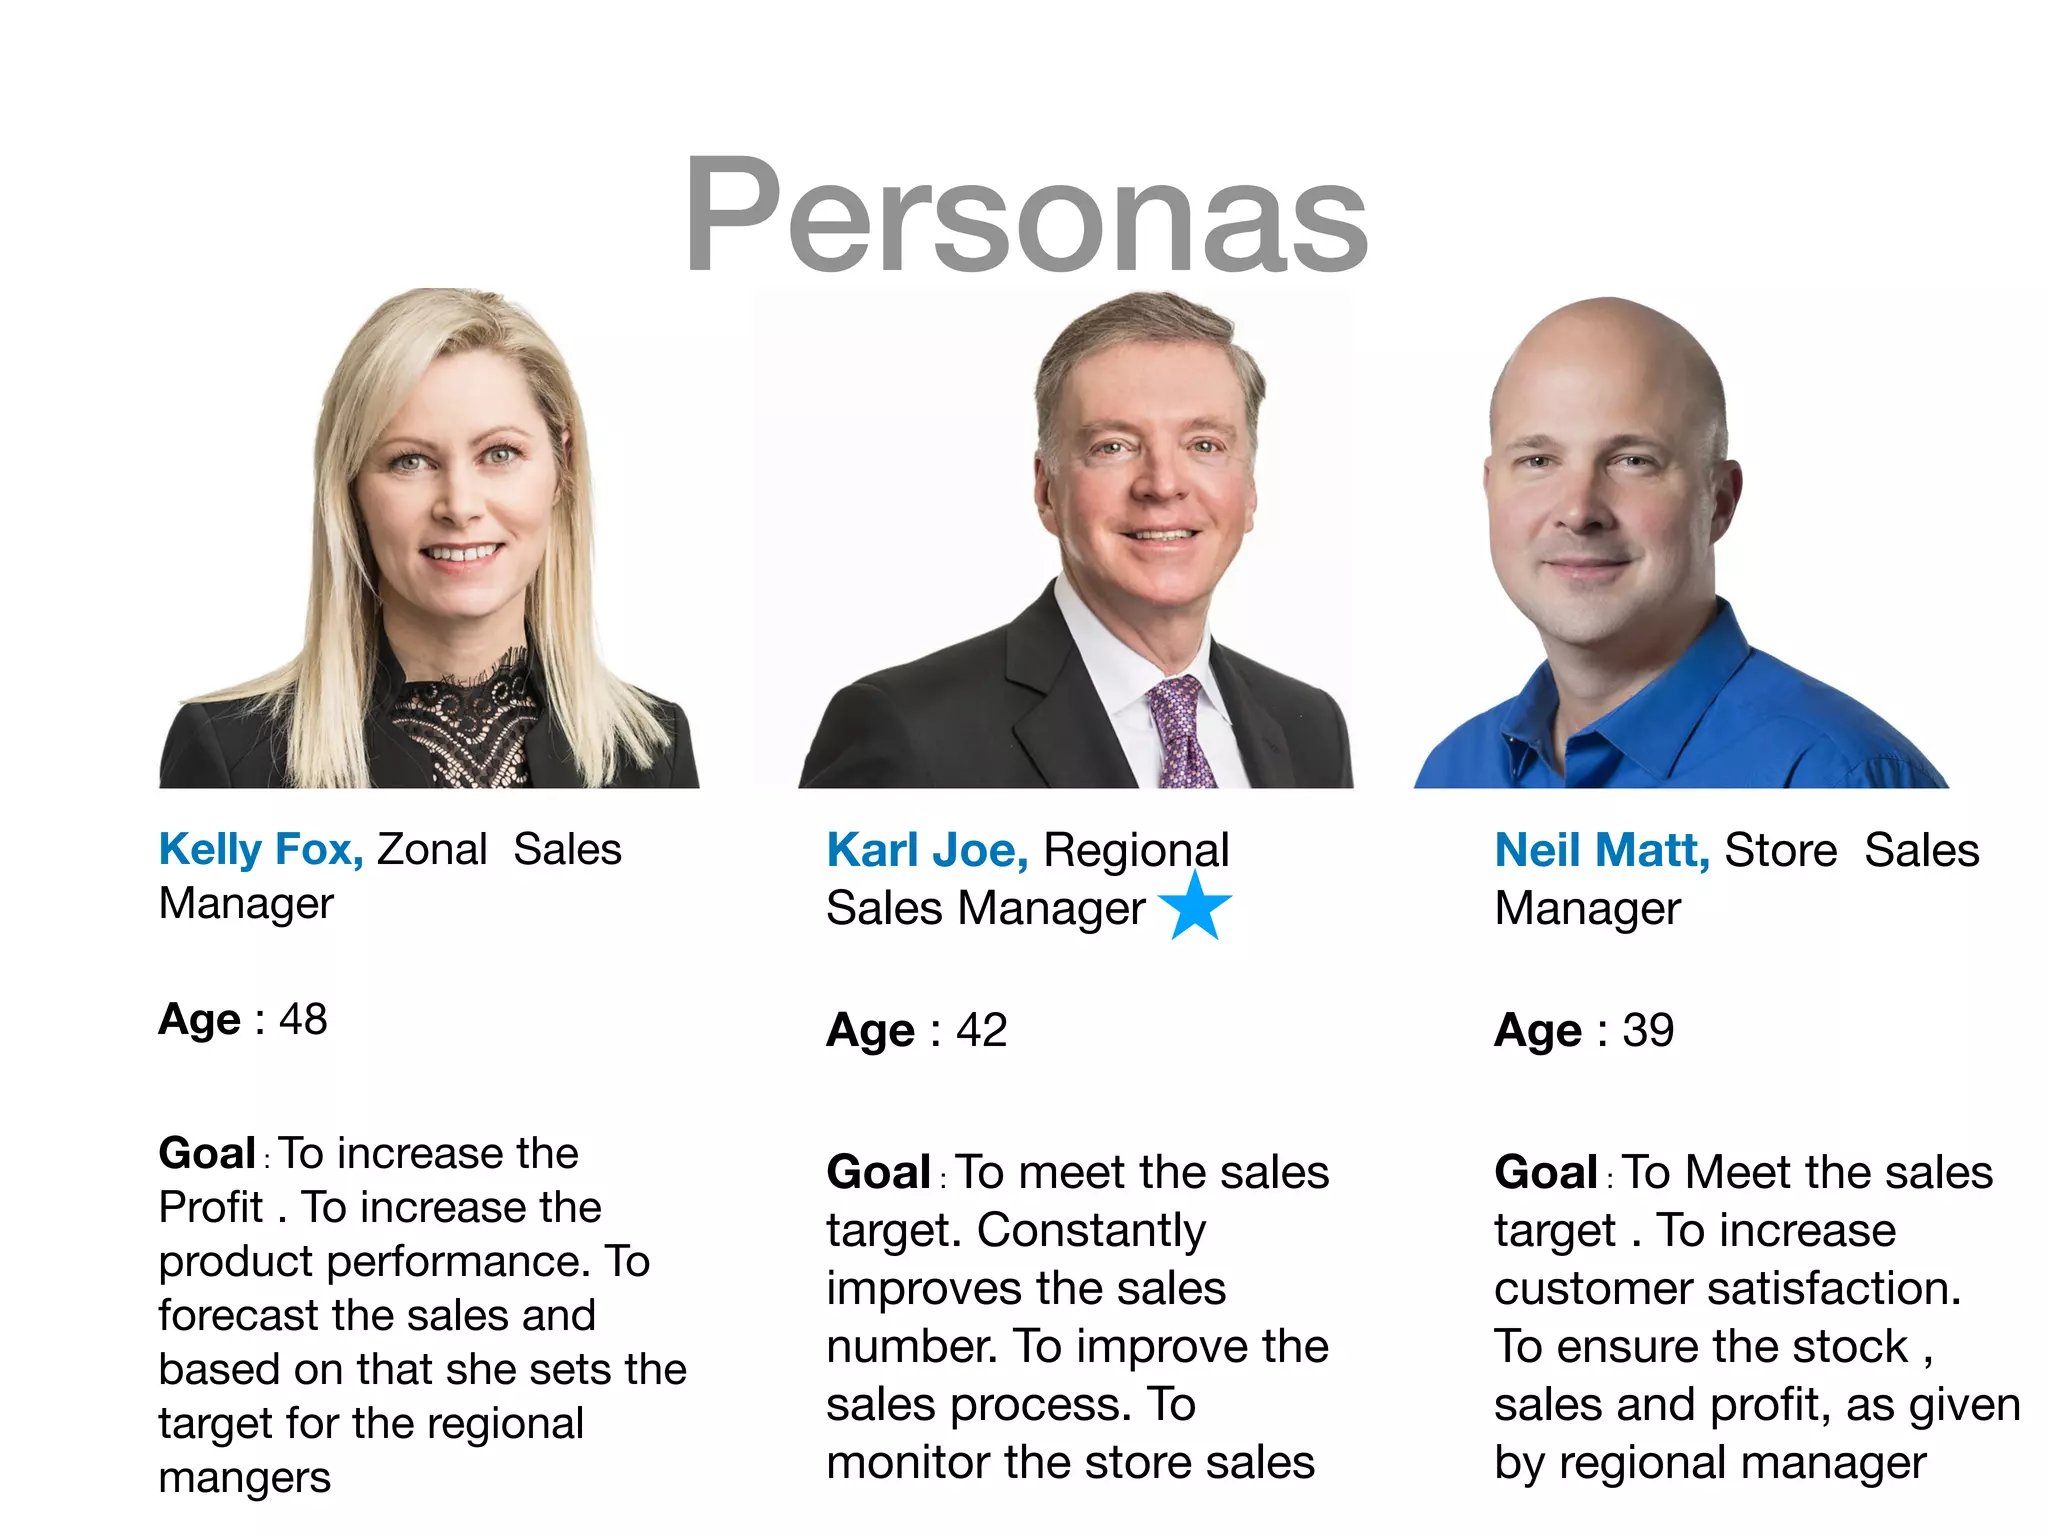

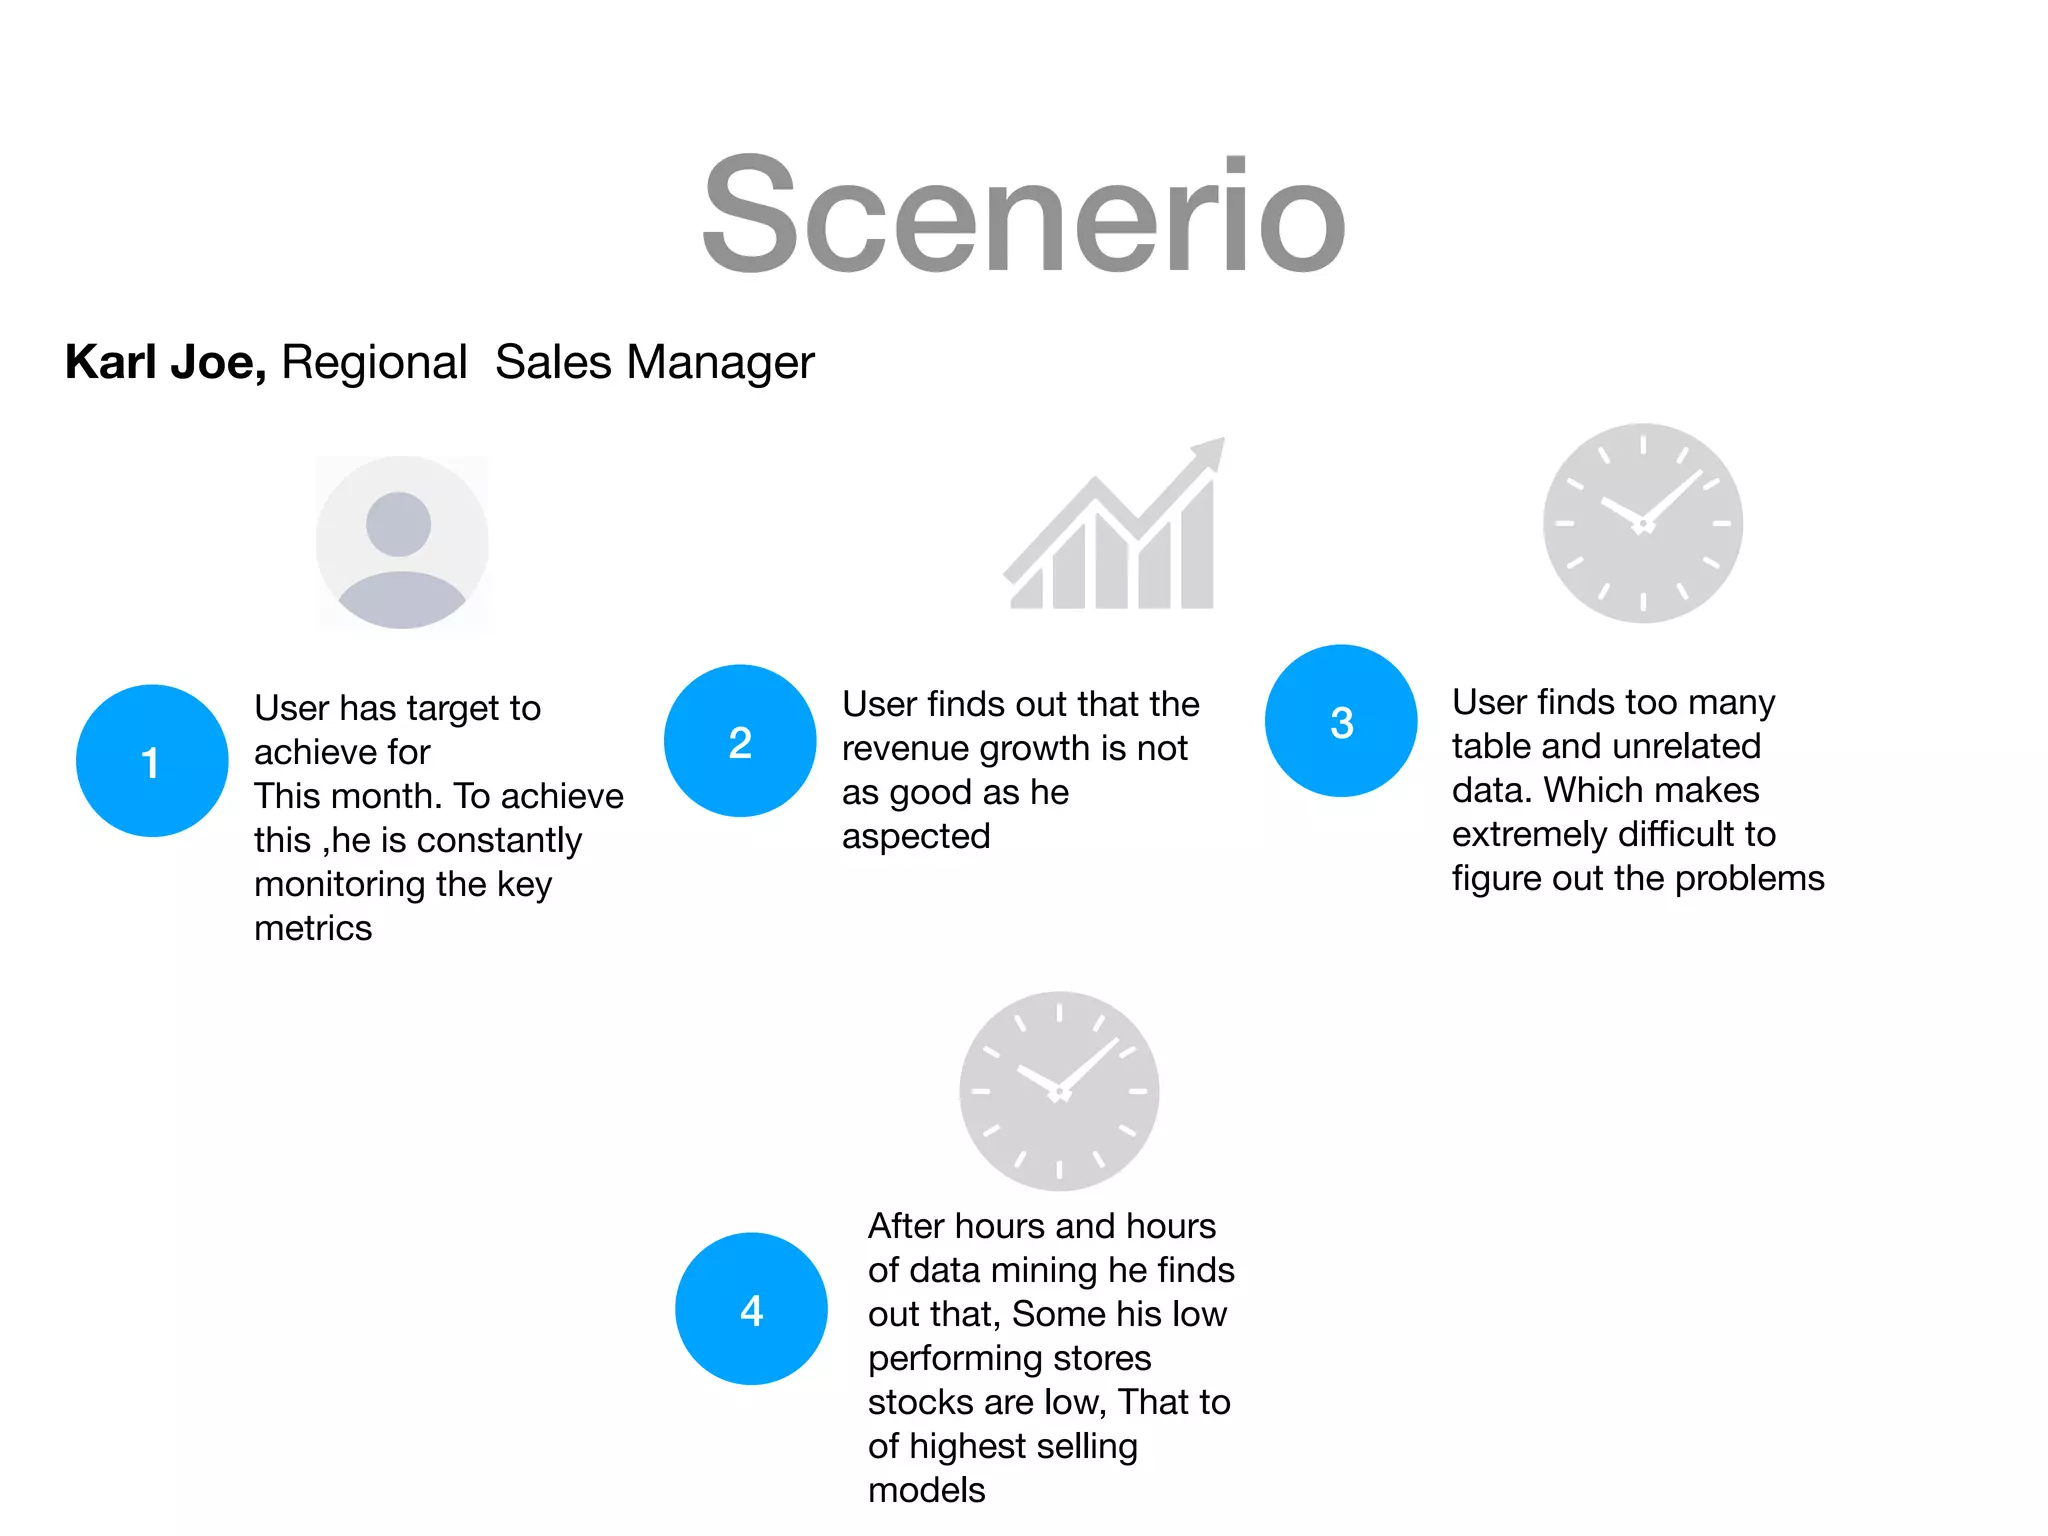
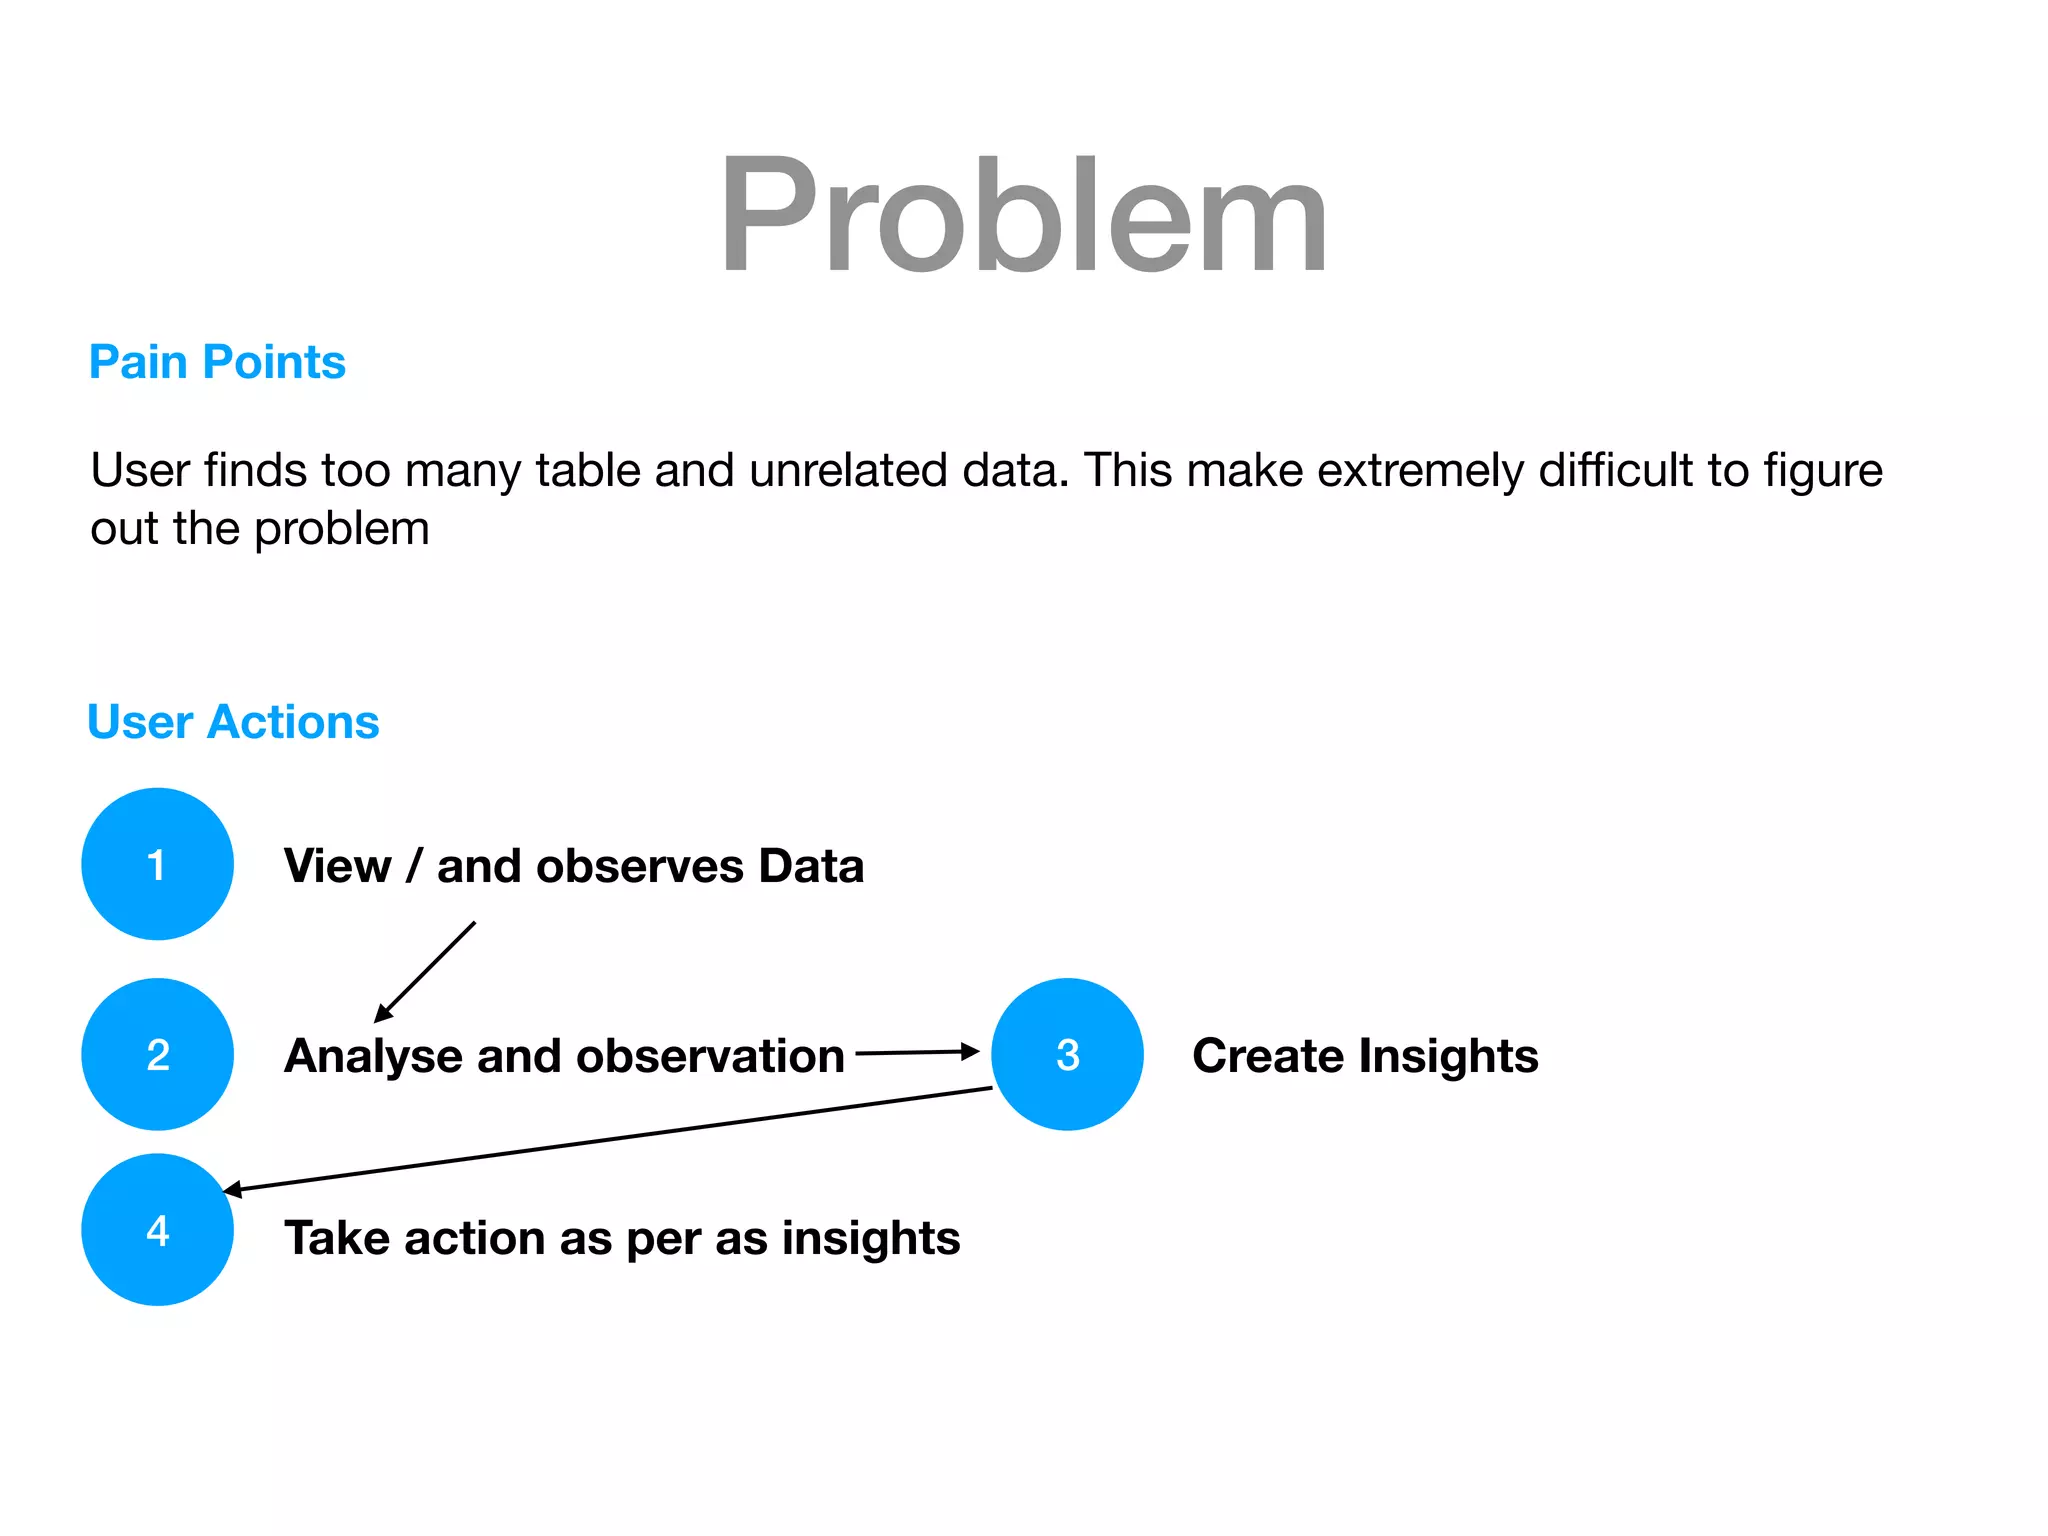
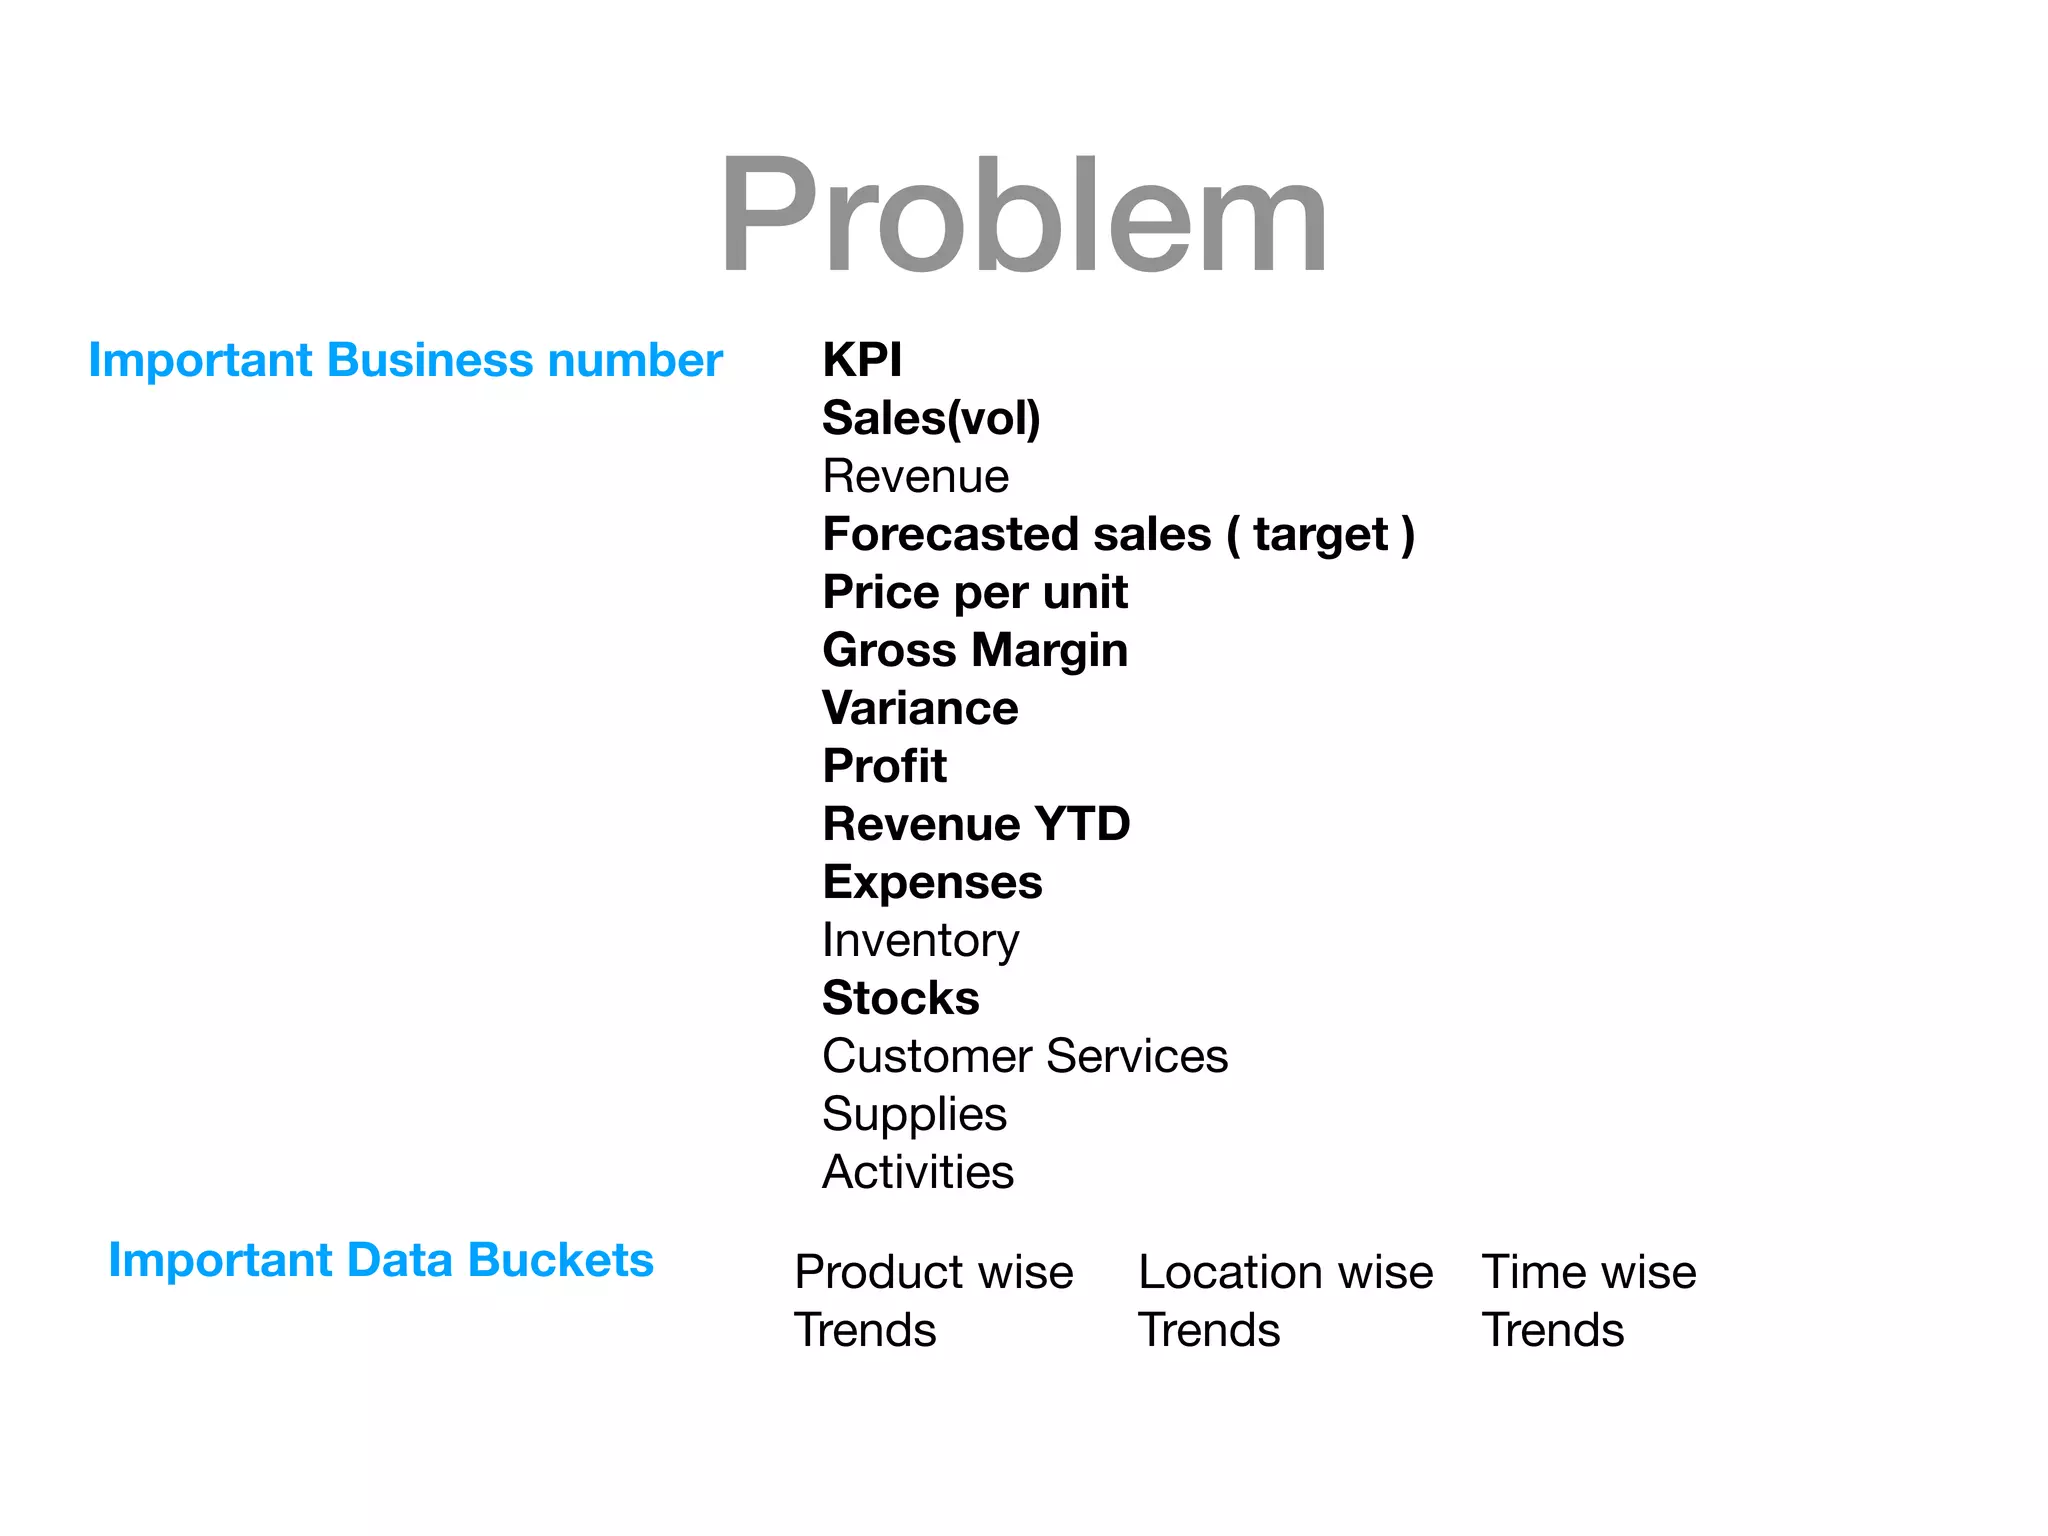
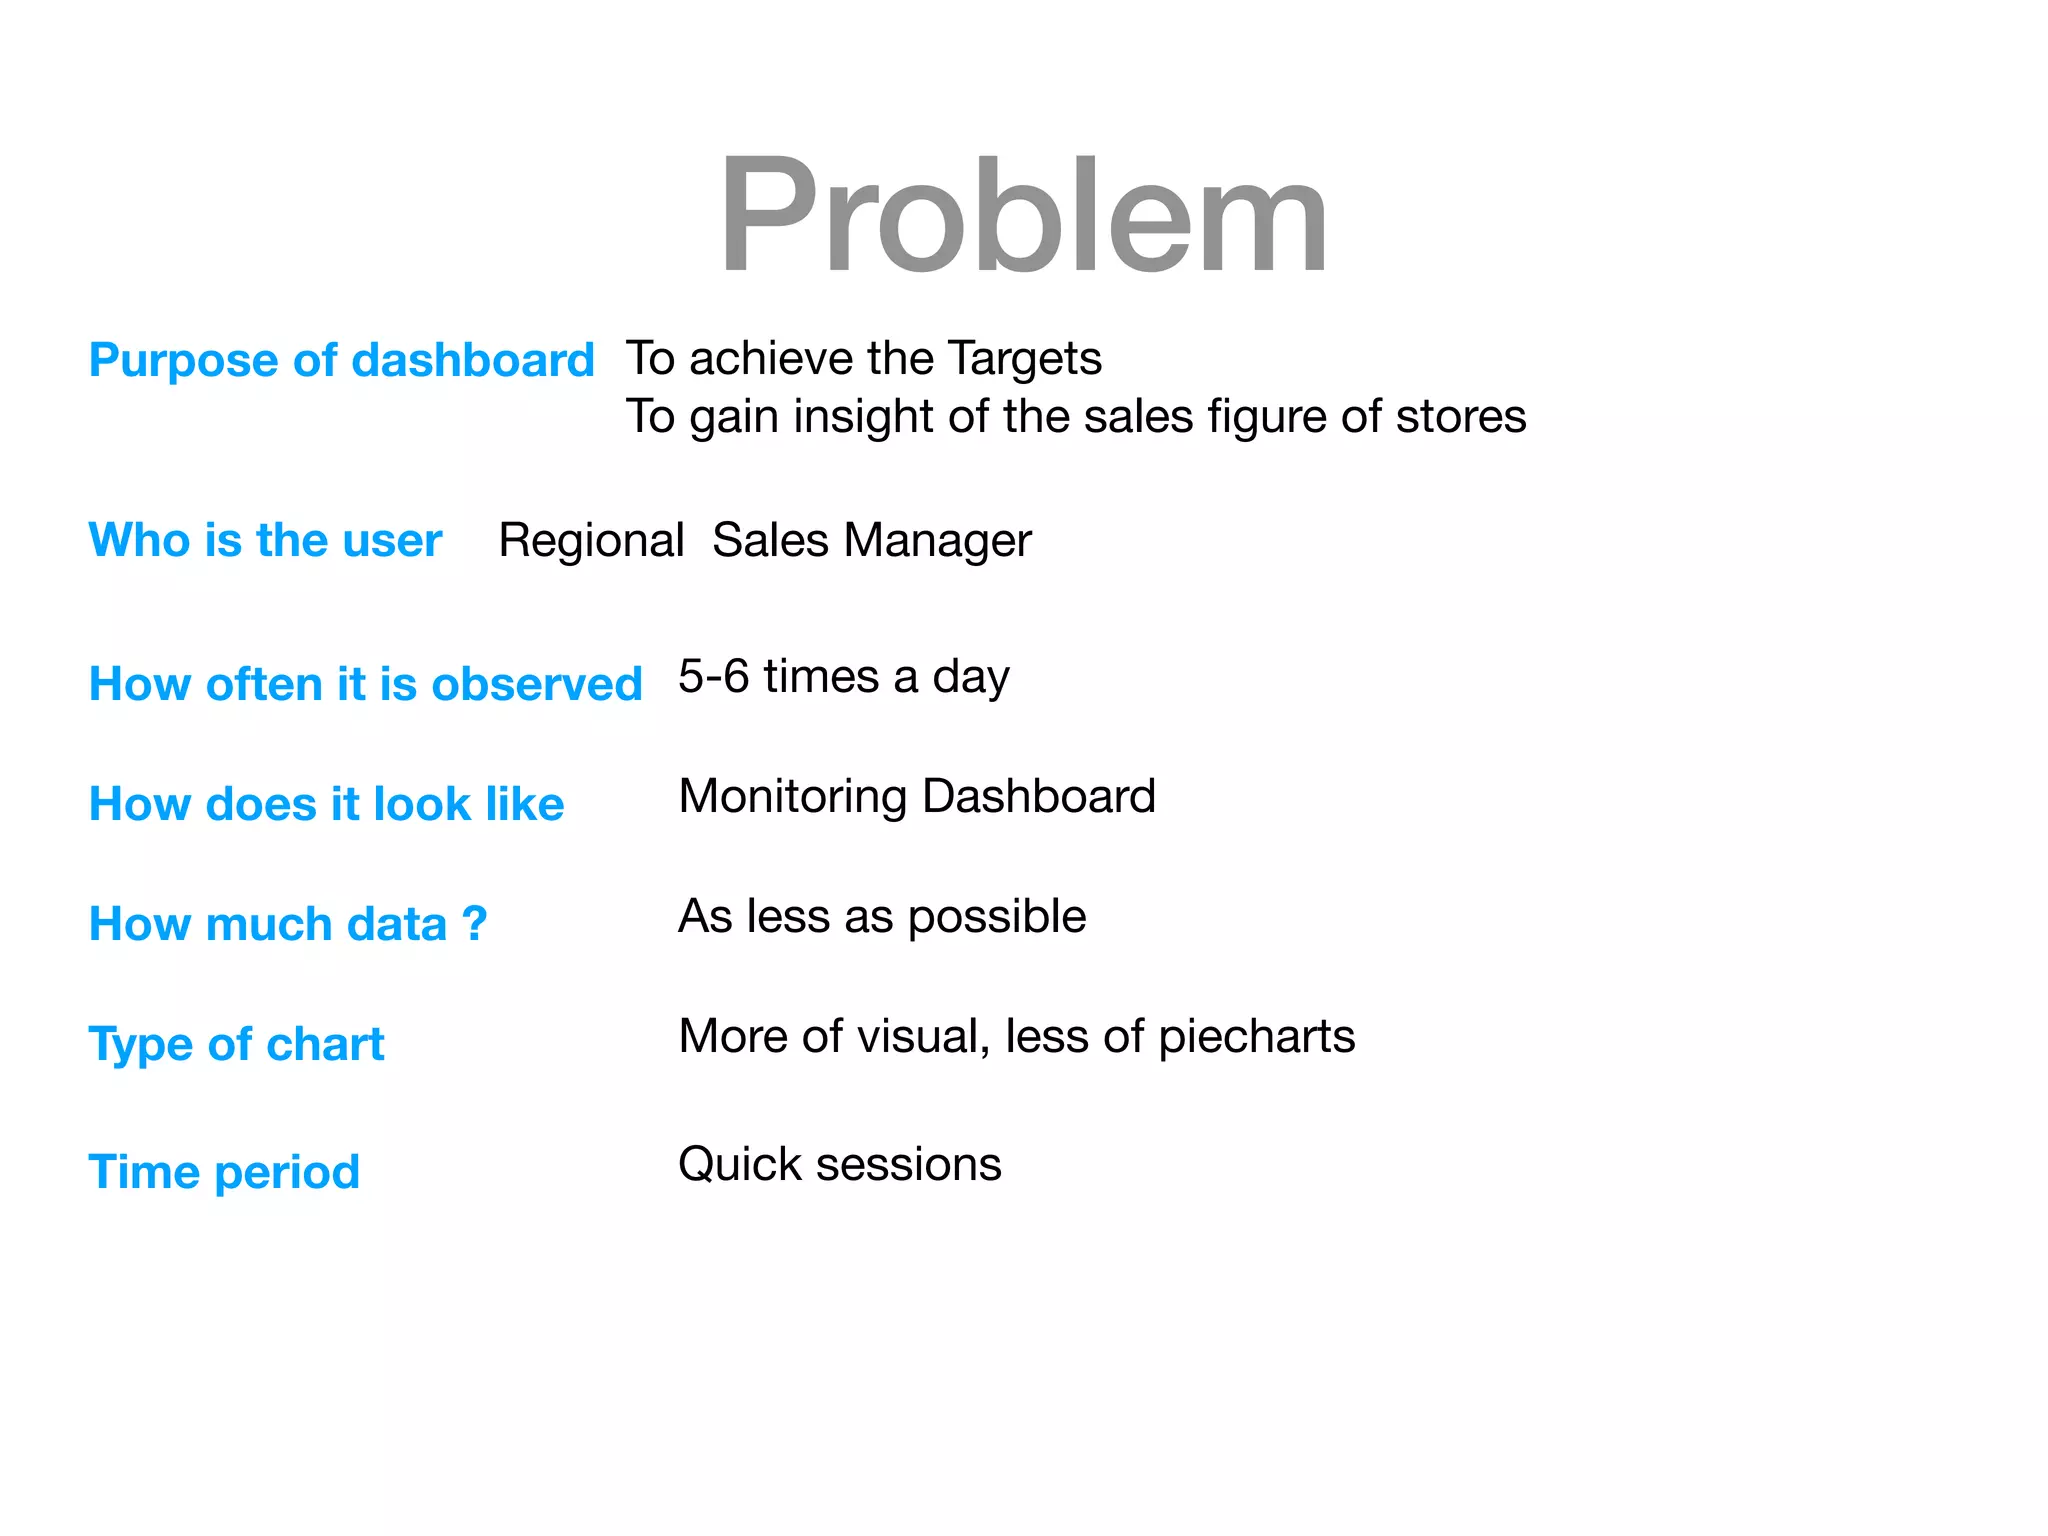
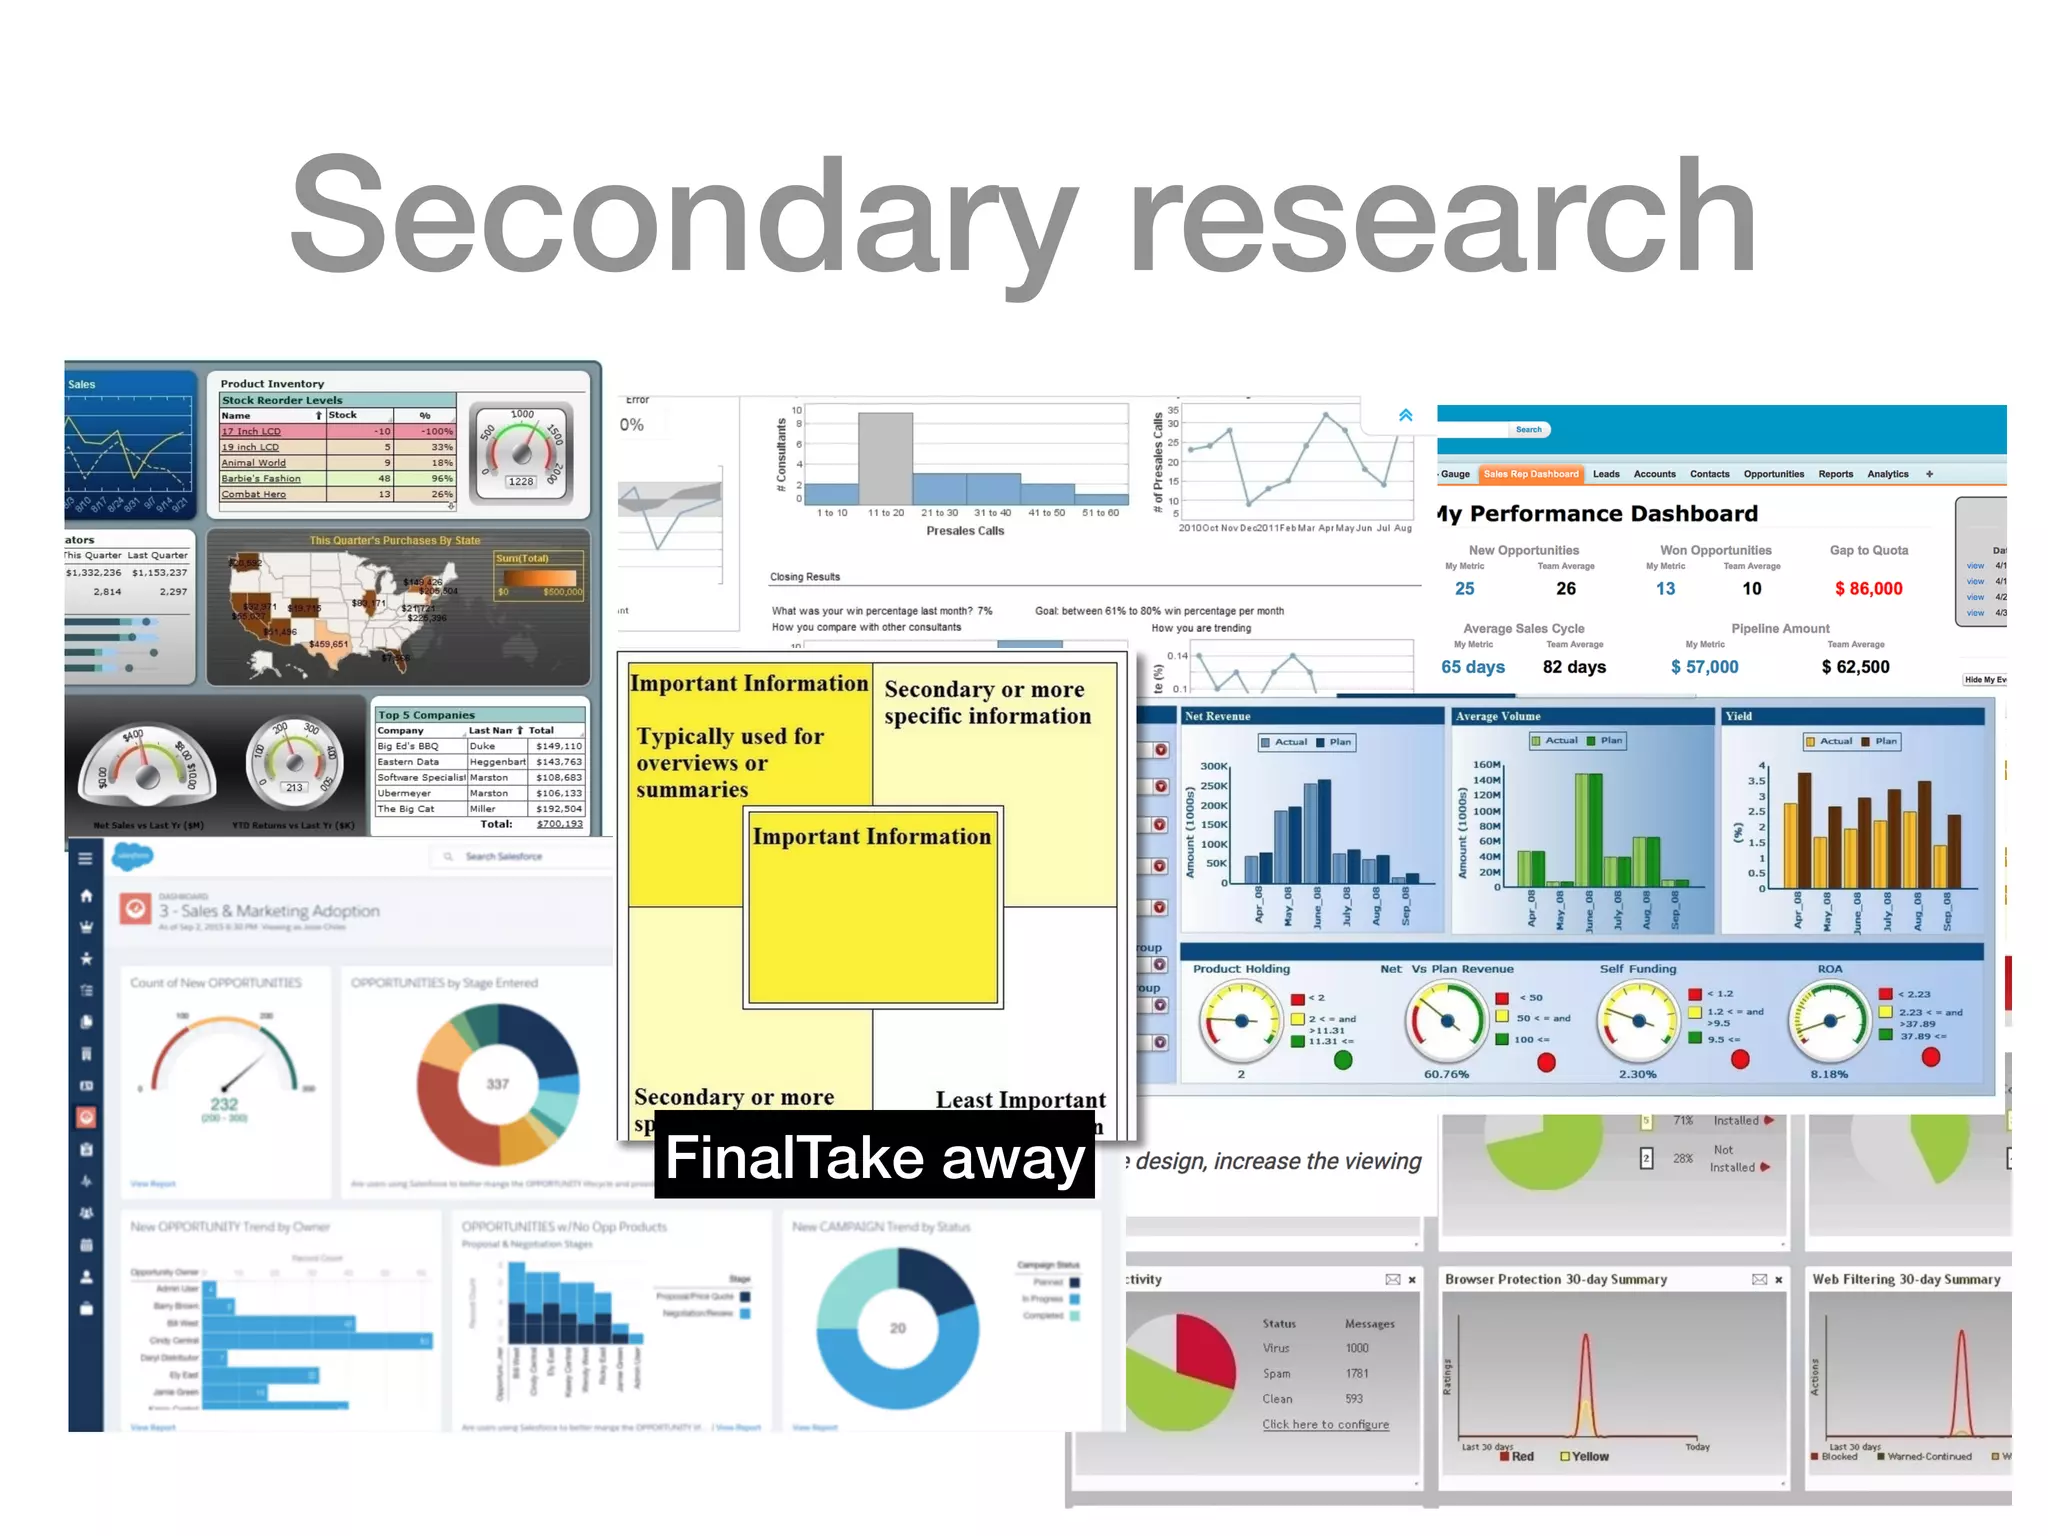

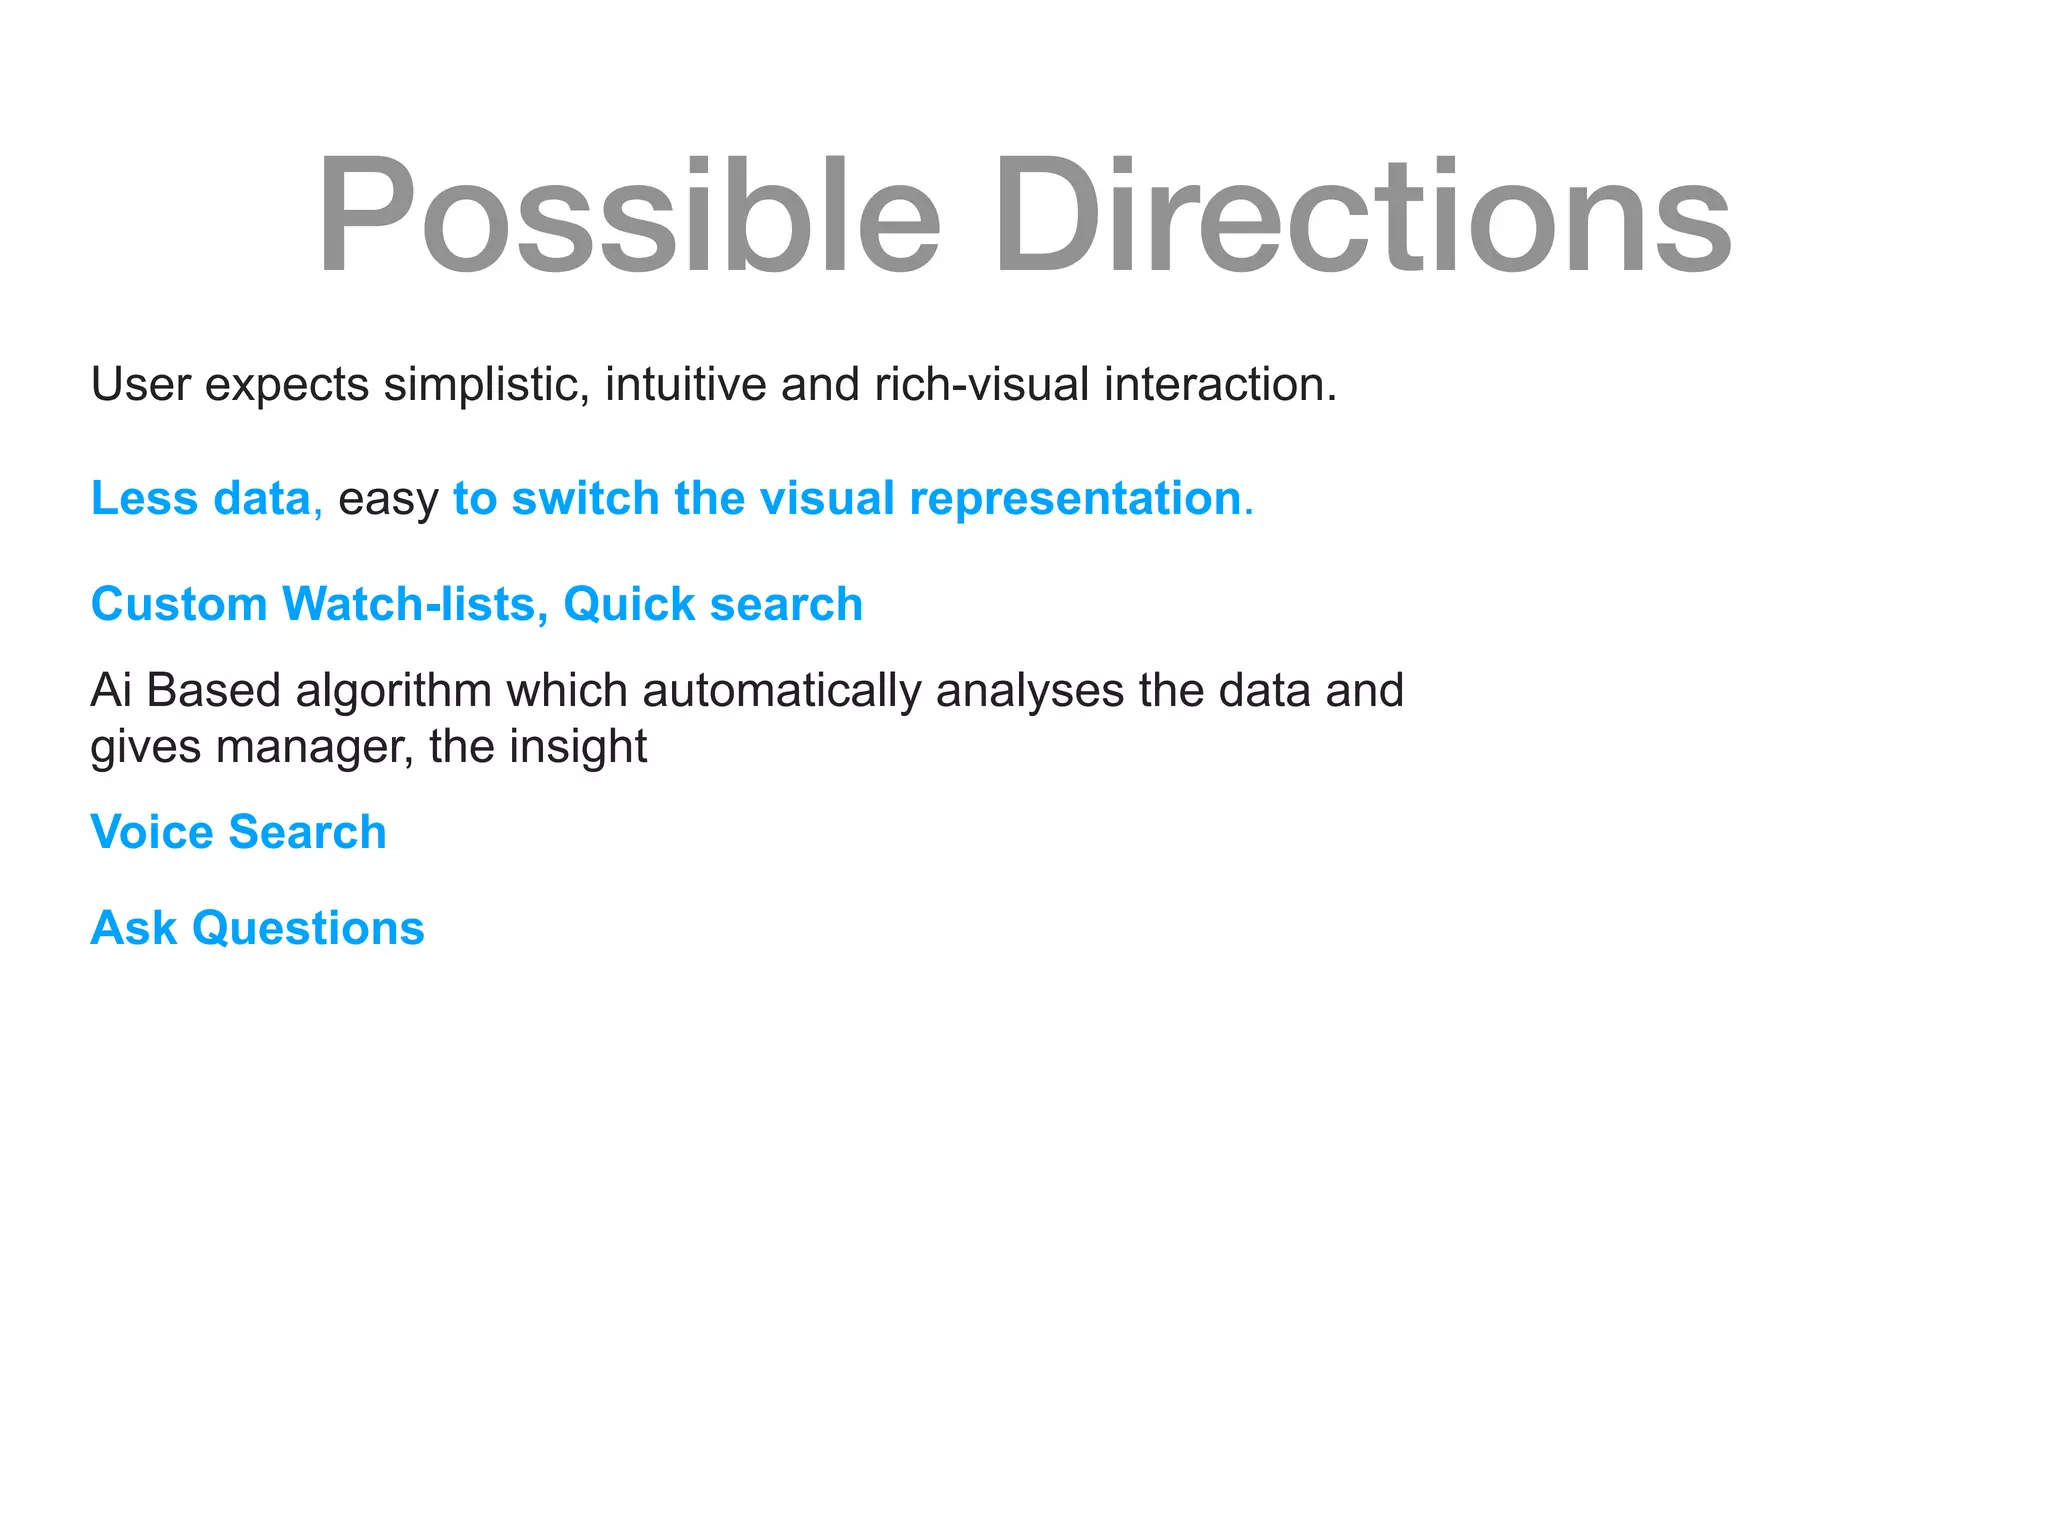
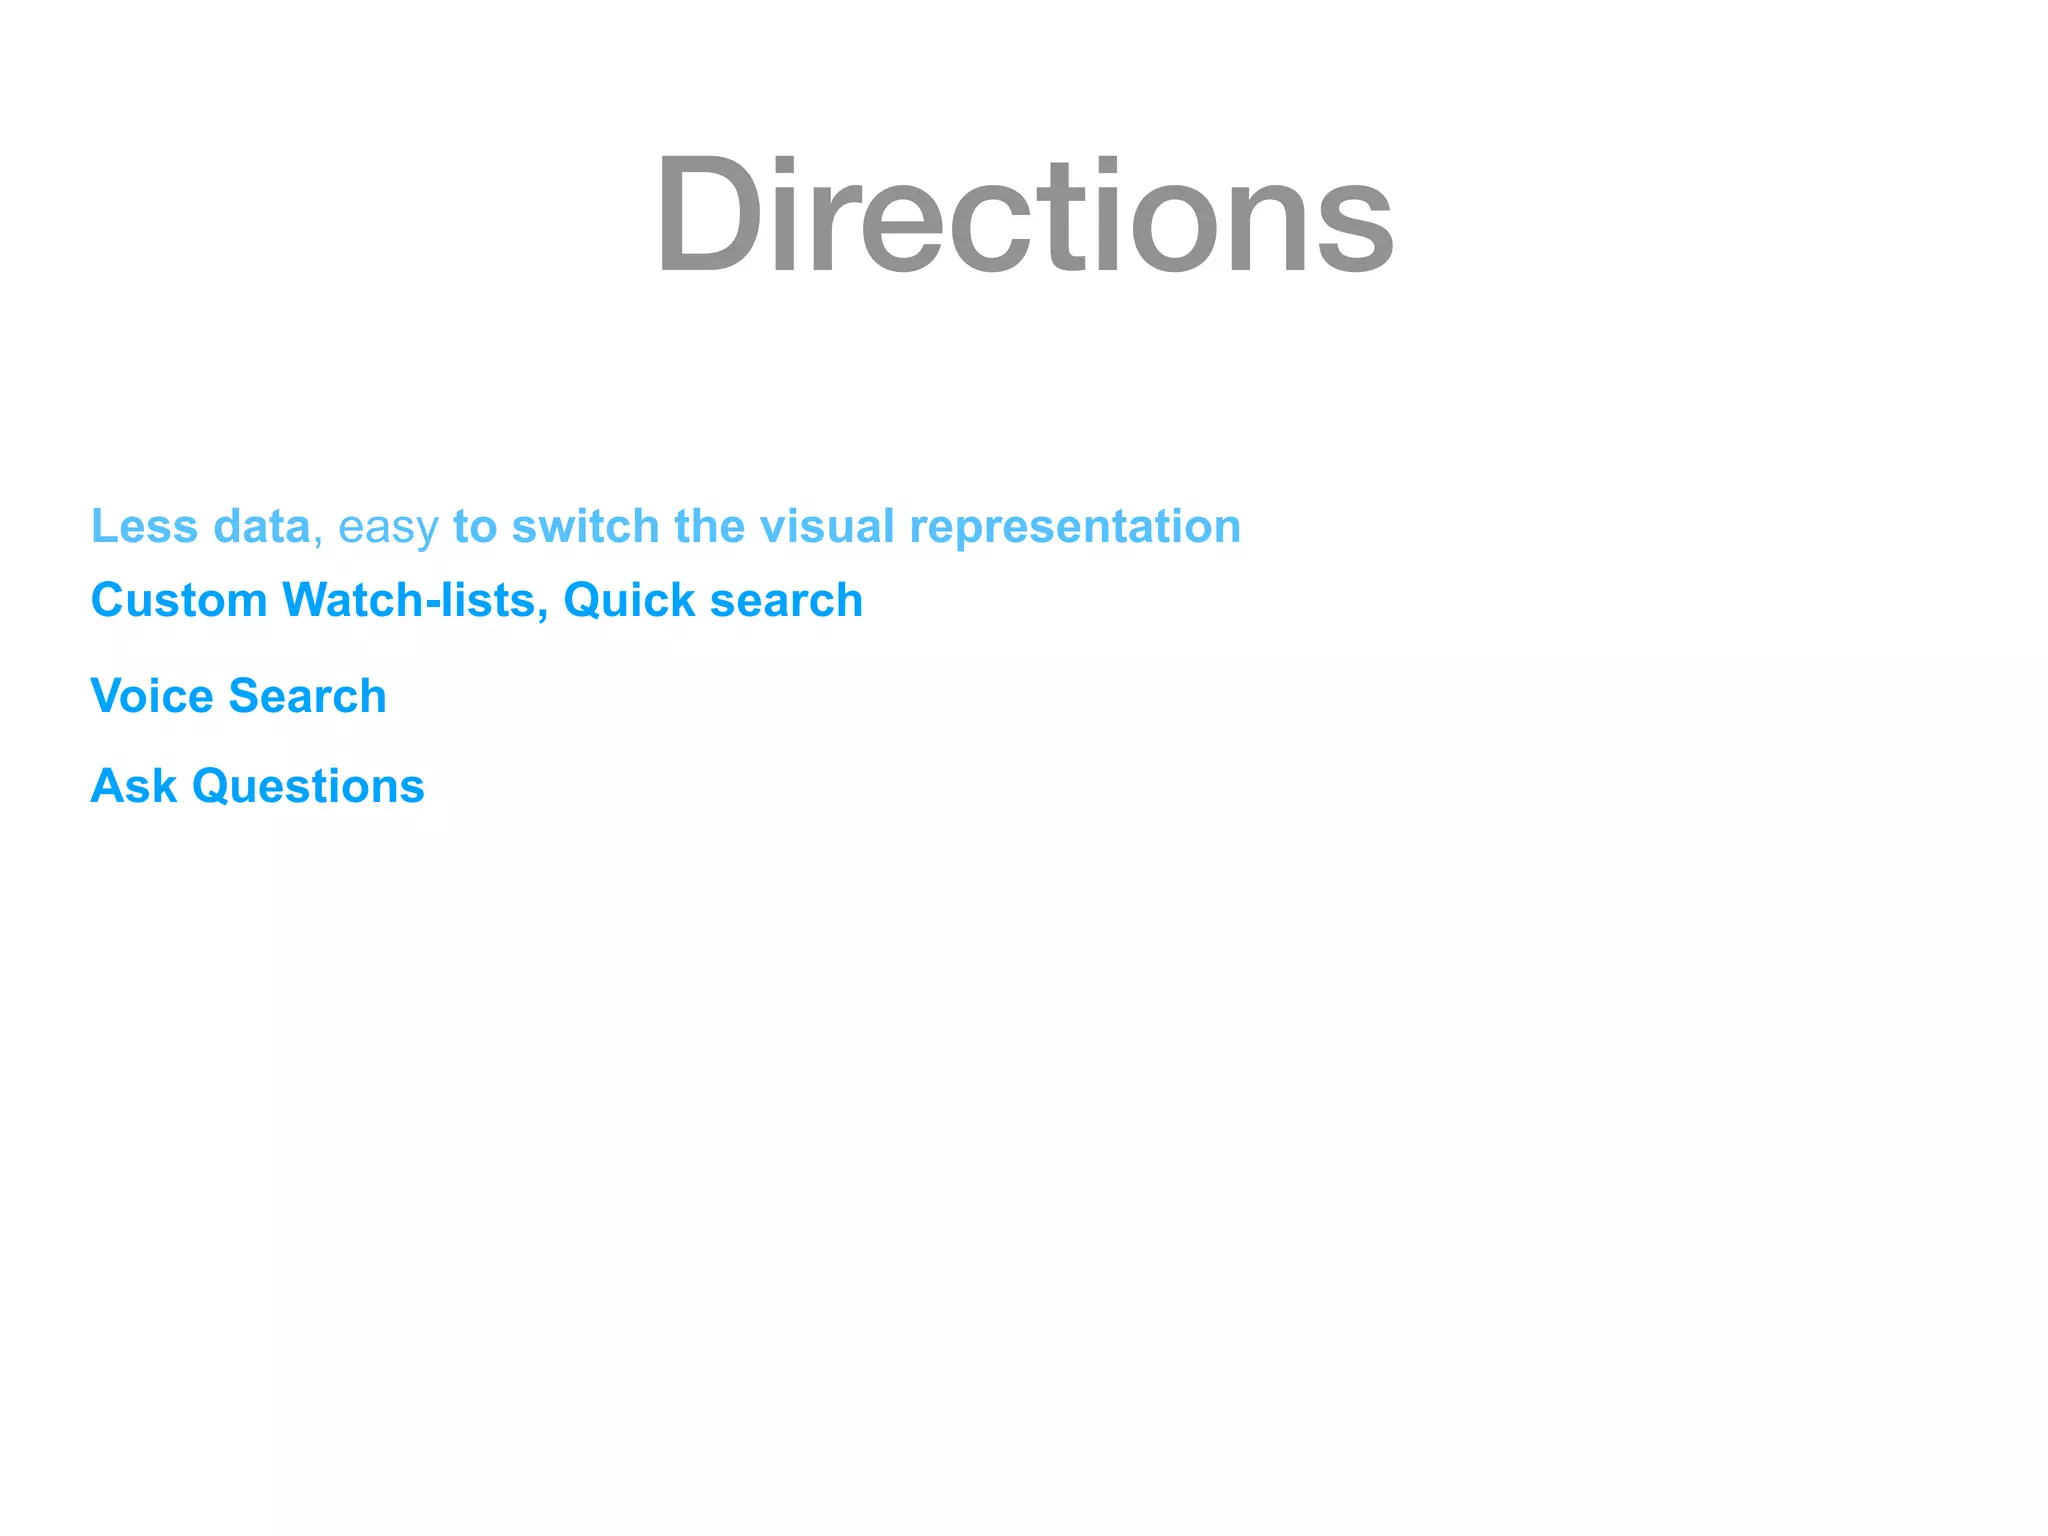
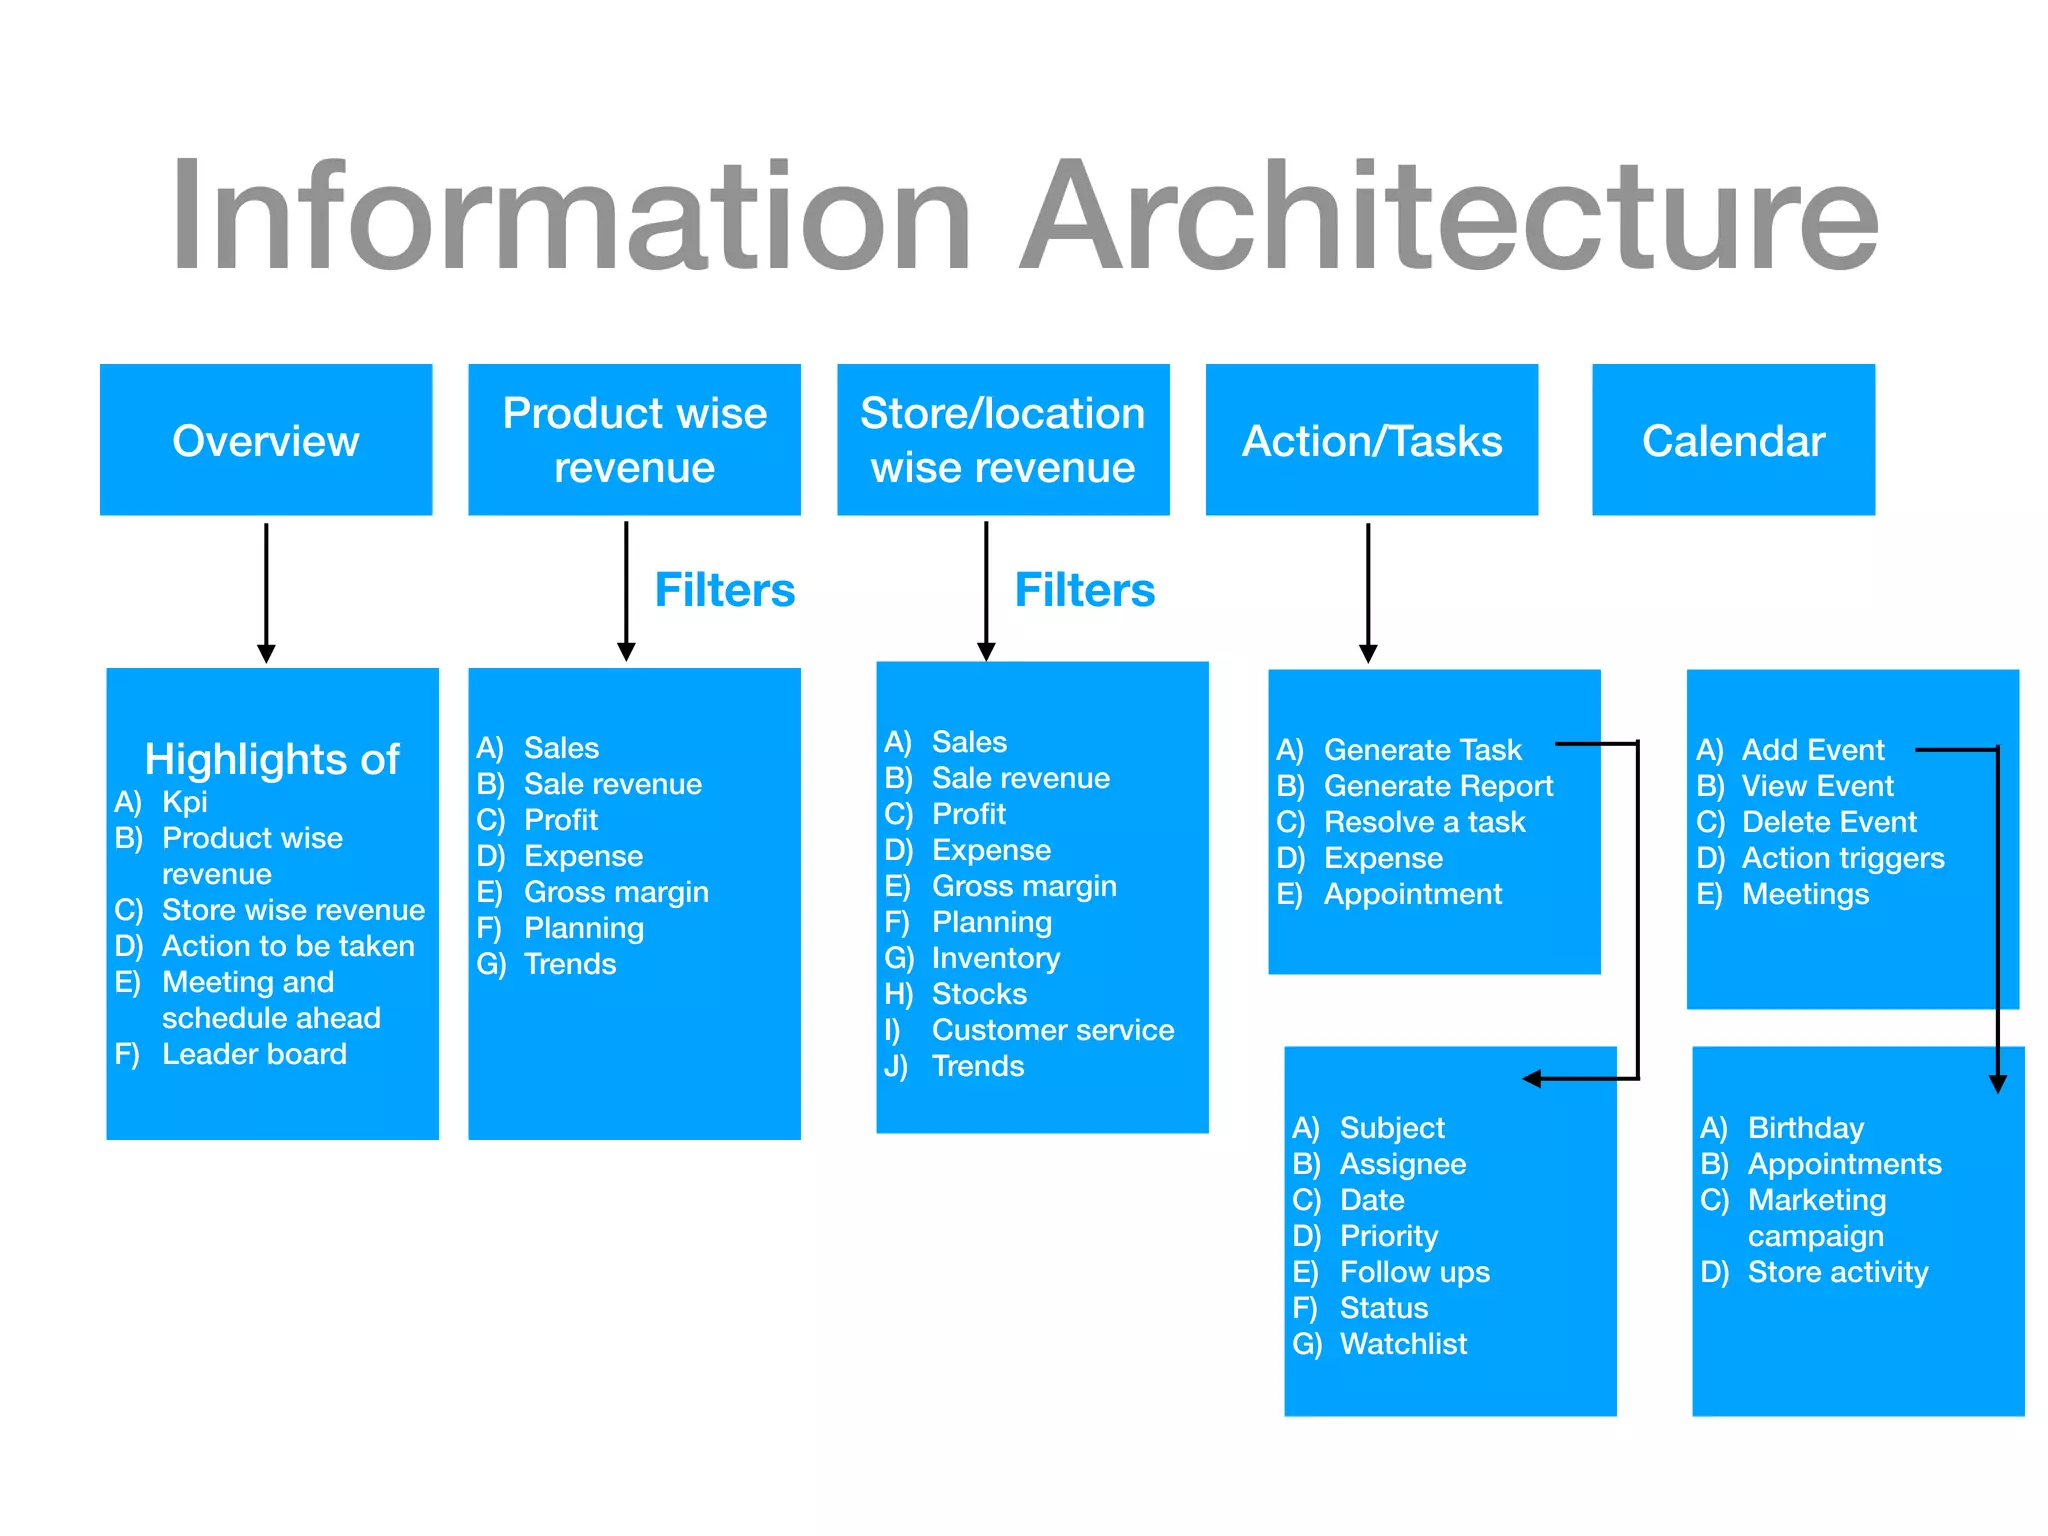

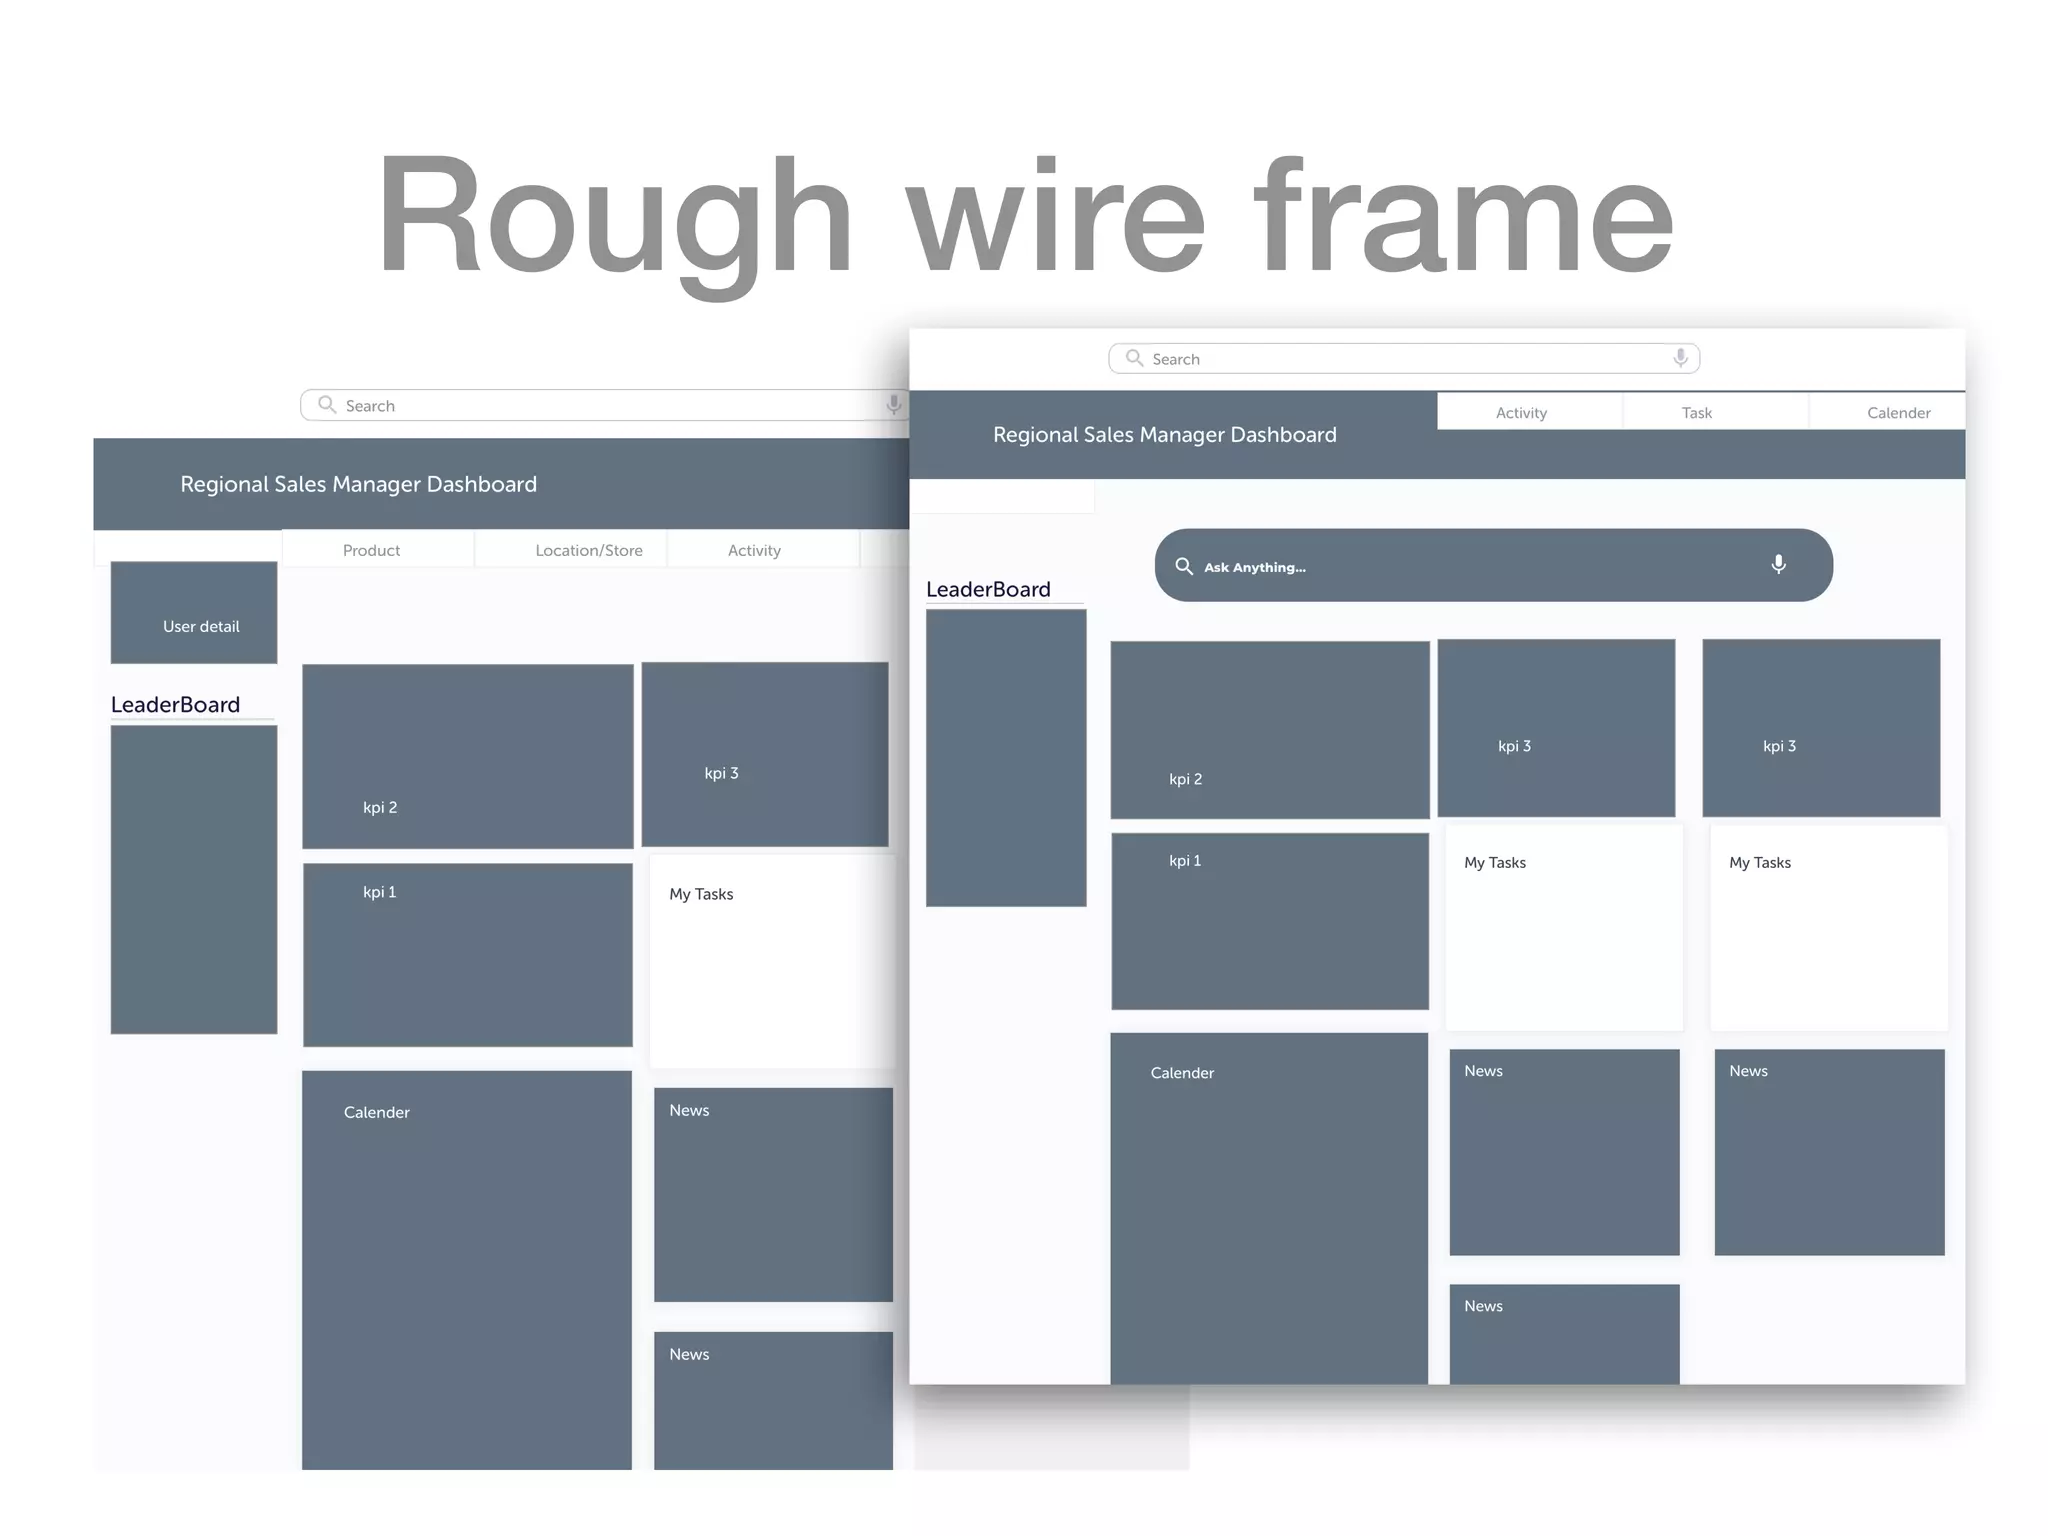
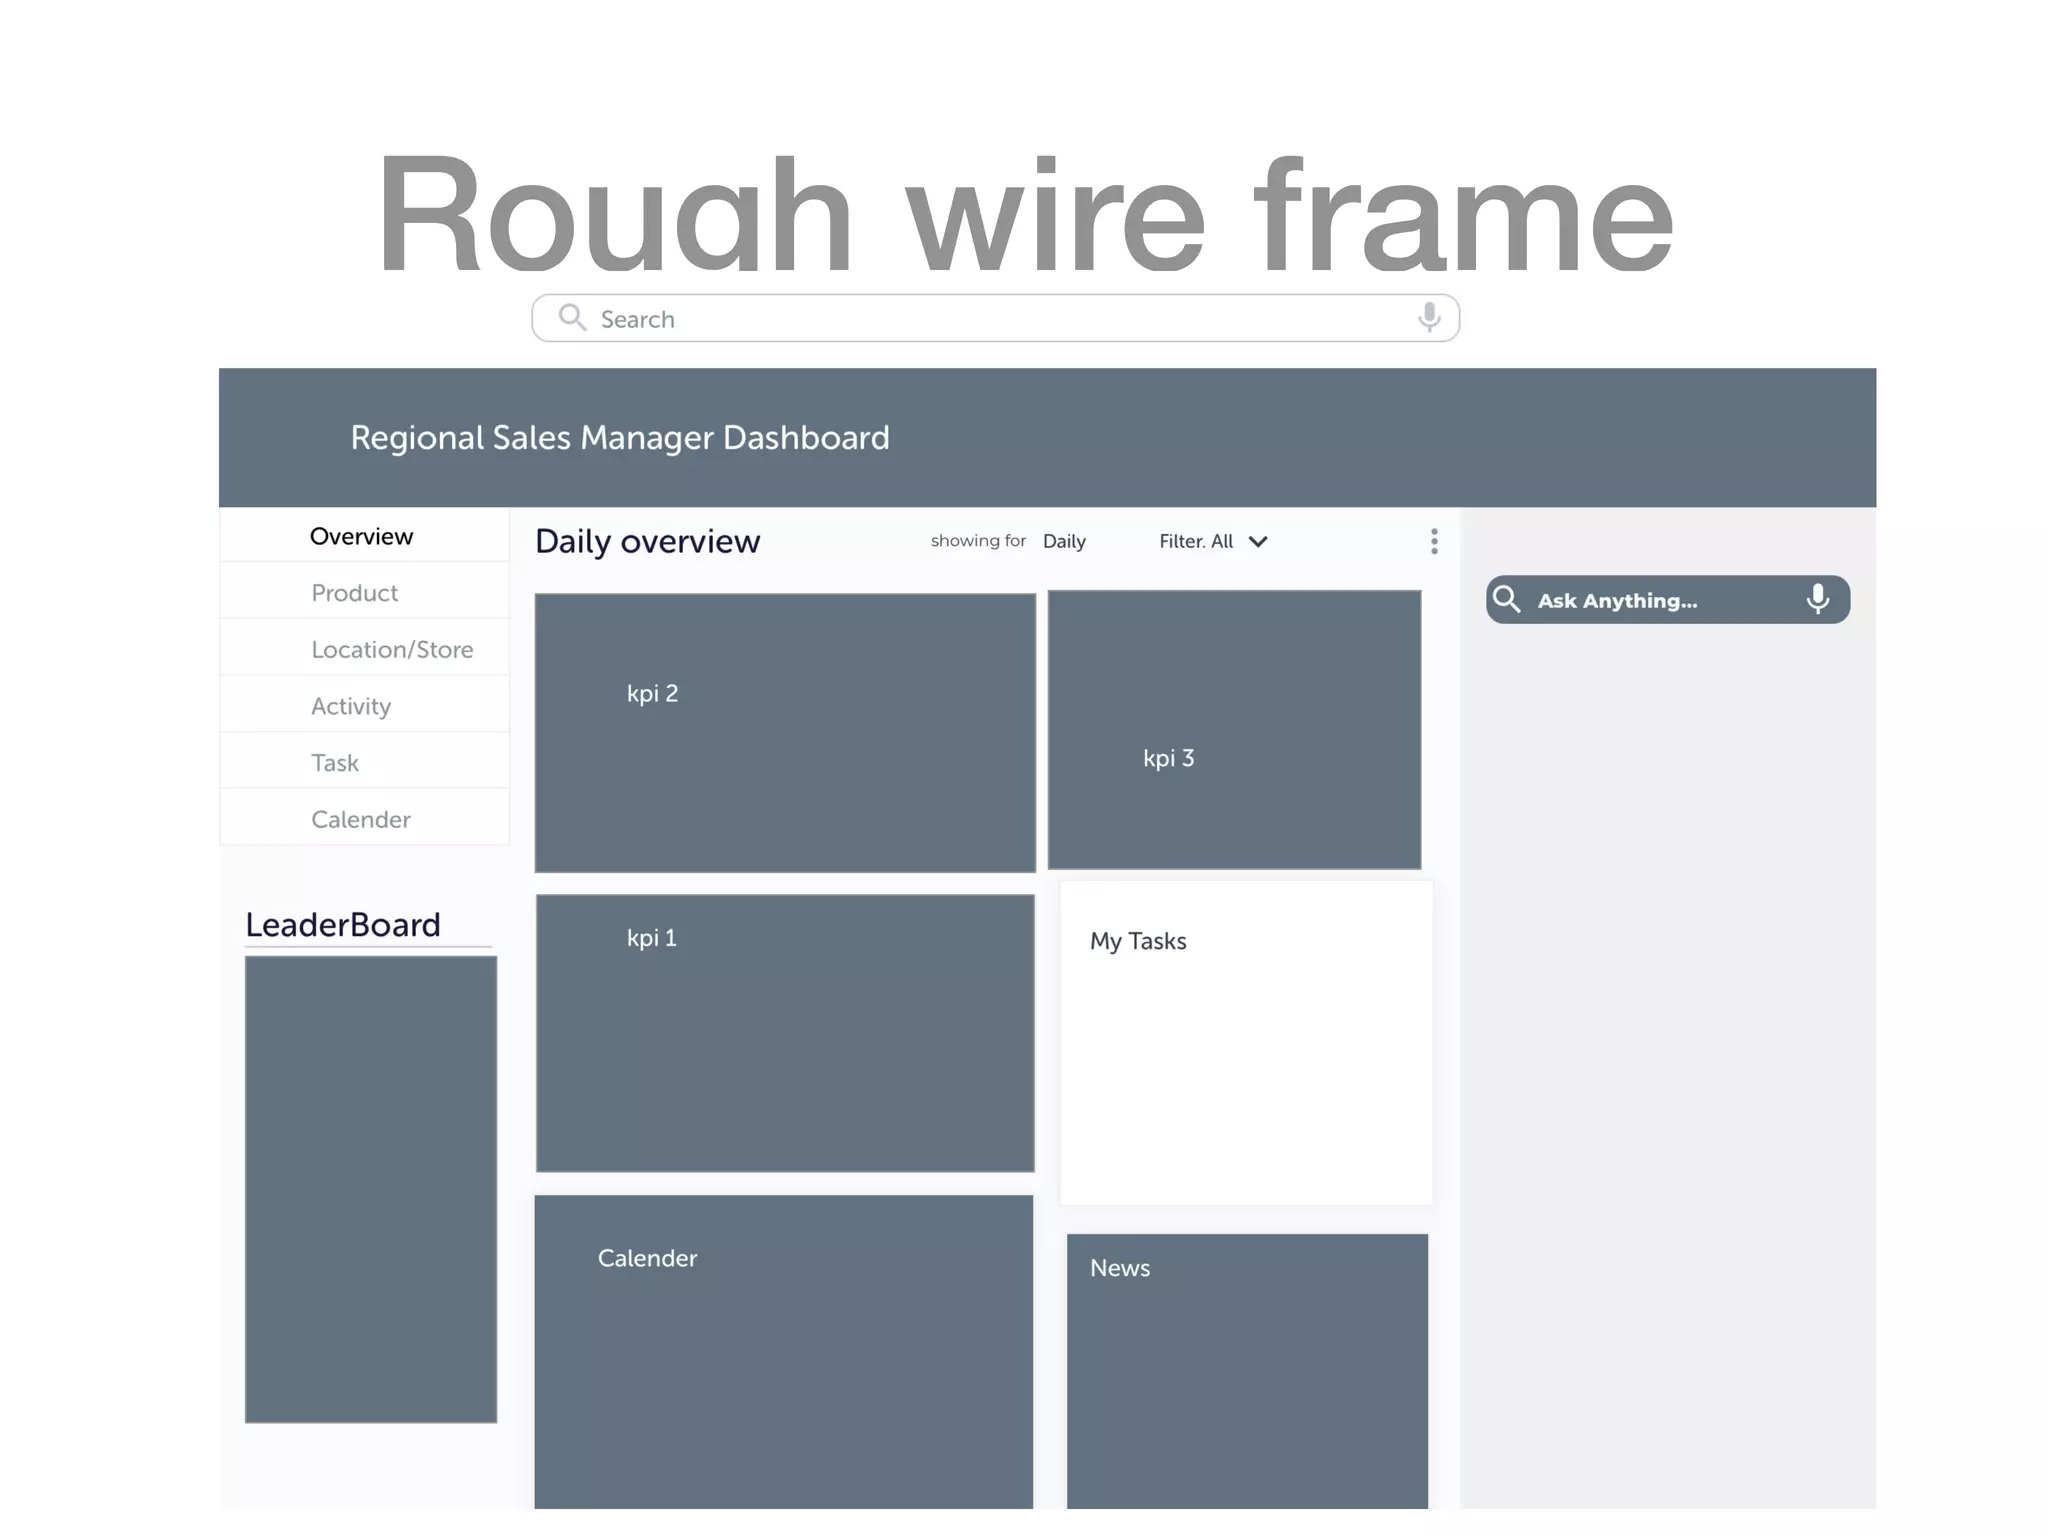
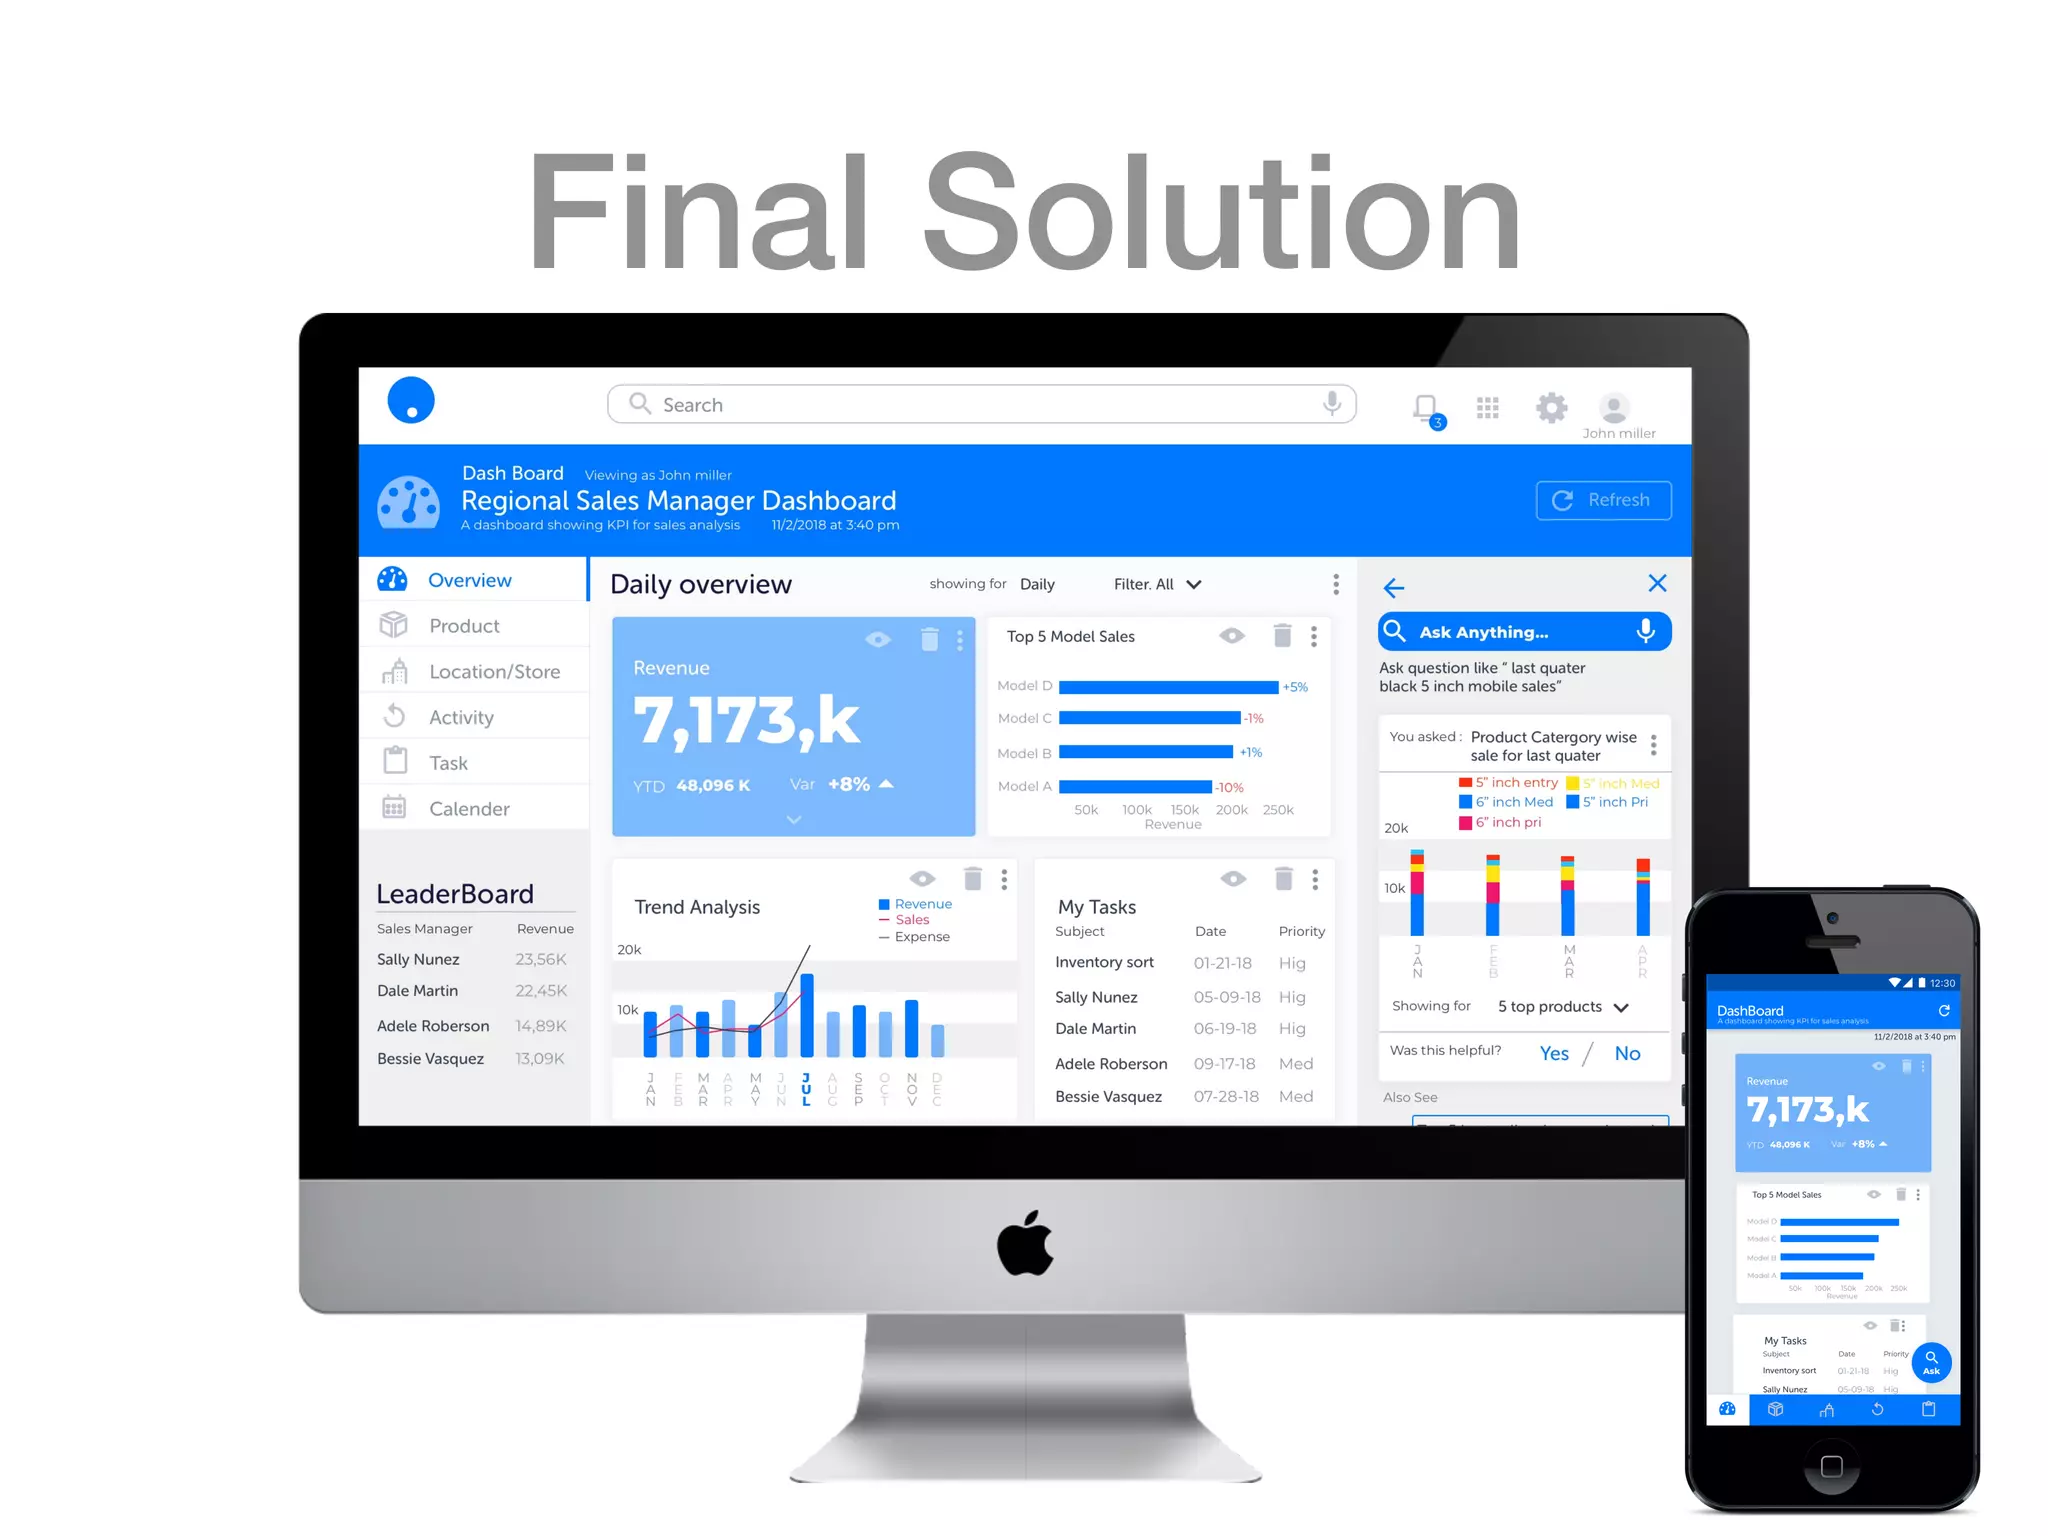
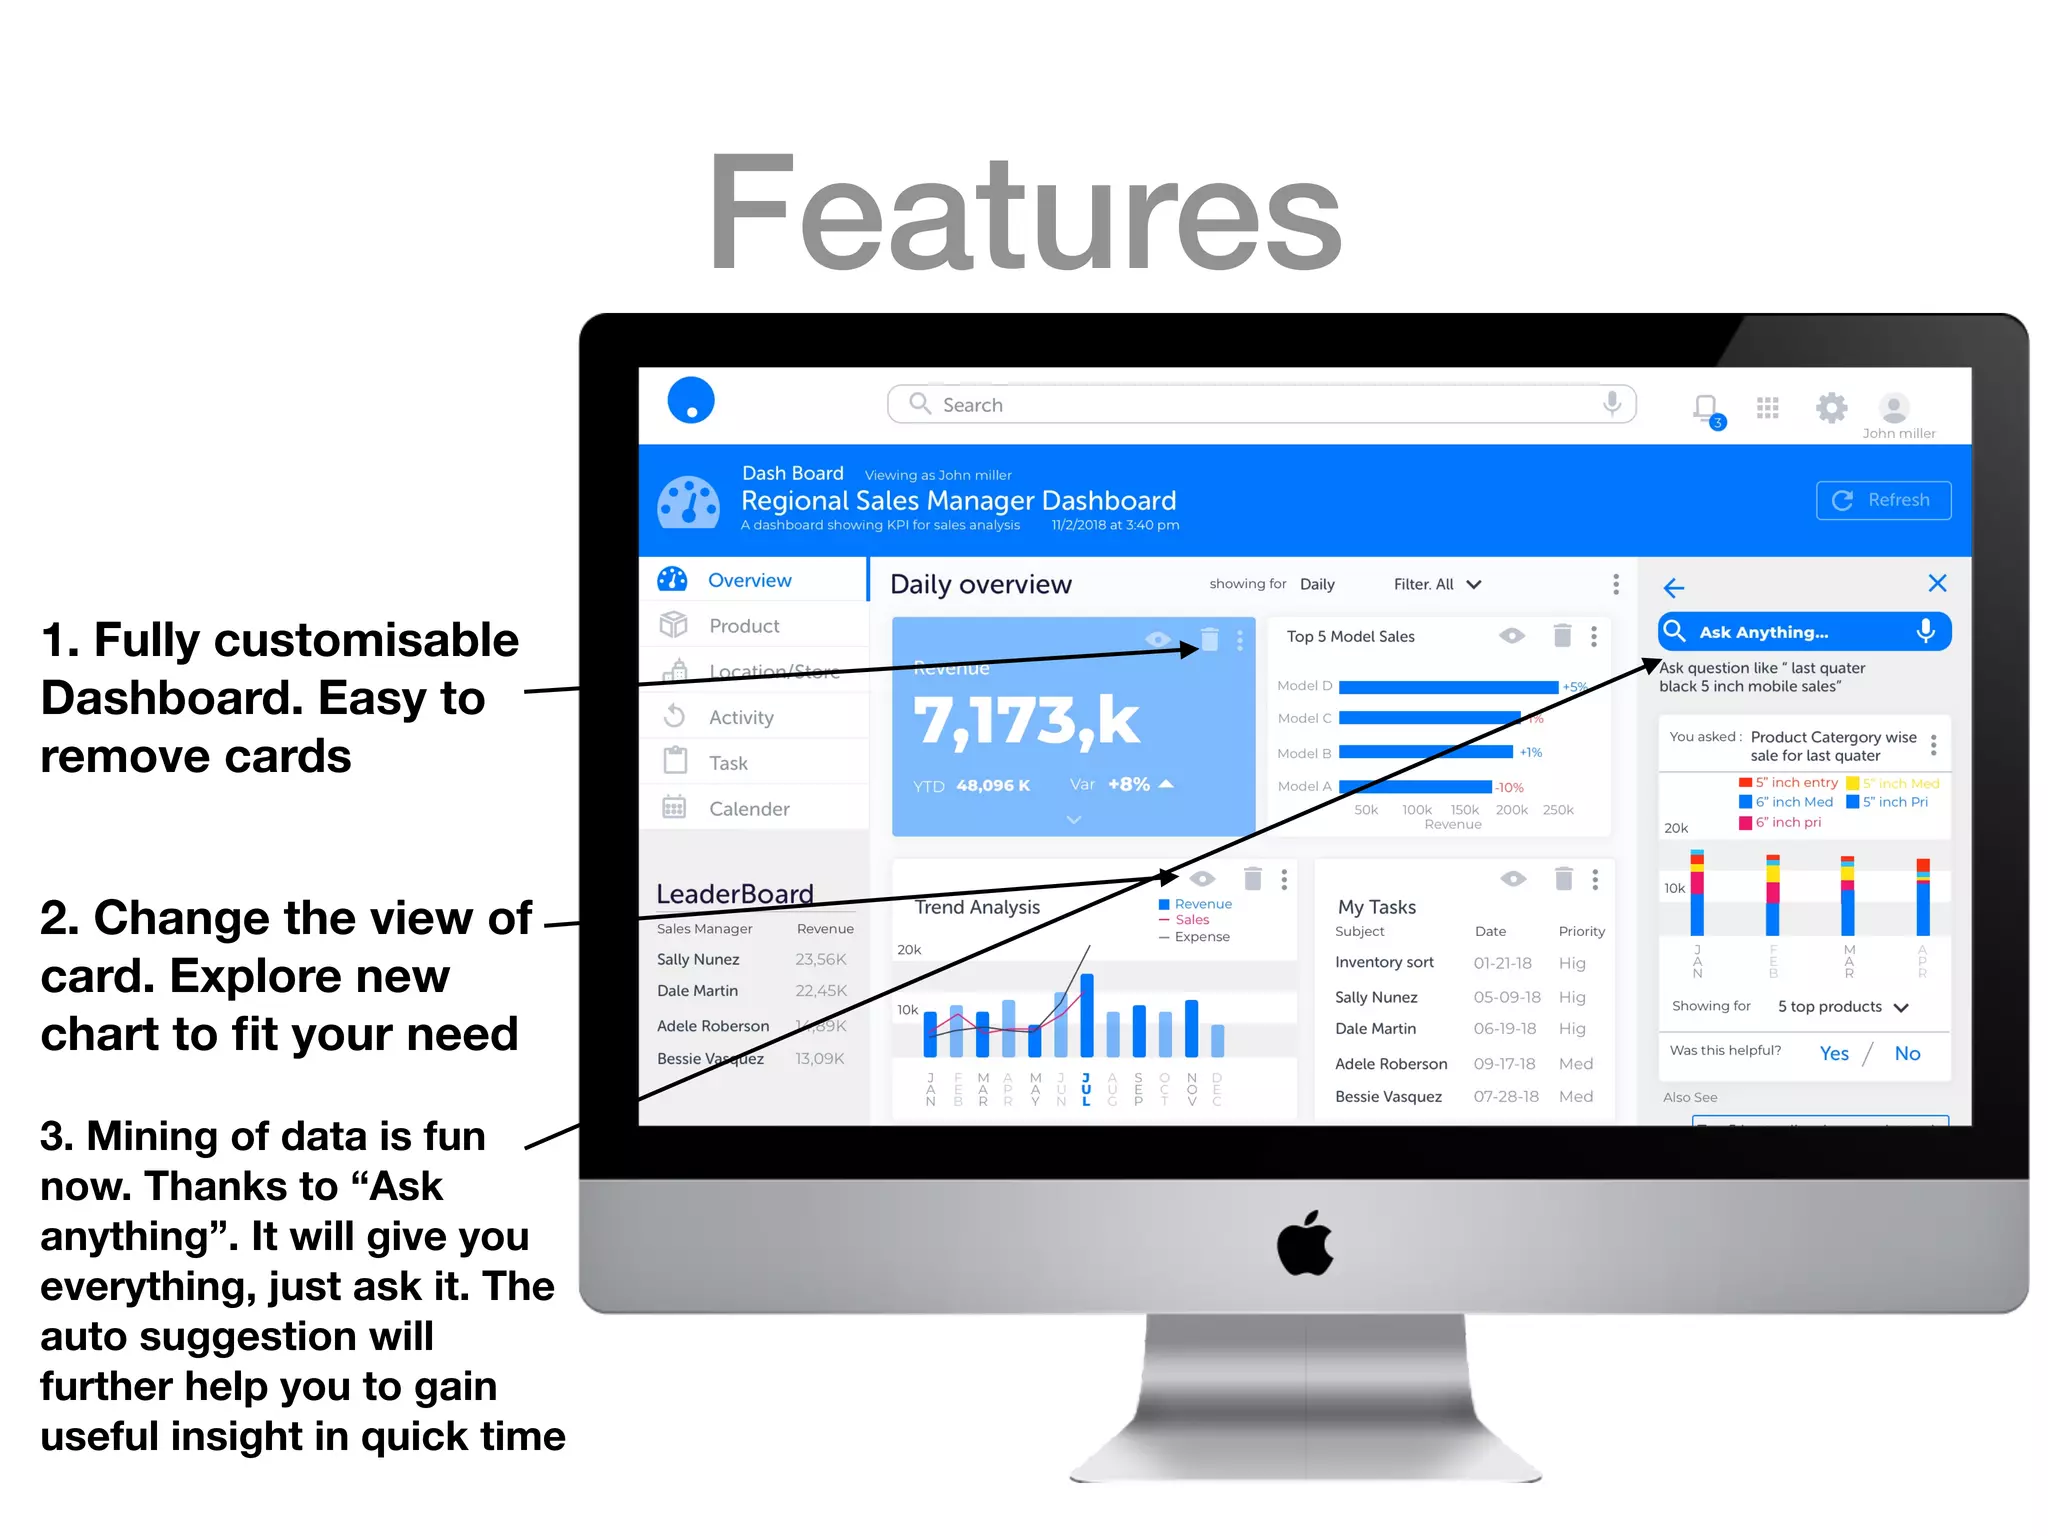
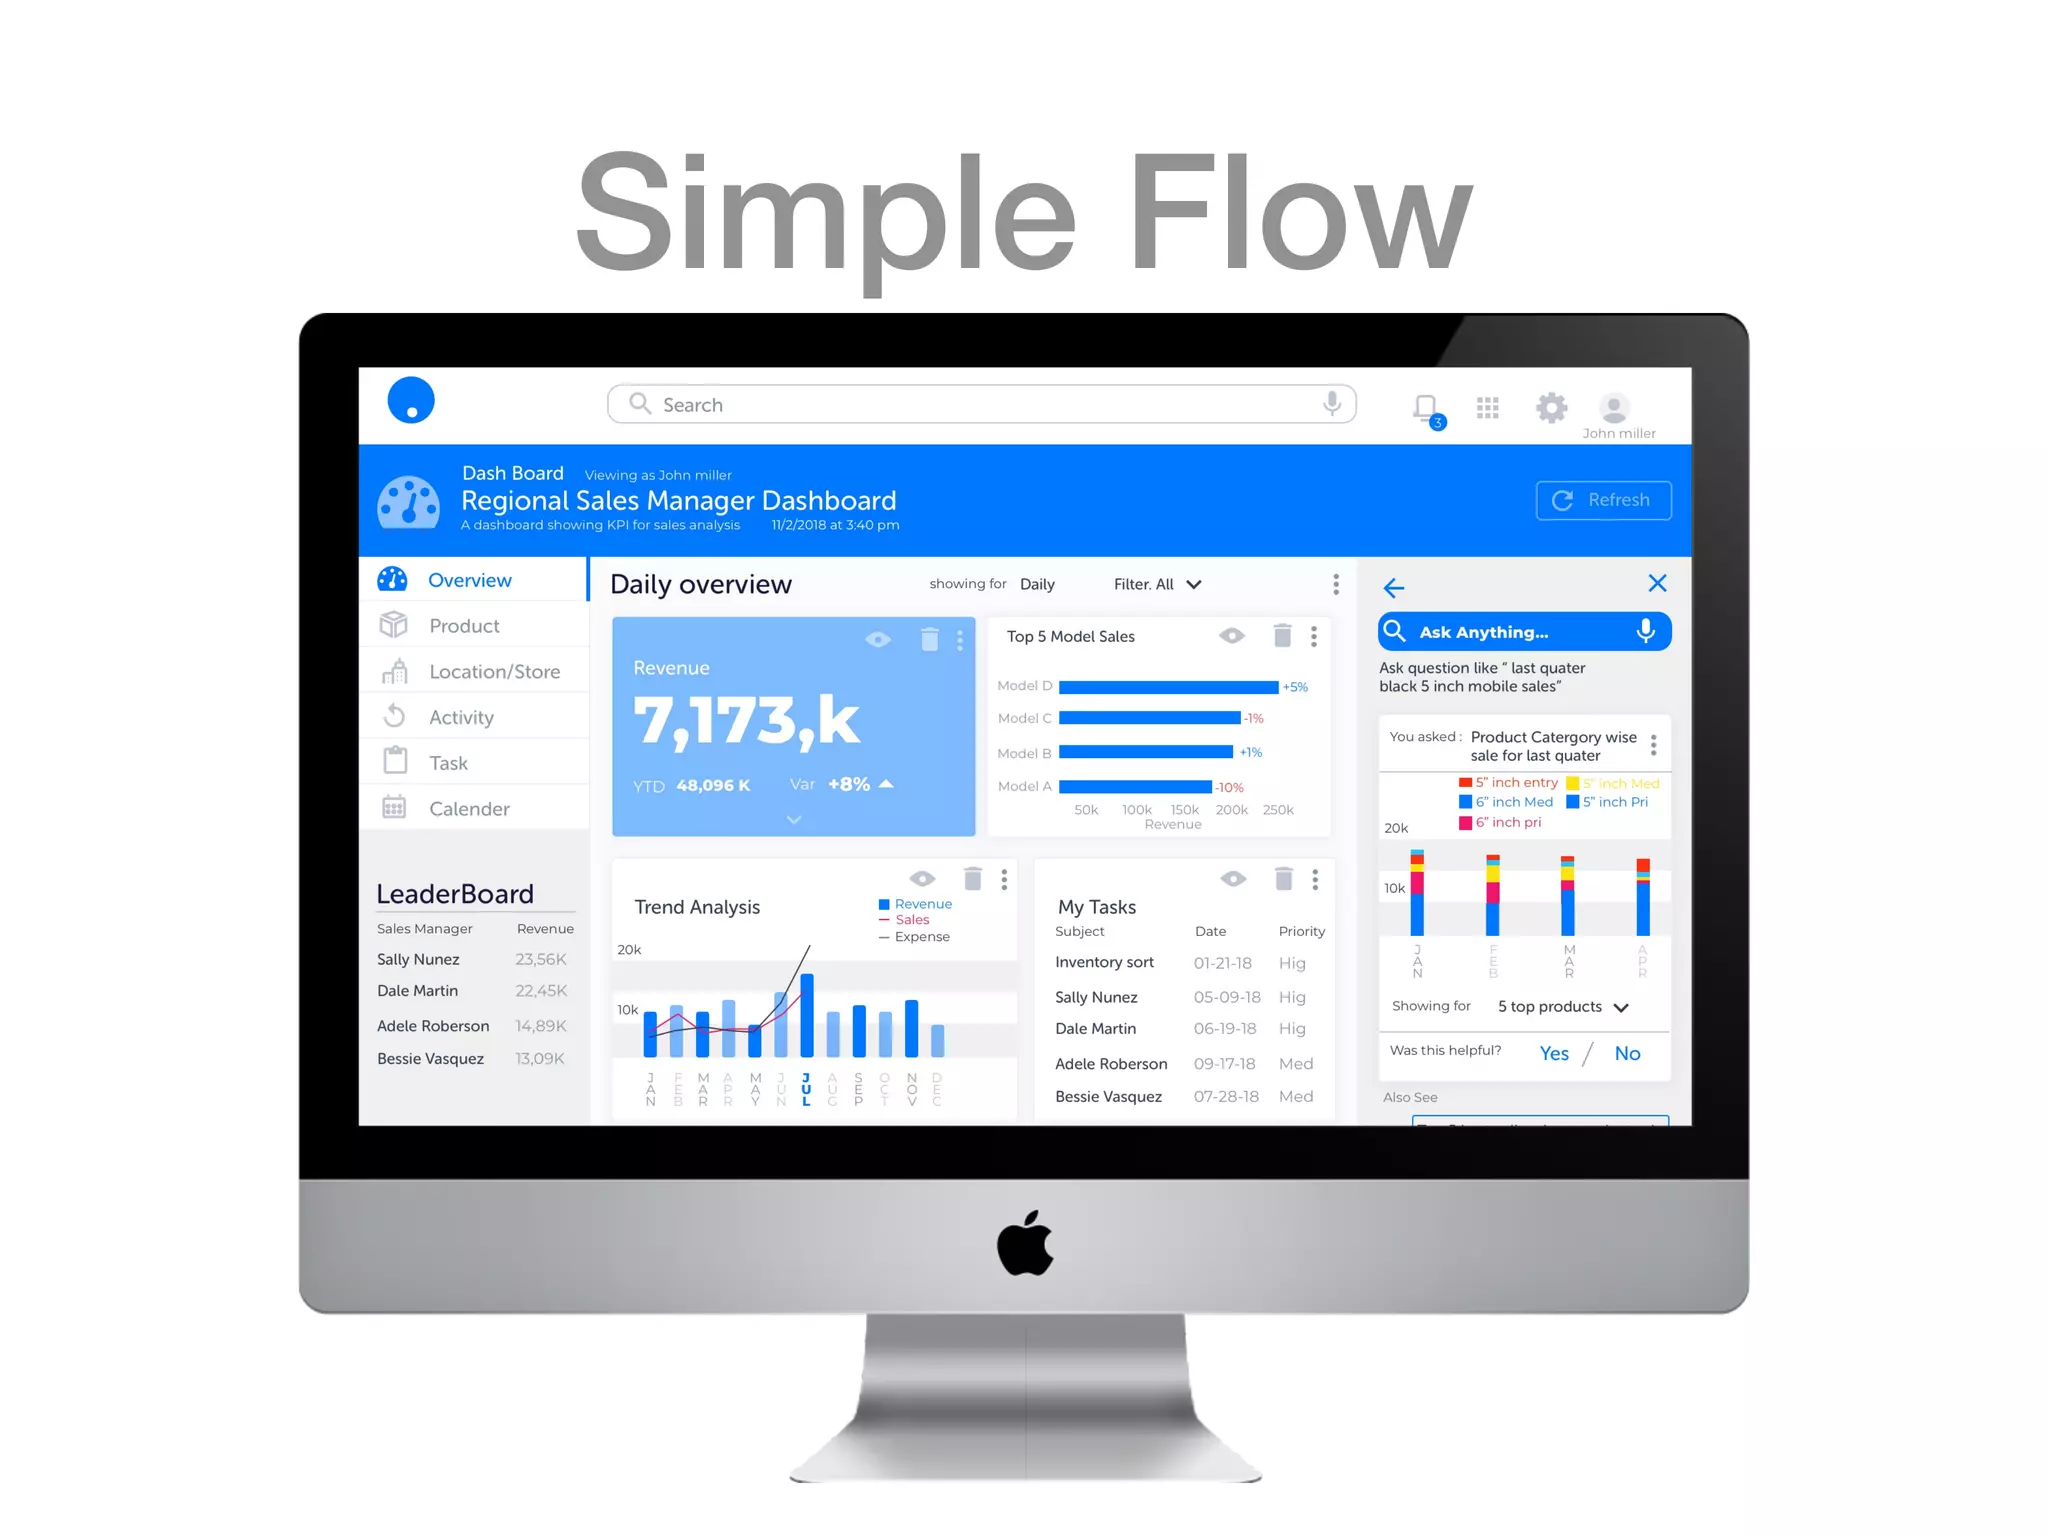
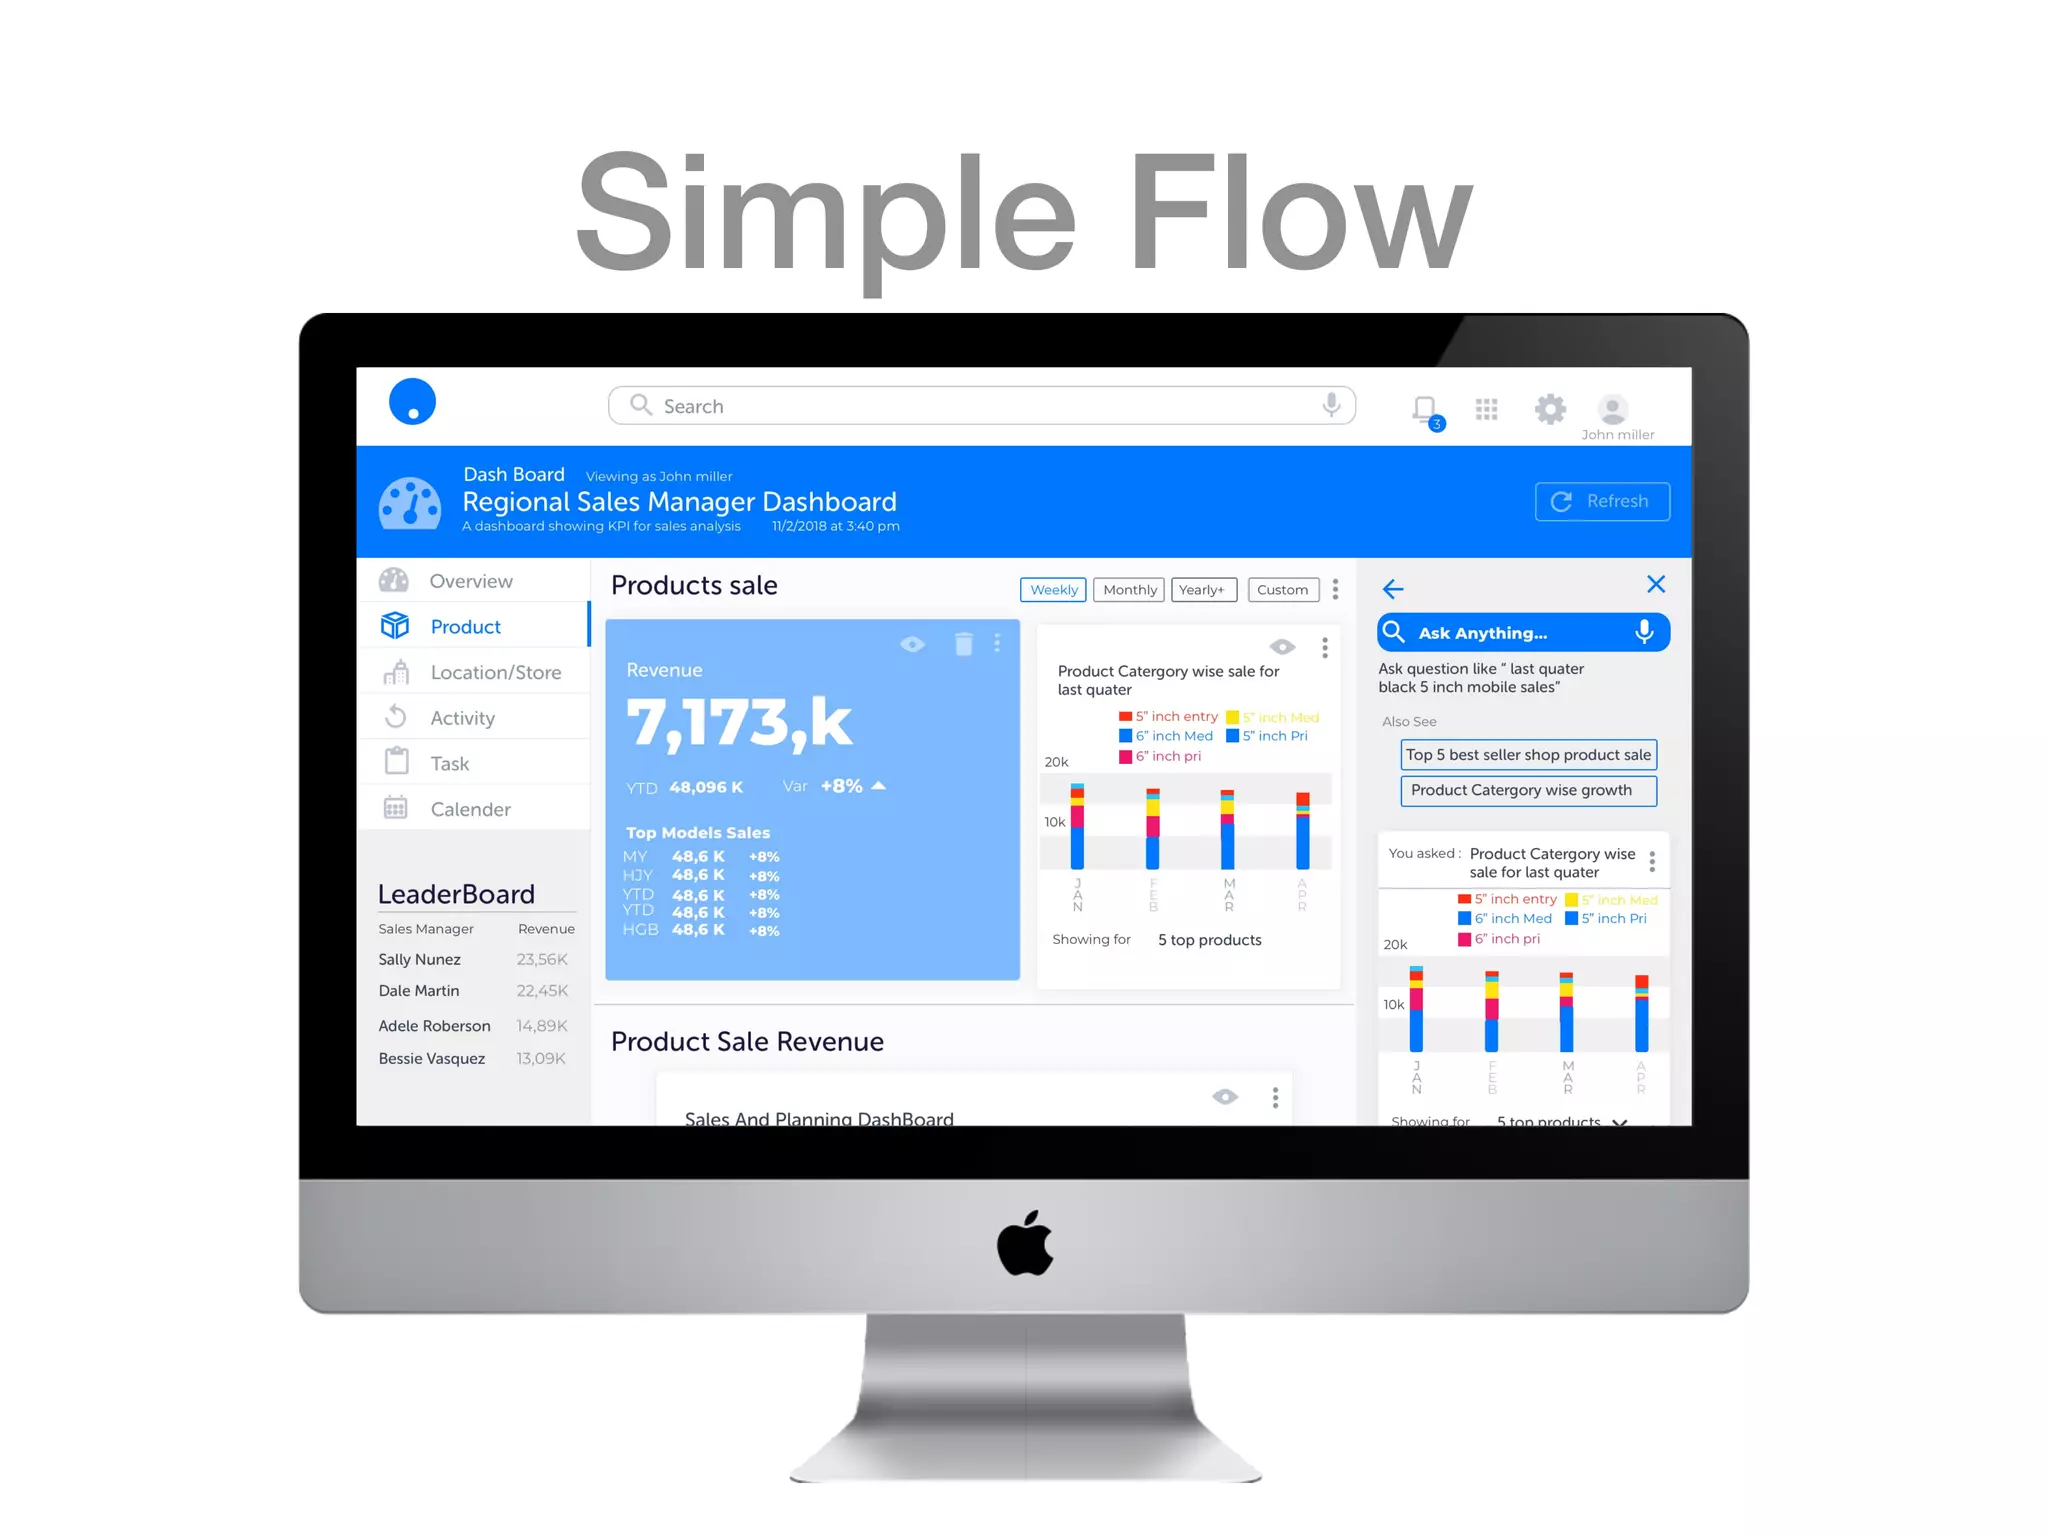
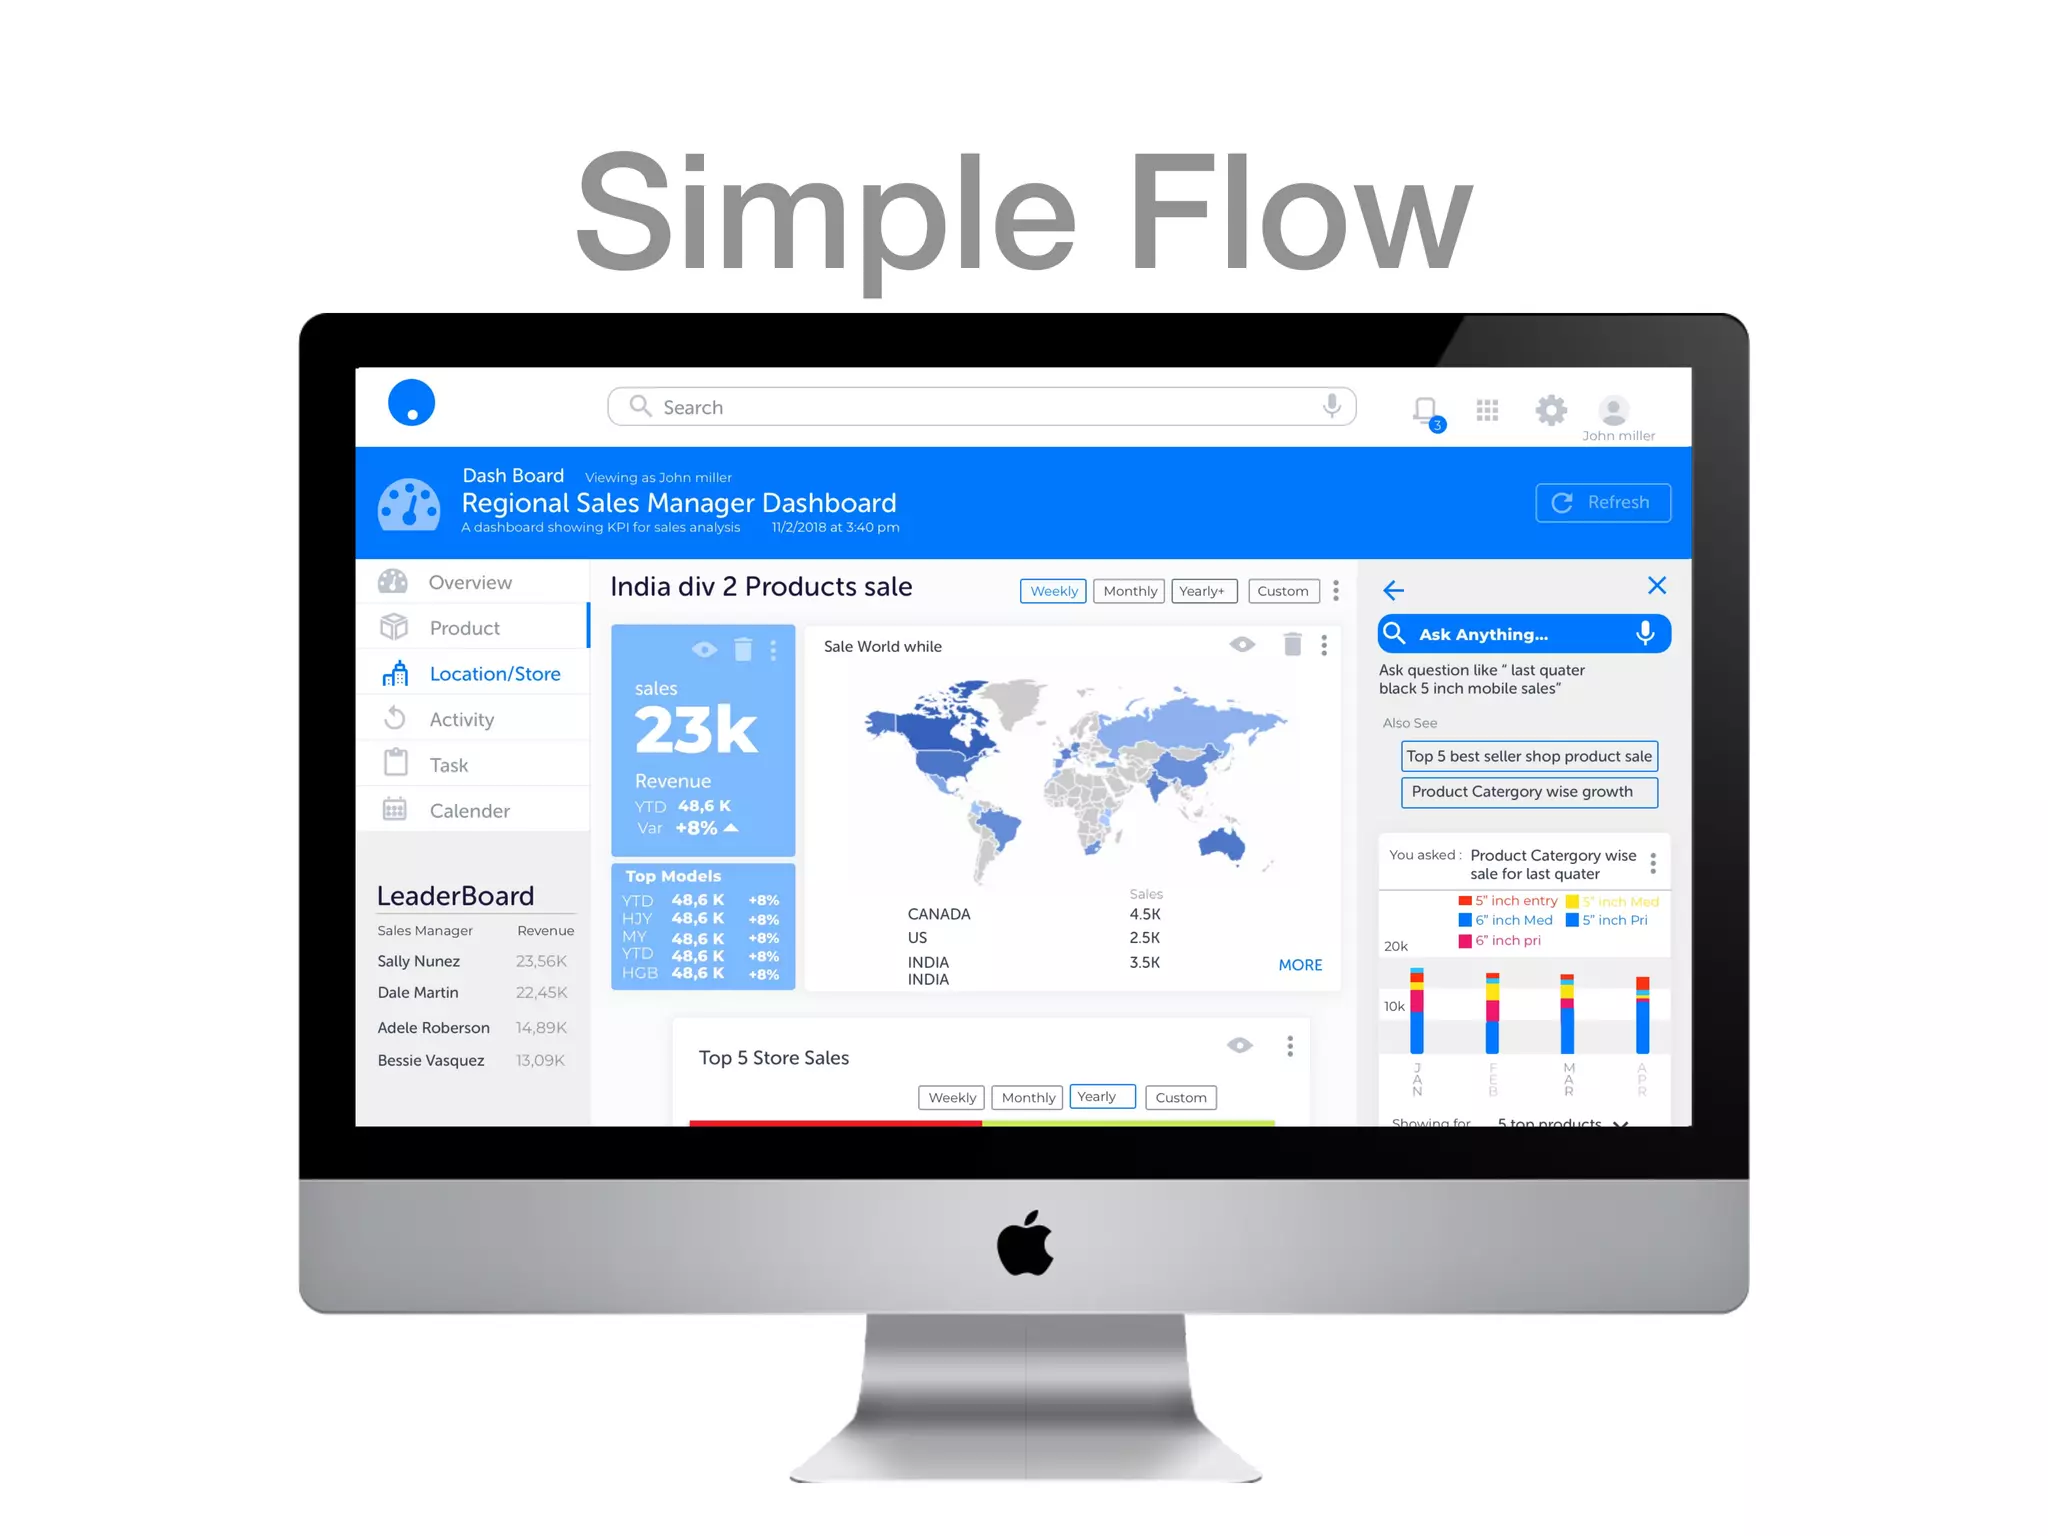

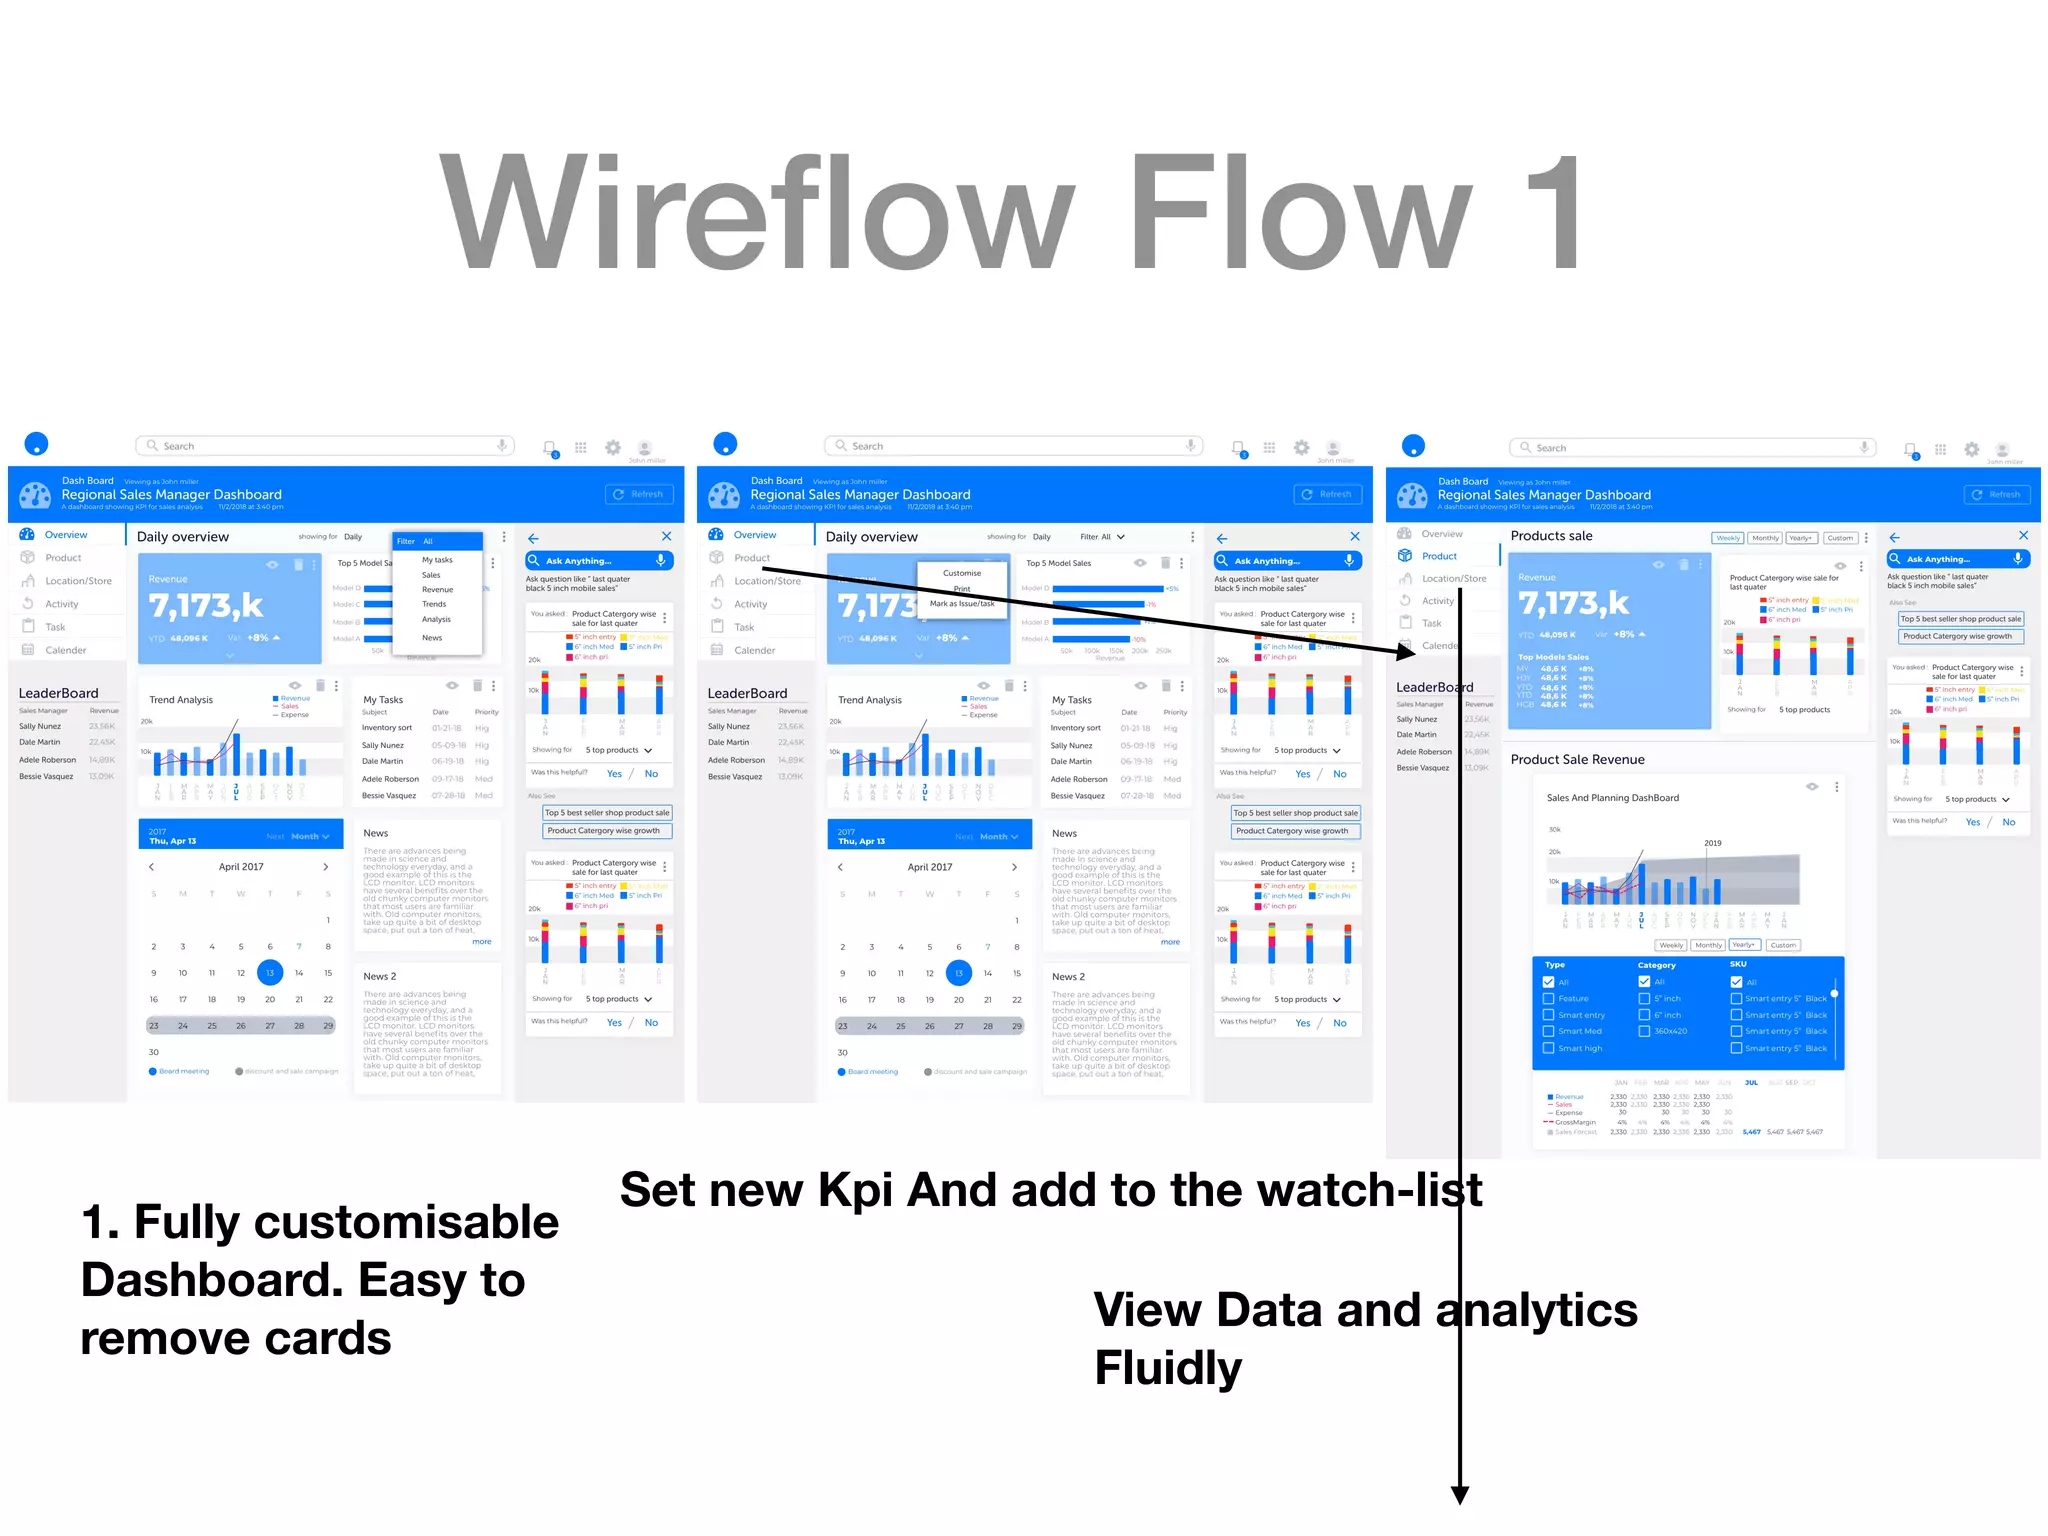
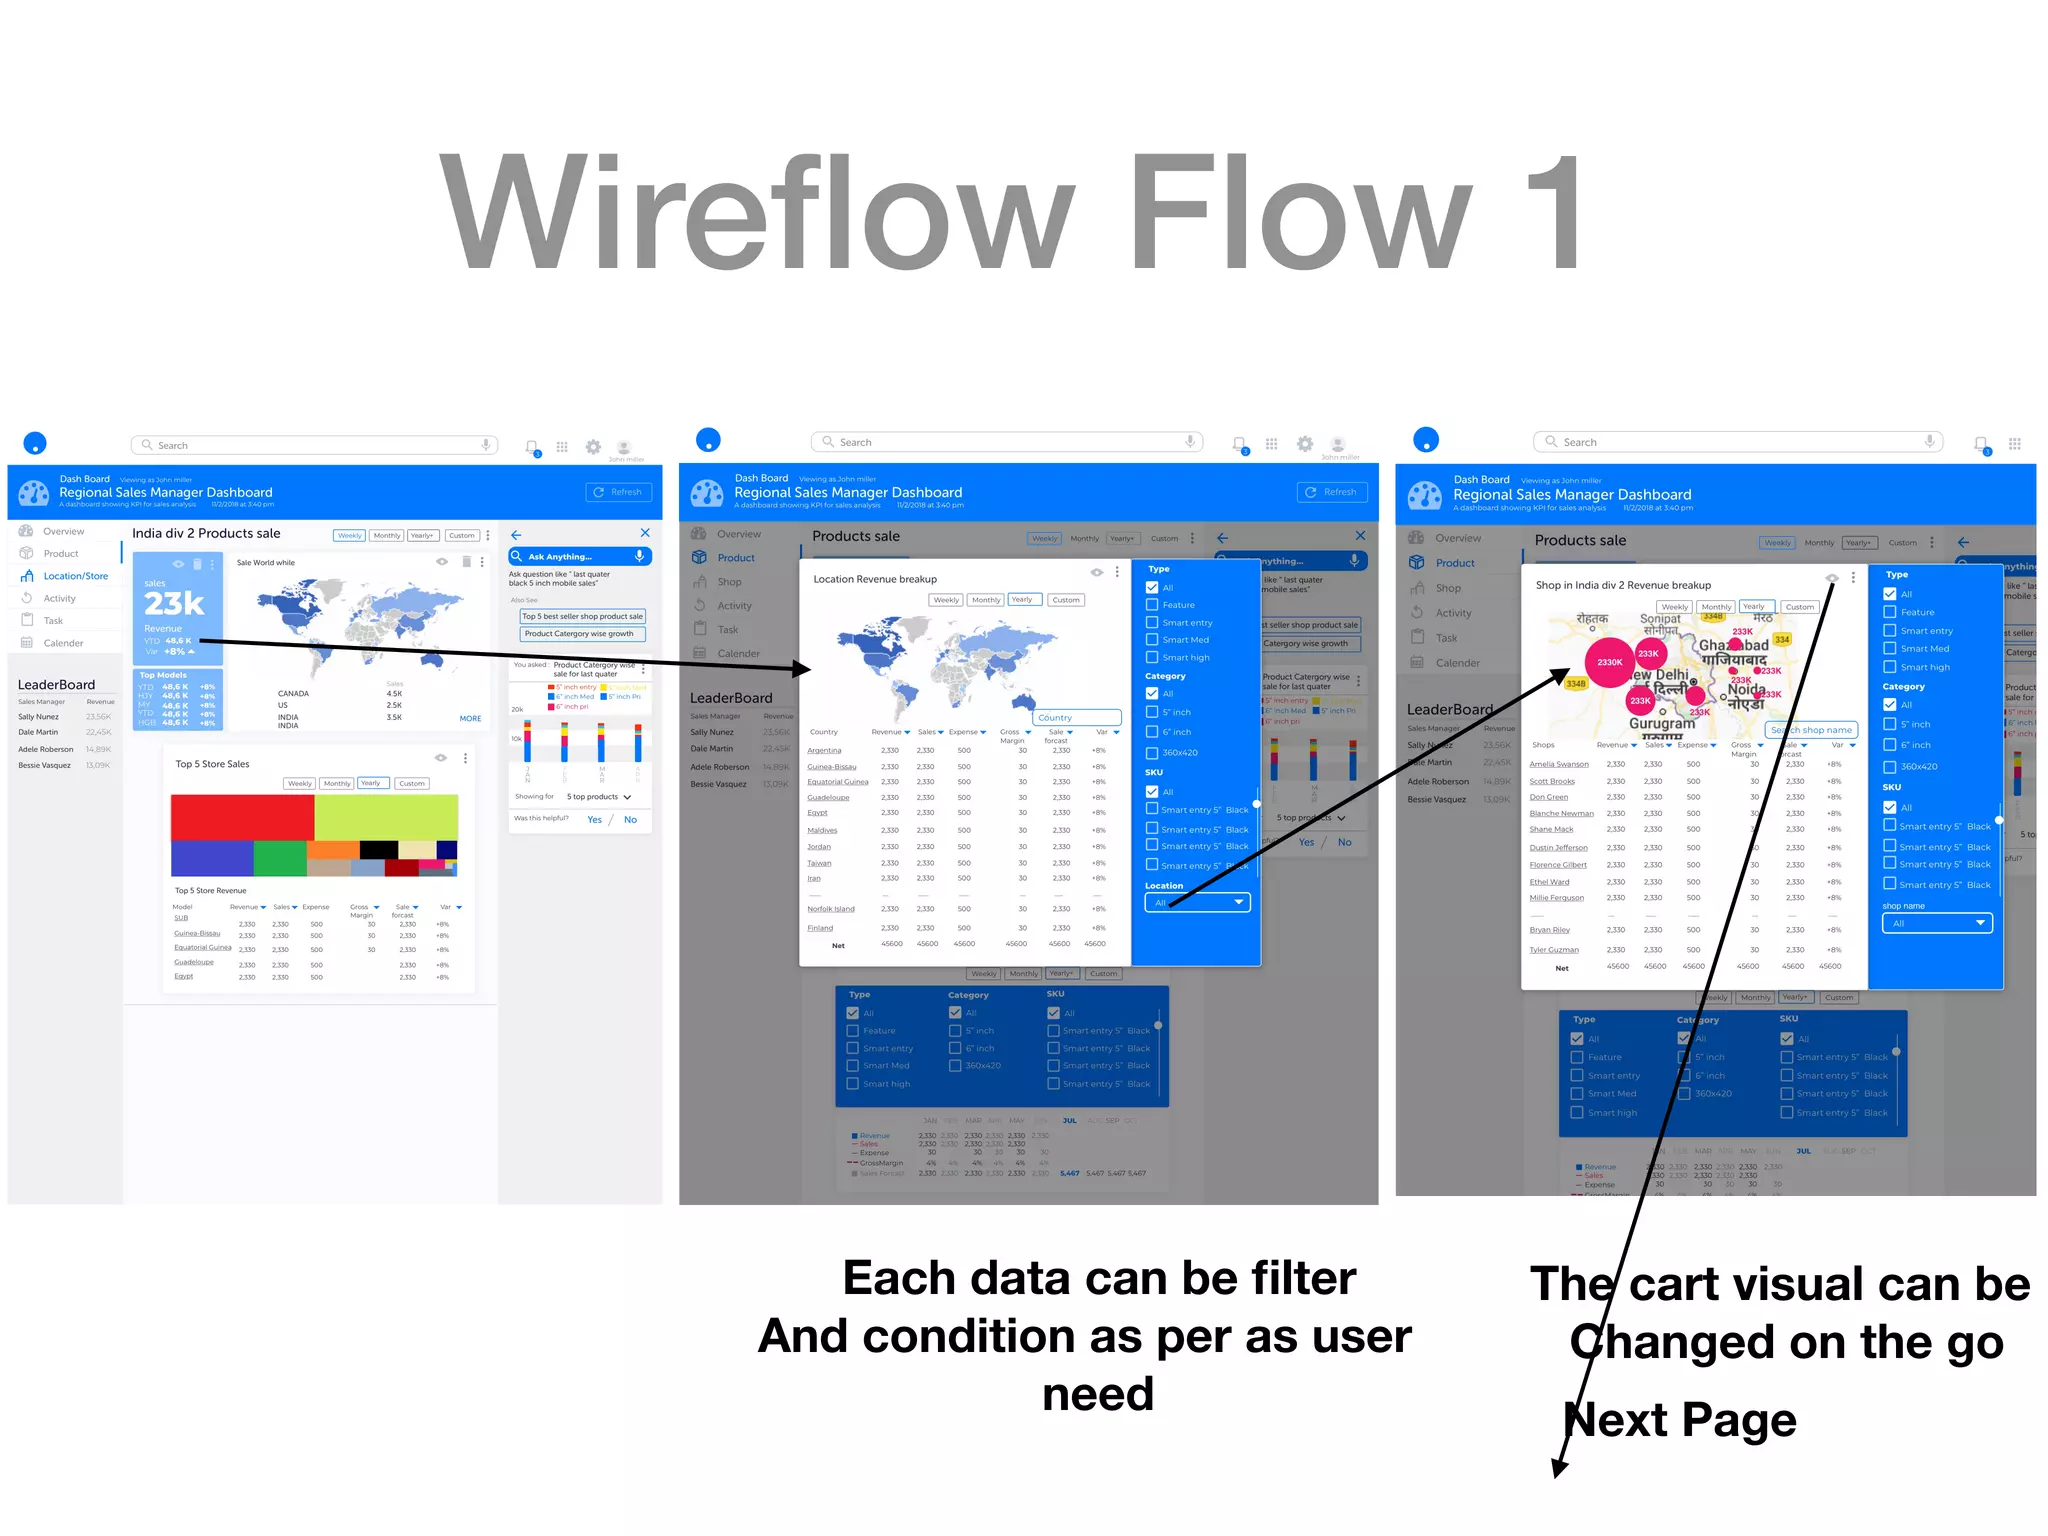
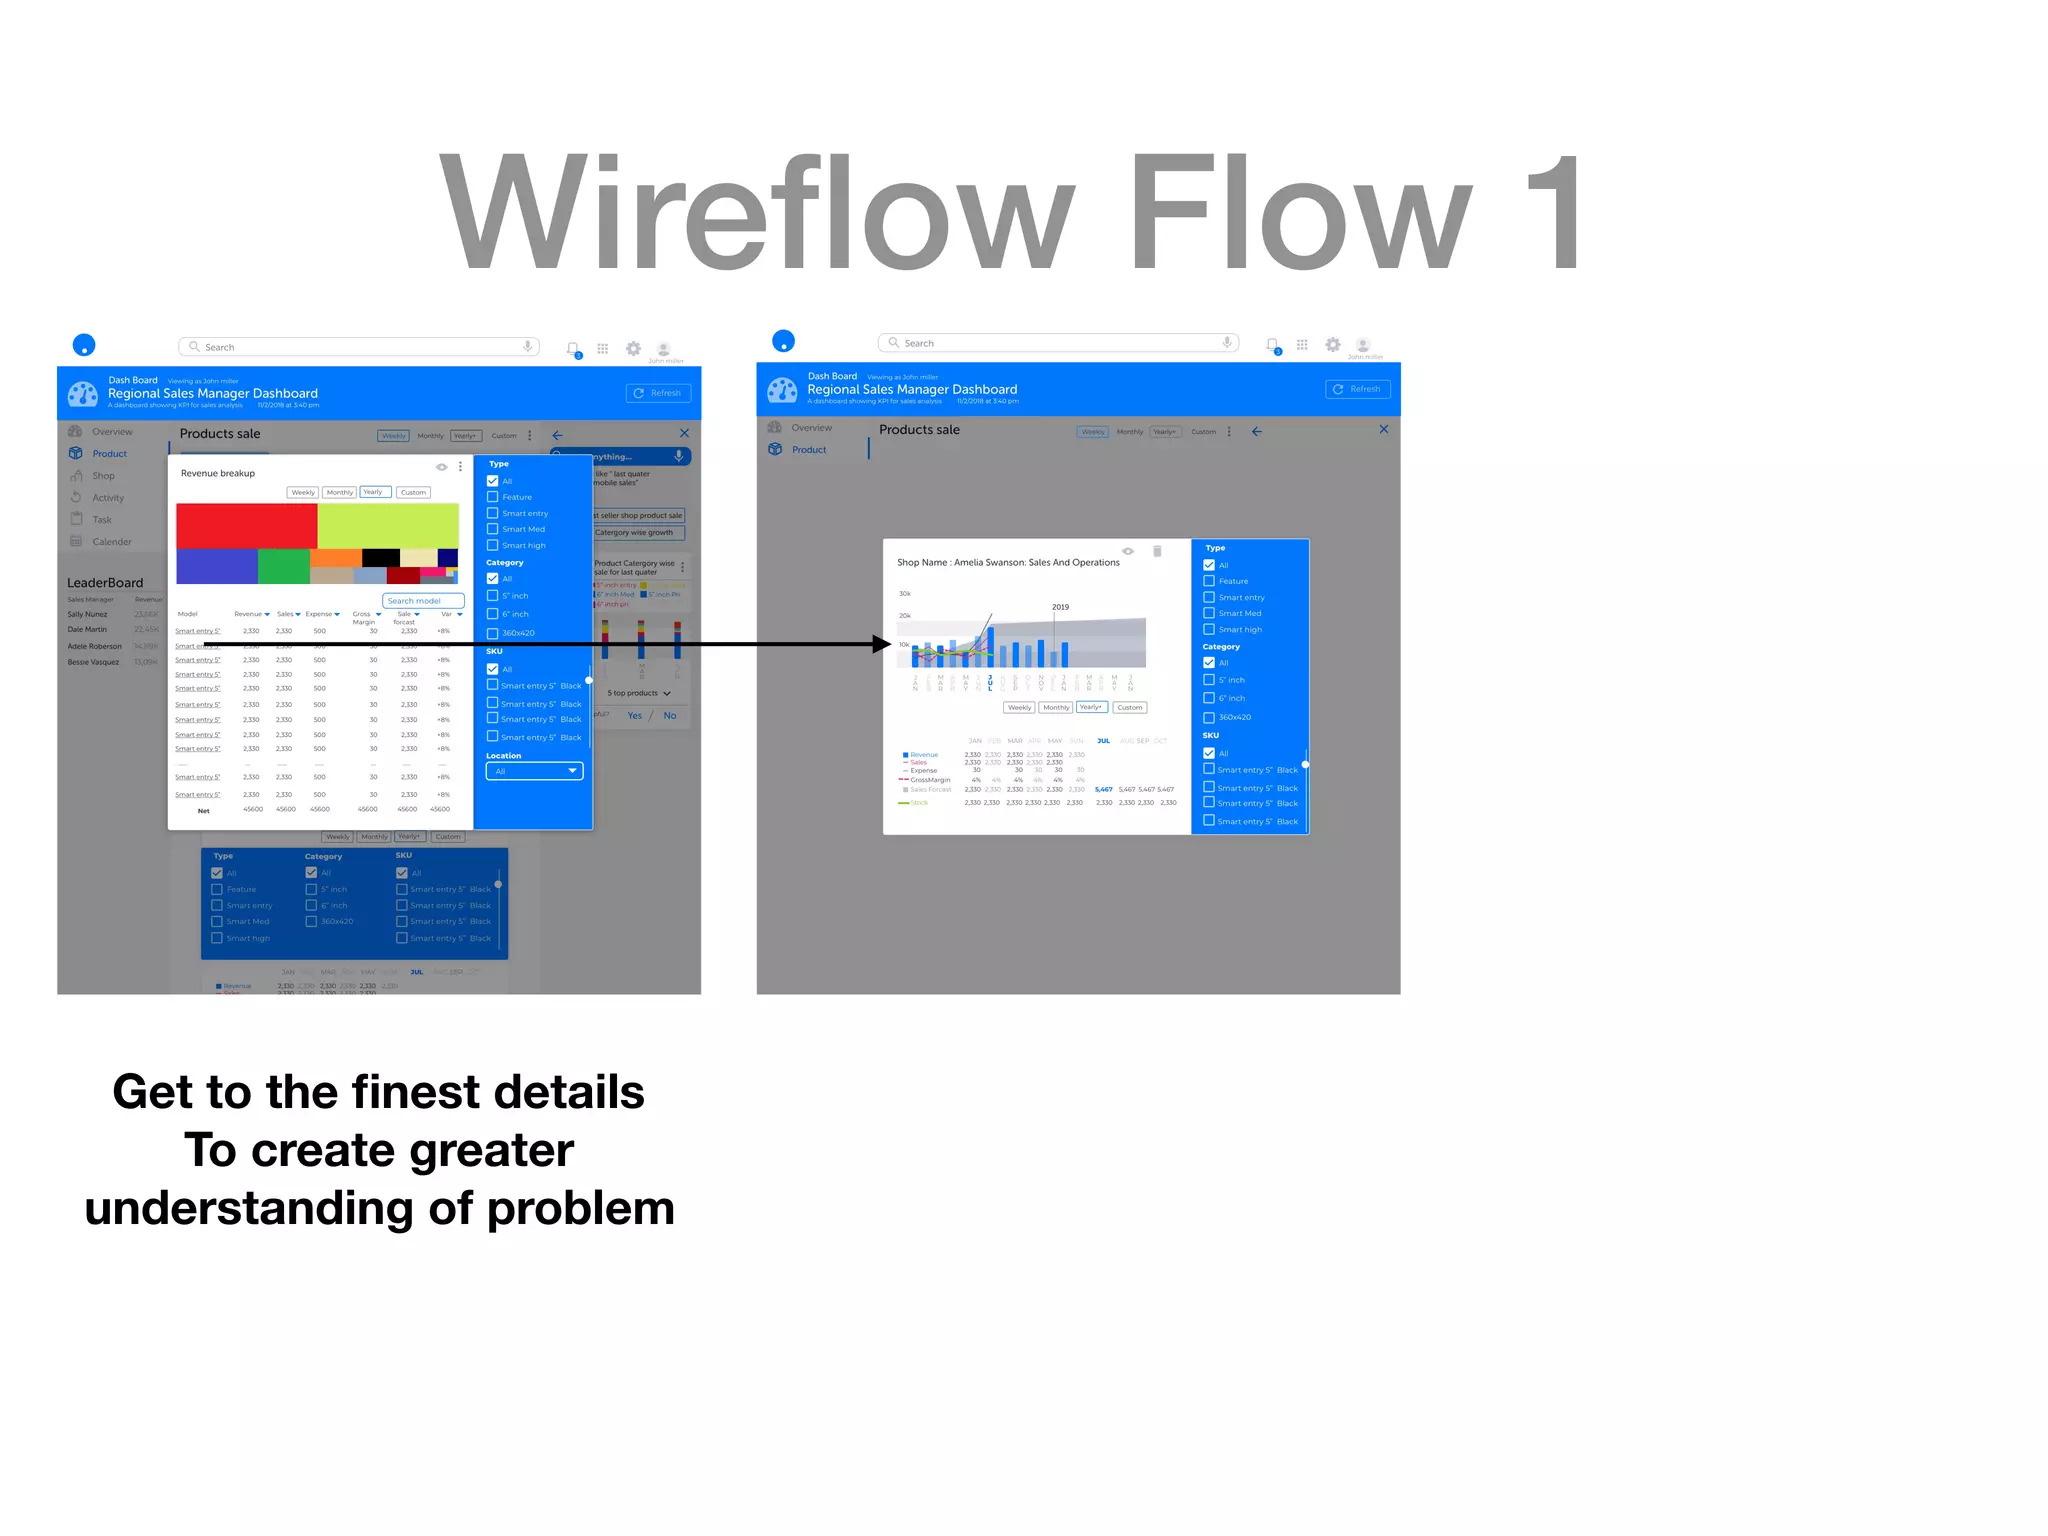
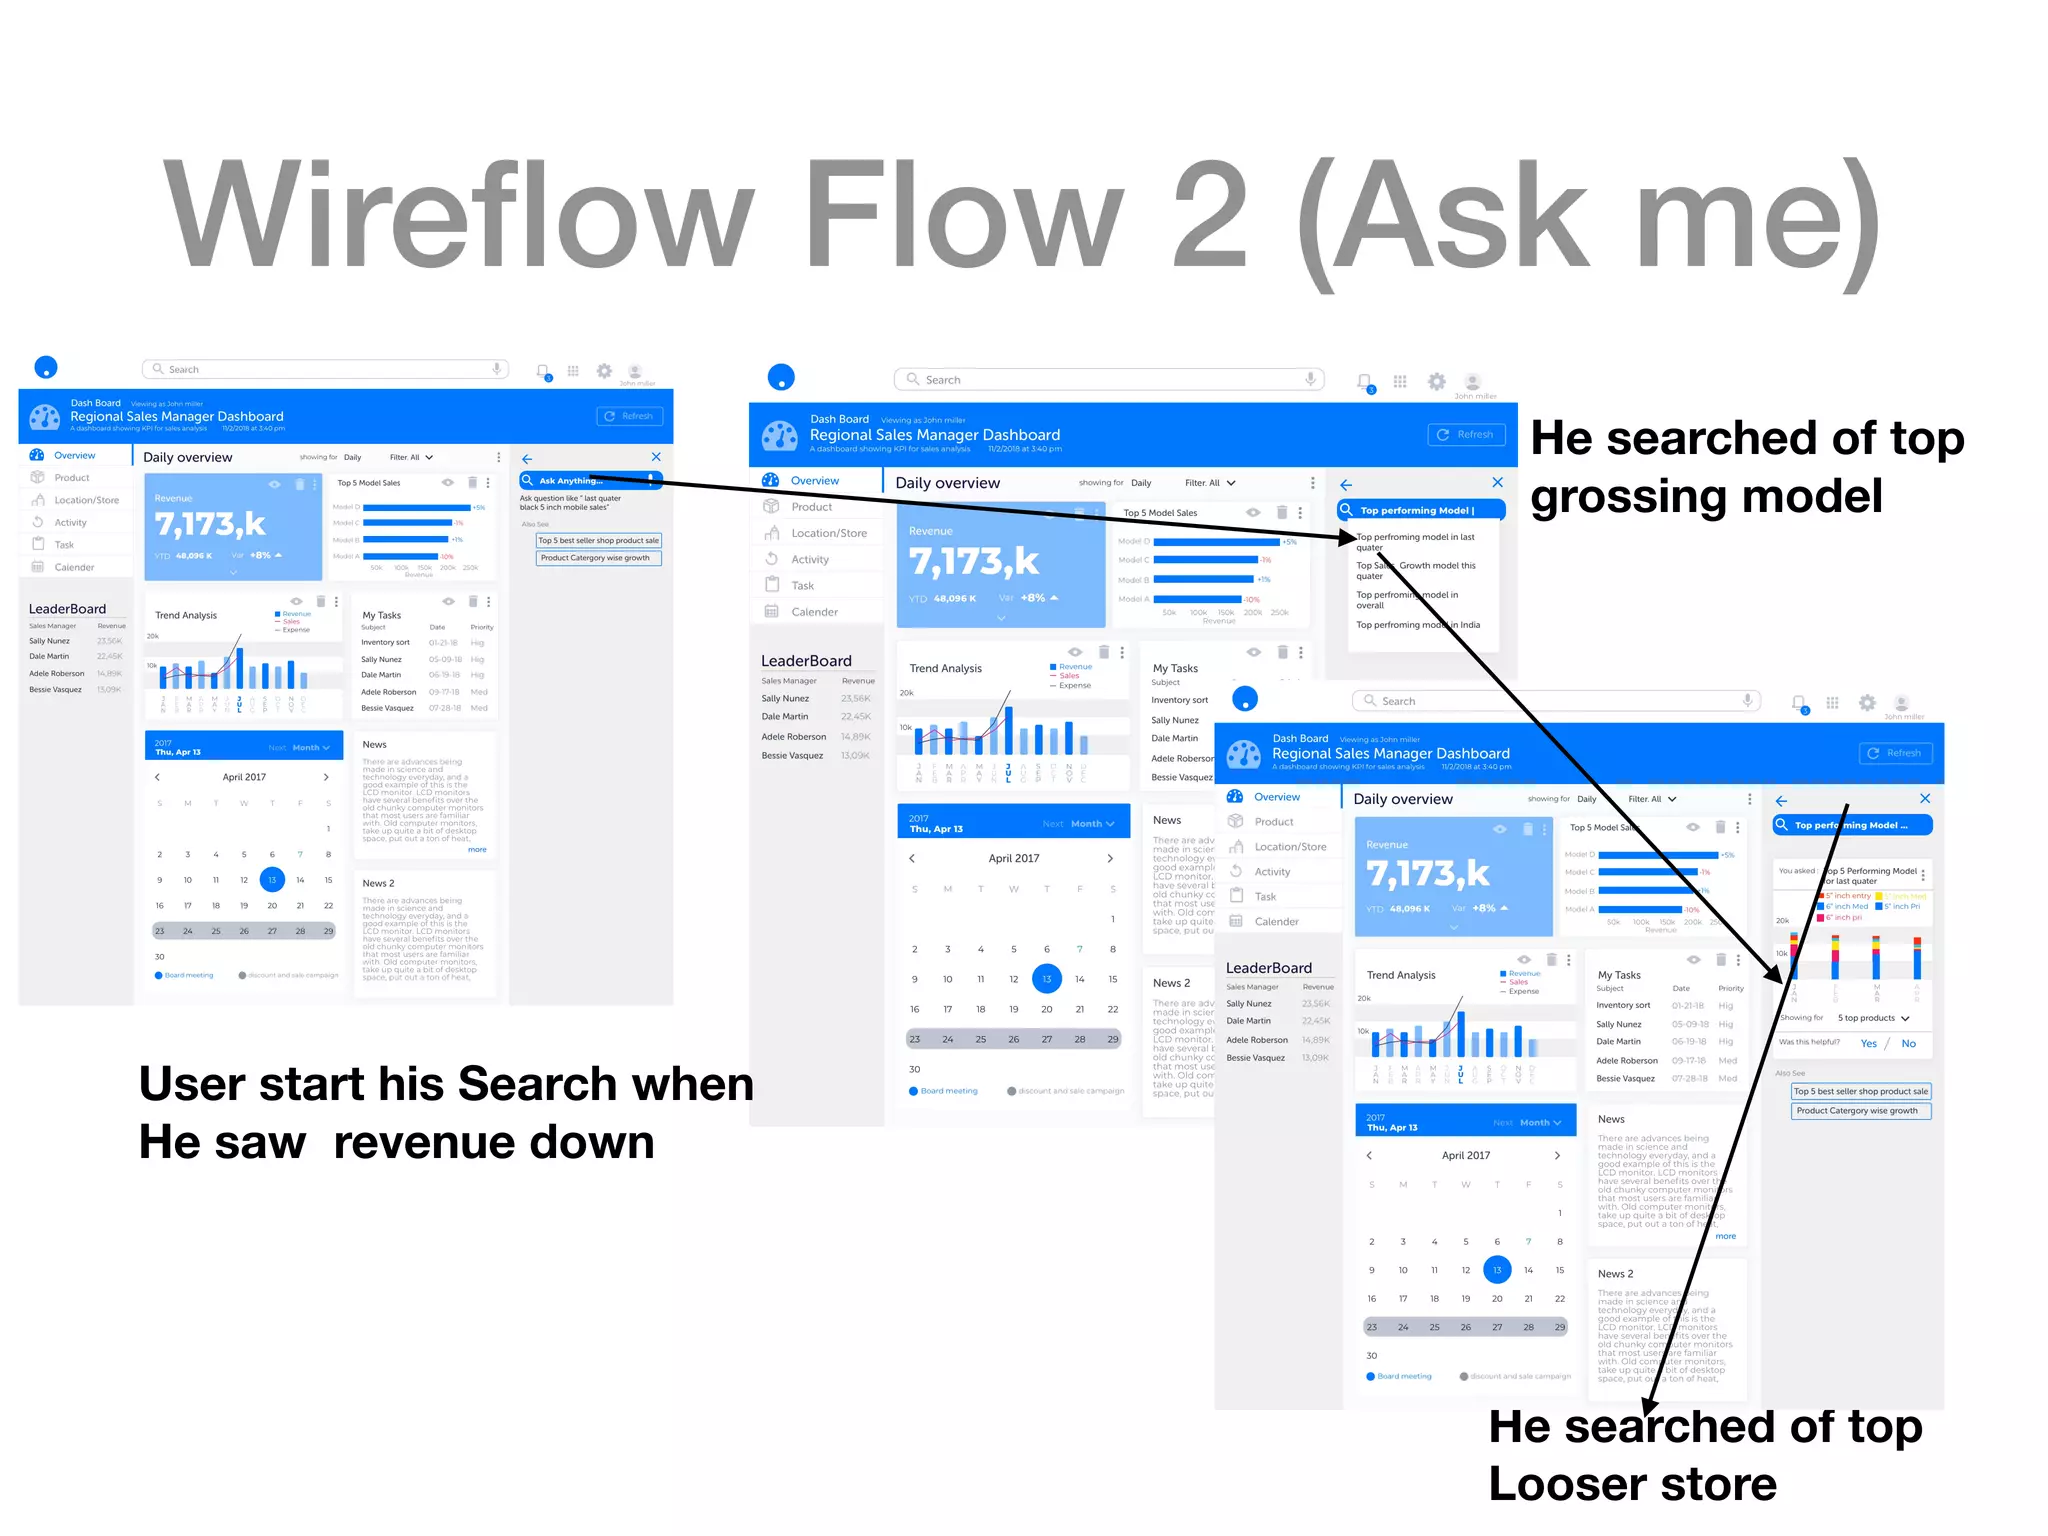
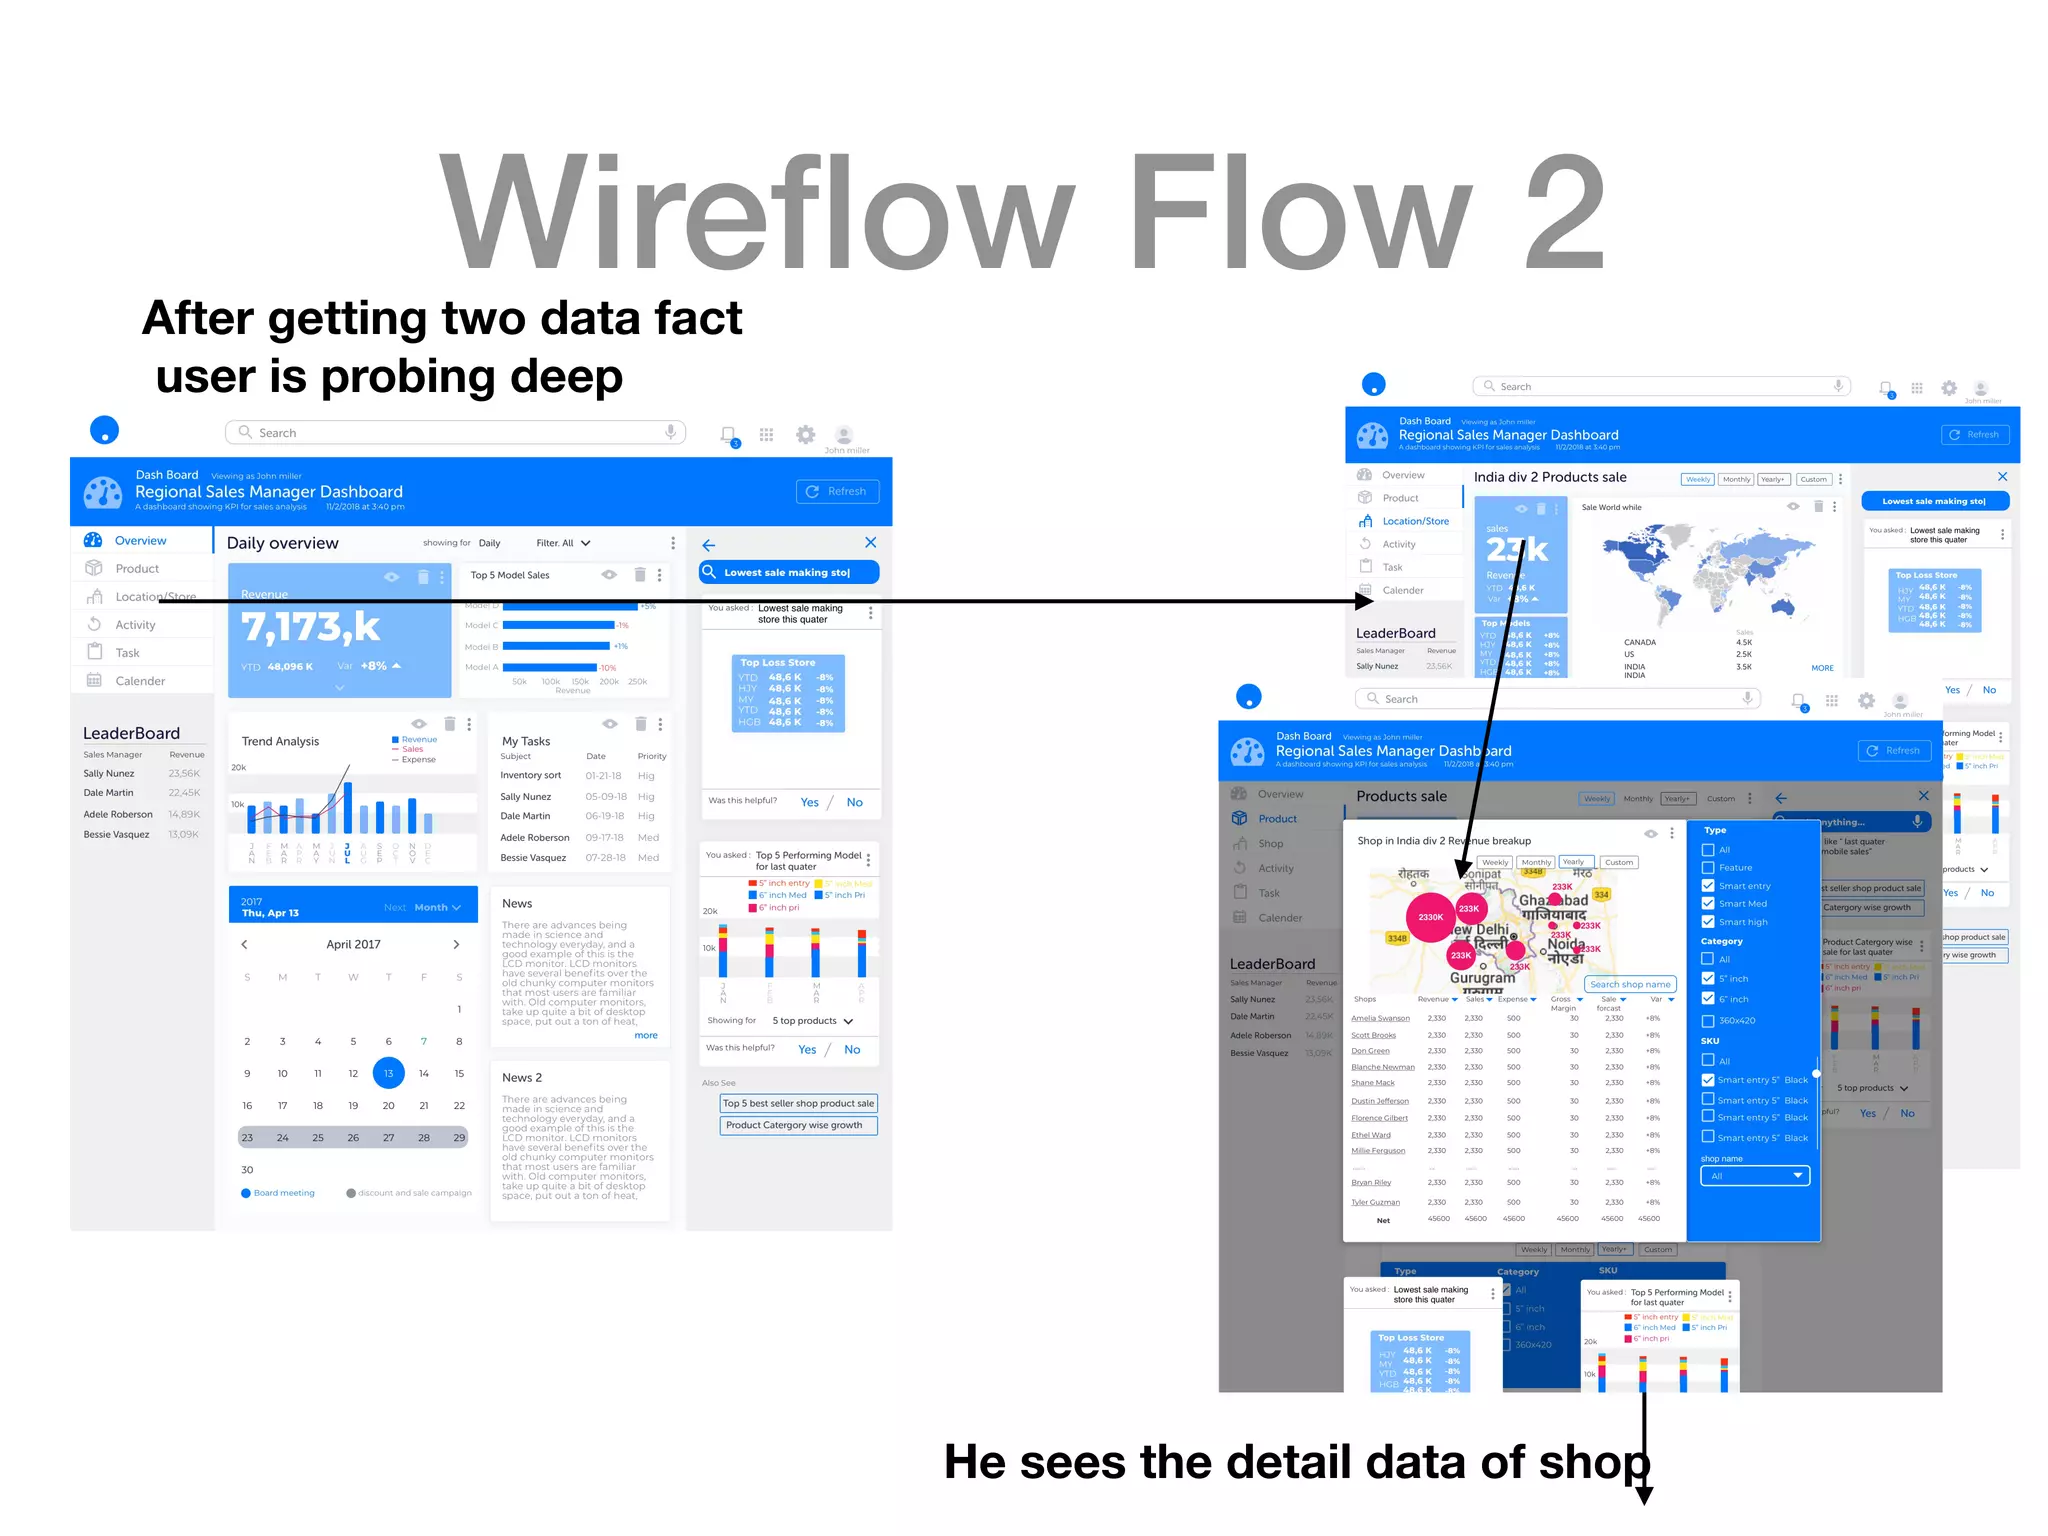
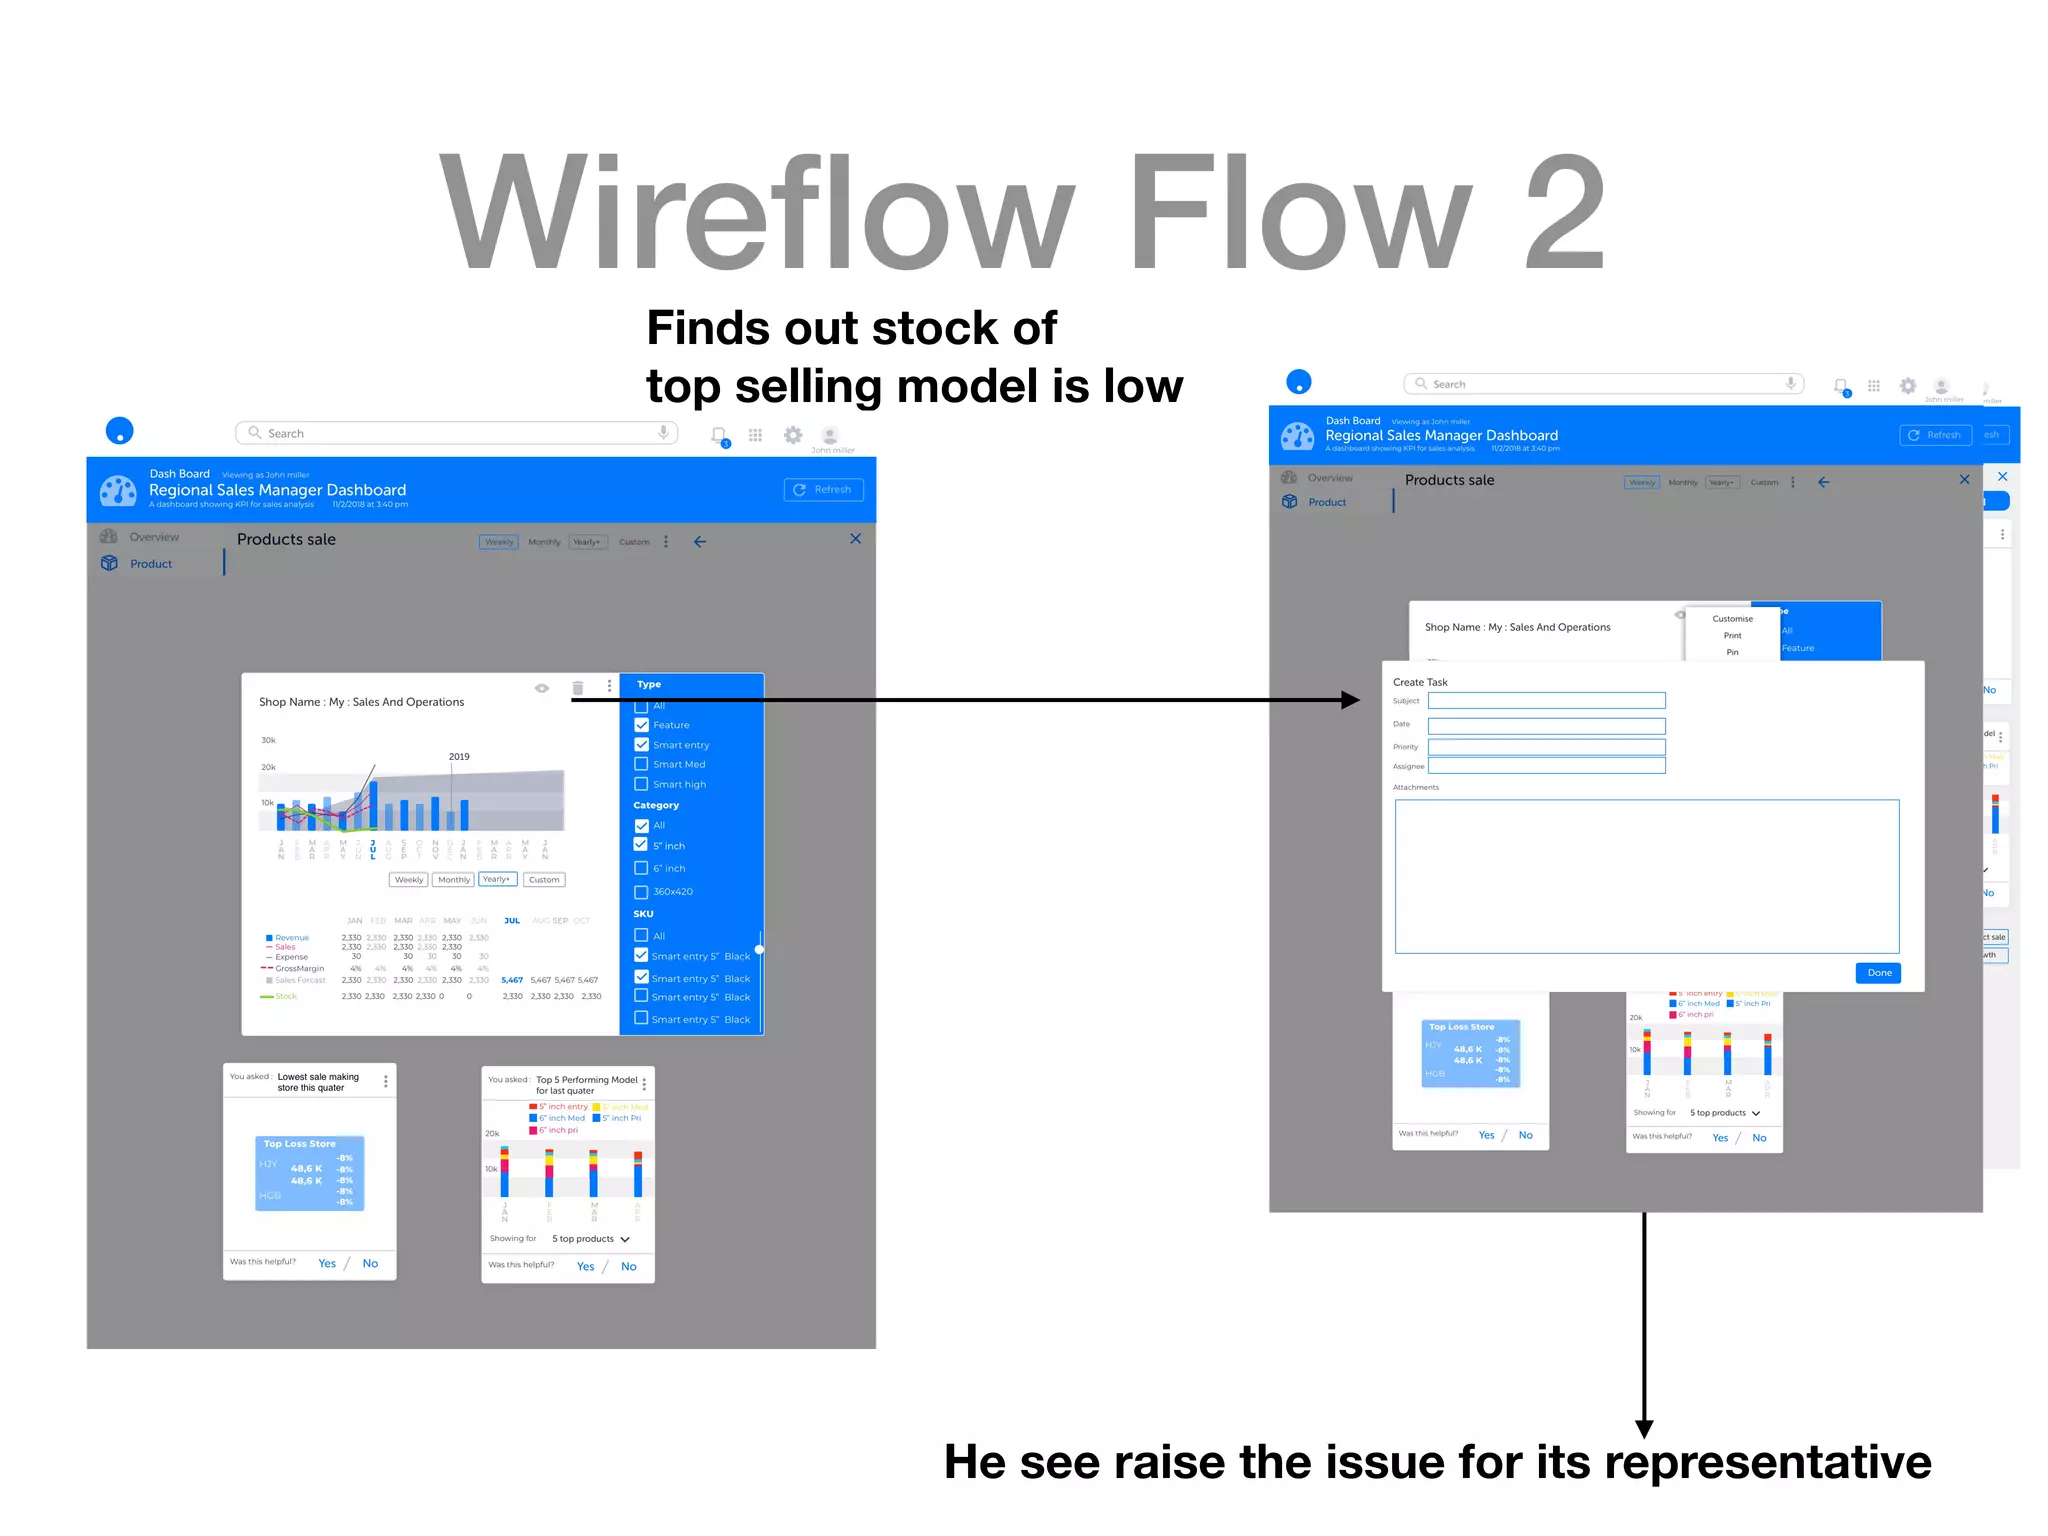

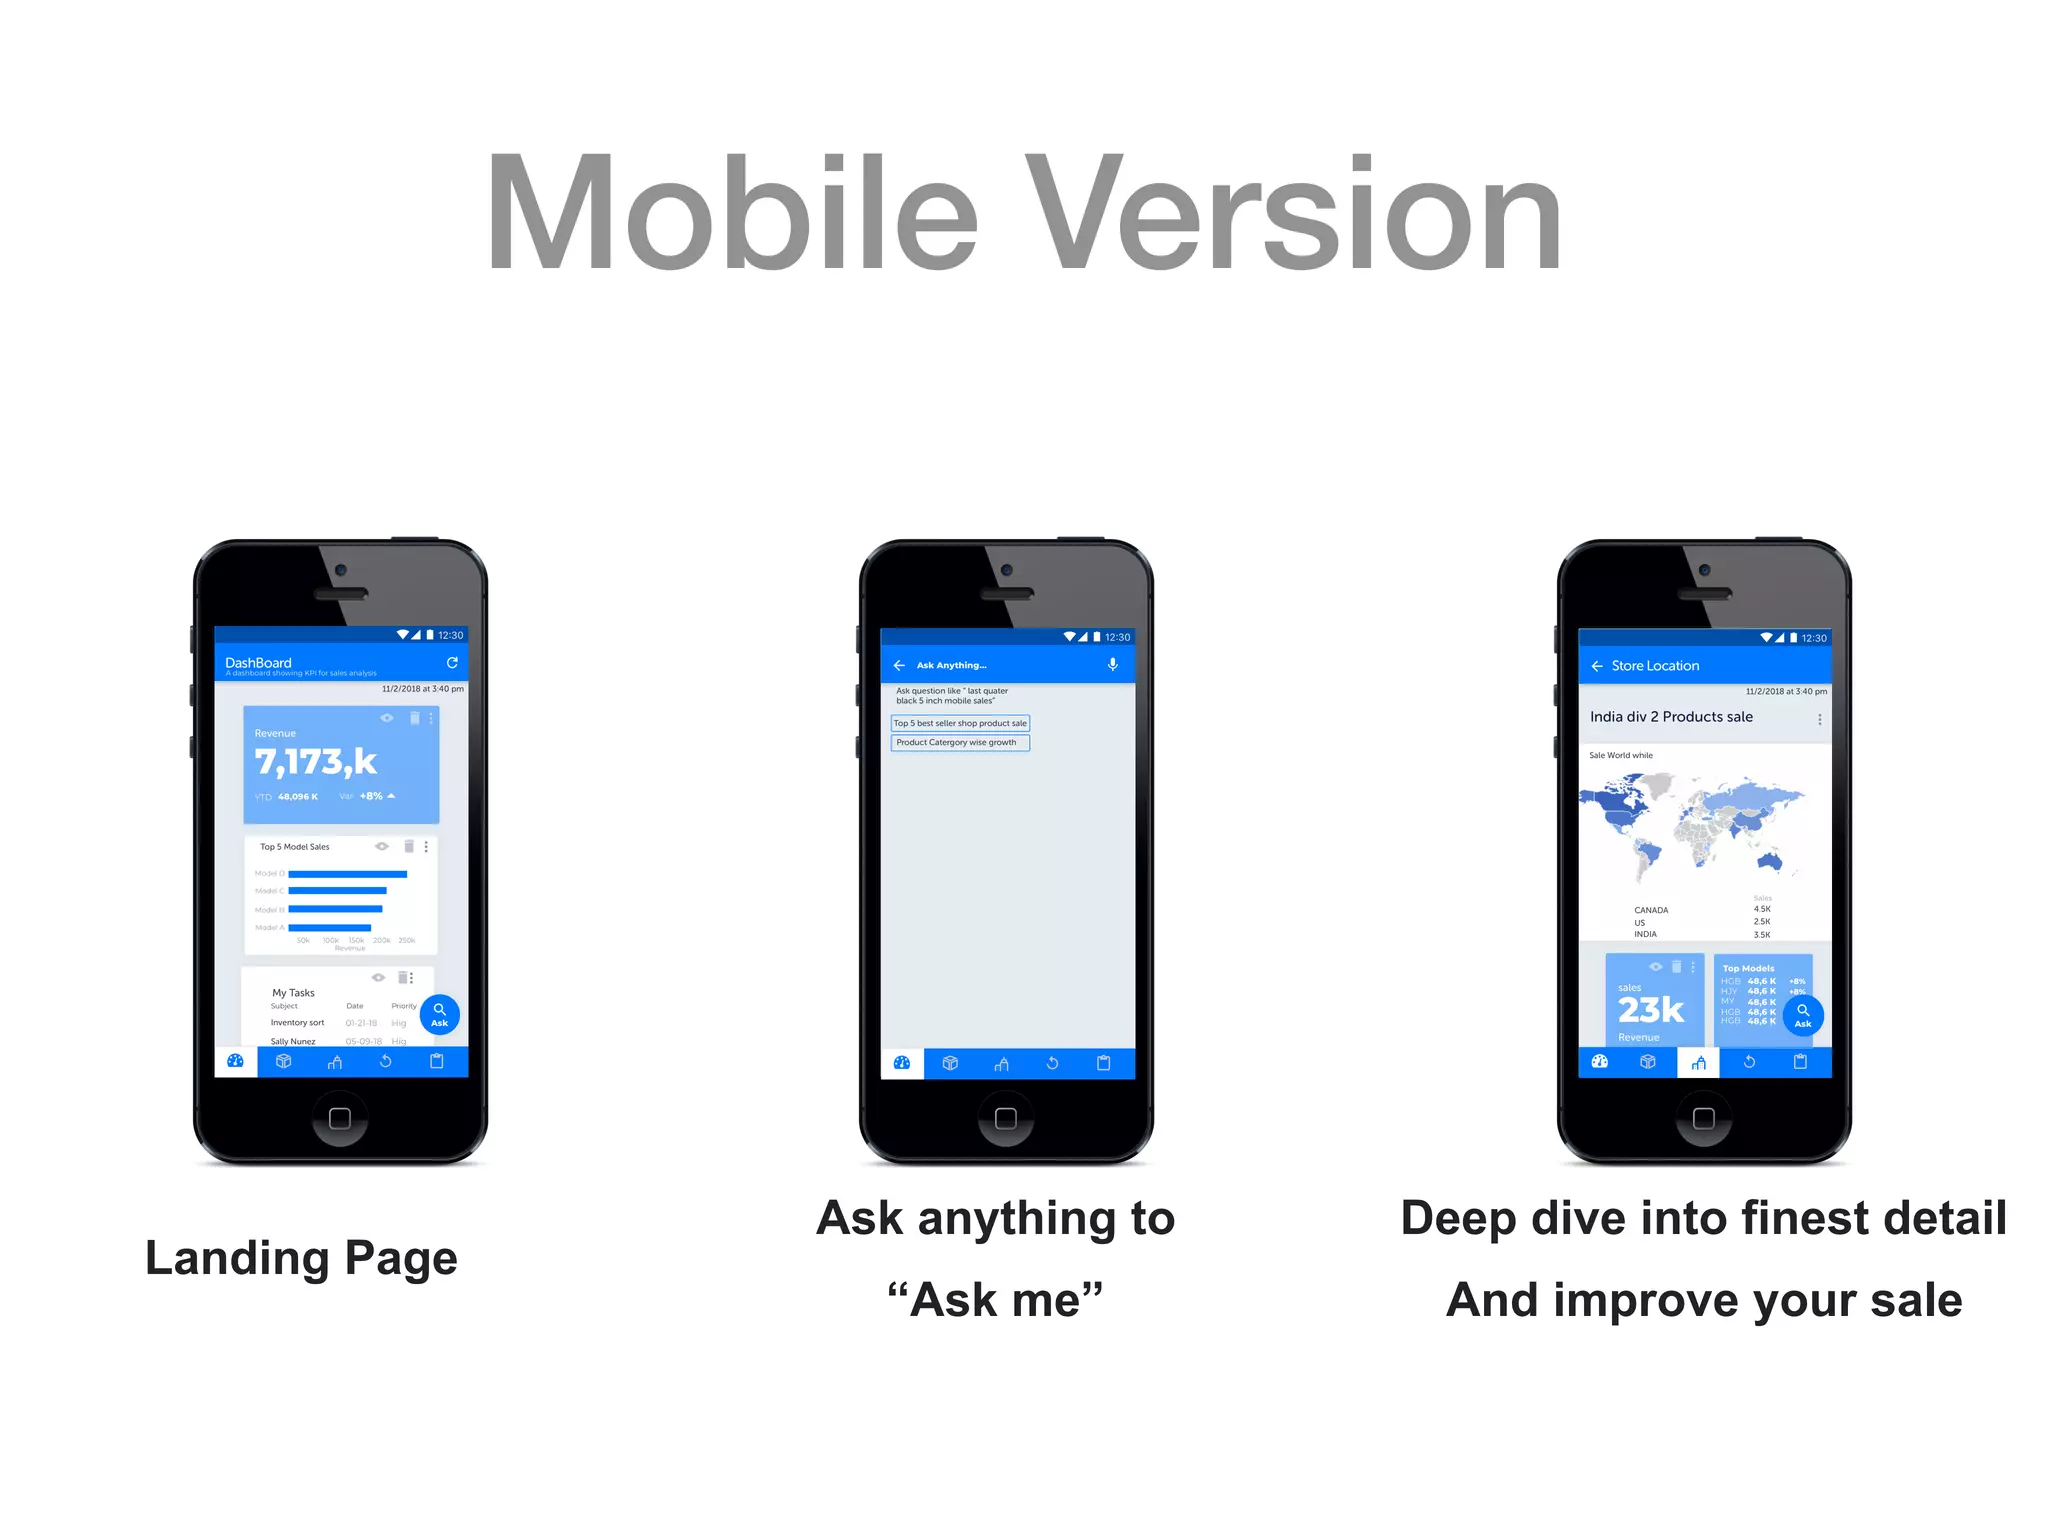


Karl Joe is a regional sales manager who is tasked with meeting sales targets. He finds the sales data he currently has access to is difficult to analyze and gain insights from due to the large amount of raw and unrelated data presented in tables. This makes it challenging for him to identify problems and take corrective actions. The proposed sales dashboard solution aims to provide Karl Joe with a customizable and visually-rich interface that presents key metrics and filters in an intuitive way. It also leverages voice search and questions to help Karl analyze trends and drill down into store or product-level details more easily. The goal is to empower Karl to make data-driven decisions and monitor performance against goals in a quick and simplified manner.


![[BROCHURE] Italy Tour Project | @SlideON](https://cdn.slidesharecdn.com/ss_thumbnails/brochure8-251215152319-2805af68-thumbnail.jpg?width=640&height=640&fit=bounds)


